
Variables
Note: Looking for prebuilt Grafana dashboards? Check out our full library of dashboards and more →
A variable is a placeholder for a value. When you change the value, the element using the variable will change to reflect the new value.
Variables are displayed as drop-down lists (or in some cases text fields) at the top of the dashboard. These drop-down lists make it easy to update the variable value and thus change the data being displayed in your dashboard.
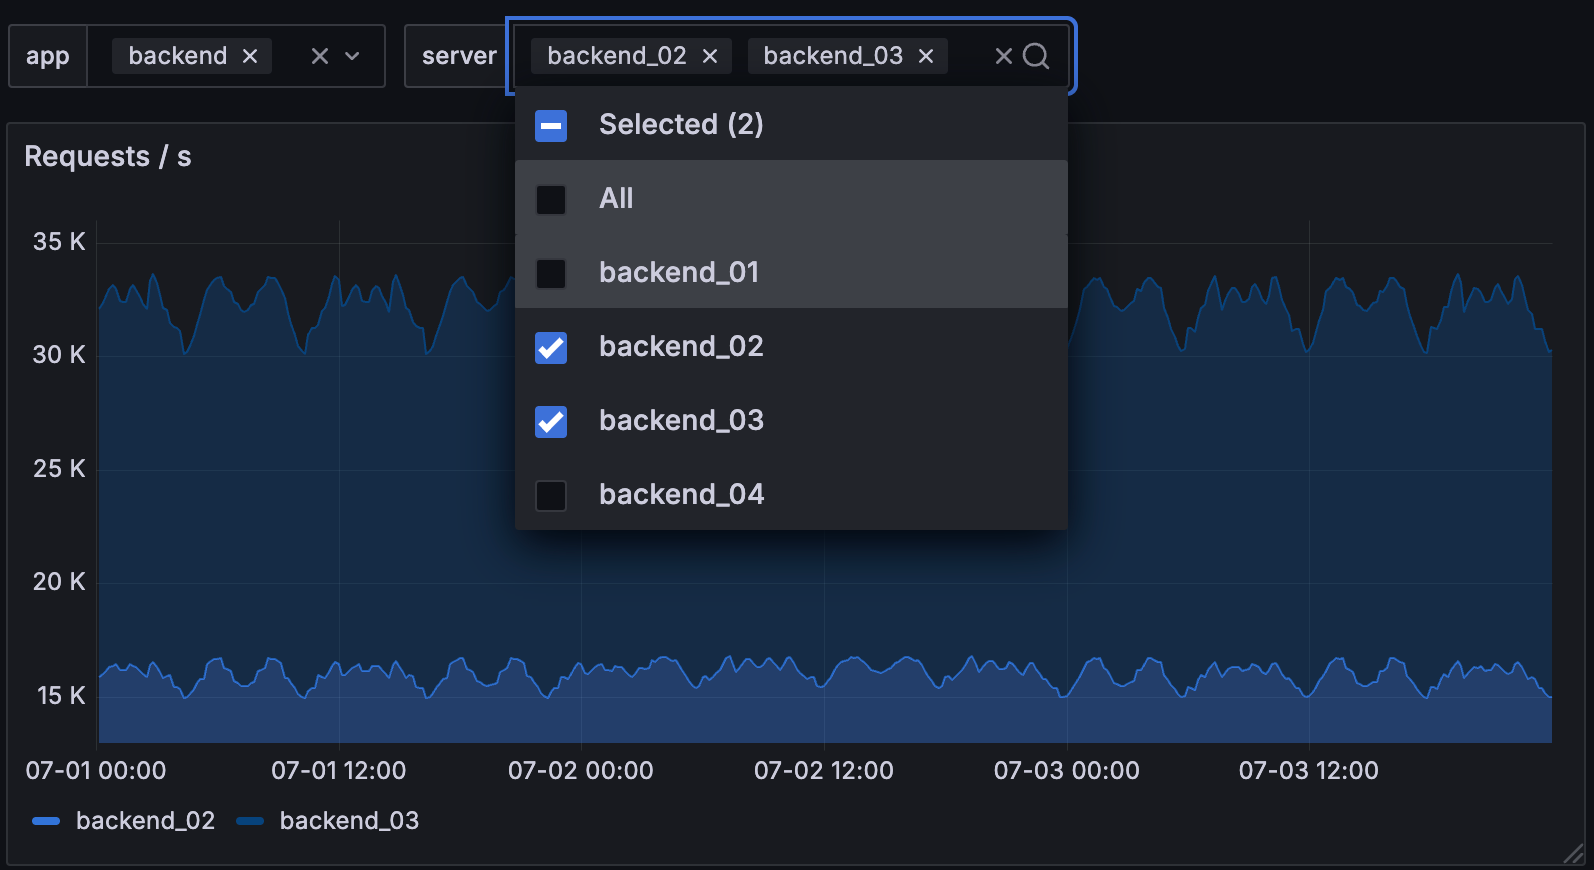
For example, if you needed to monitor several servers, you could make a dashboard for each server. Or you could create one dashboard and use panels with variables like this one, where you can change the server using the variable selector:
Variables allow you to create more interactive dashboards. Instead of hard-coding things like server, application, and sensor names in your metric queries, you can use variables in their place. They’re useful for administrators who want to allow Grafana viewers to adjust visualizations without giving them full editing permissions.
Using variables also allows you to single-source dashboards. If you have multiple identical data sources or servers, you can make one dashboard and use variables to change what you are viewing. This simplifies maintenance and upkeep enormously.

You can use variables in:
- Data source queries
- Panel repeating options
- Dashboard and panel links
- Titles
- Descriptions
- Transformations
To see variable settings, navigate to Dashboard Settings > Variables. Click a variable in the list to see its settings.
With Grafana Play, you can explore and see how it works, learning from practical examples to accelerate your development. This feature can be seen on Templating - Interactive dashboard.
Template variables
A template is any query that contains a variable.
Queries with text that starts with $ are templates.
Note
In our documentation and in the application, we typically simply refer to a template query as a query, but we often use the terms variable and template variable interchangeably.
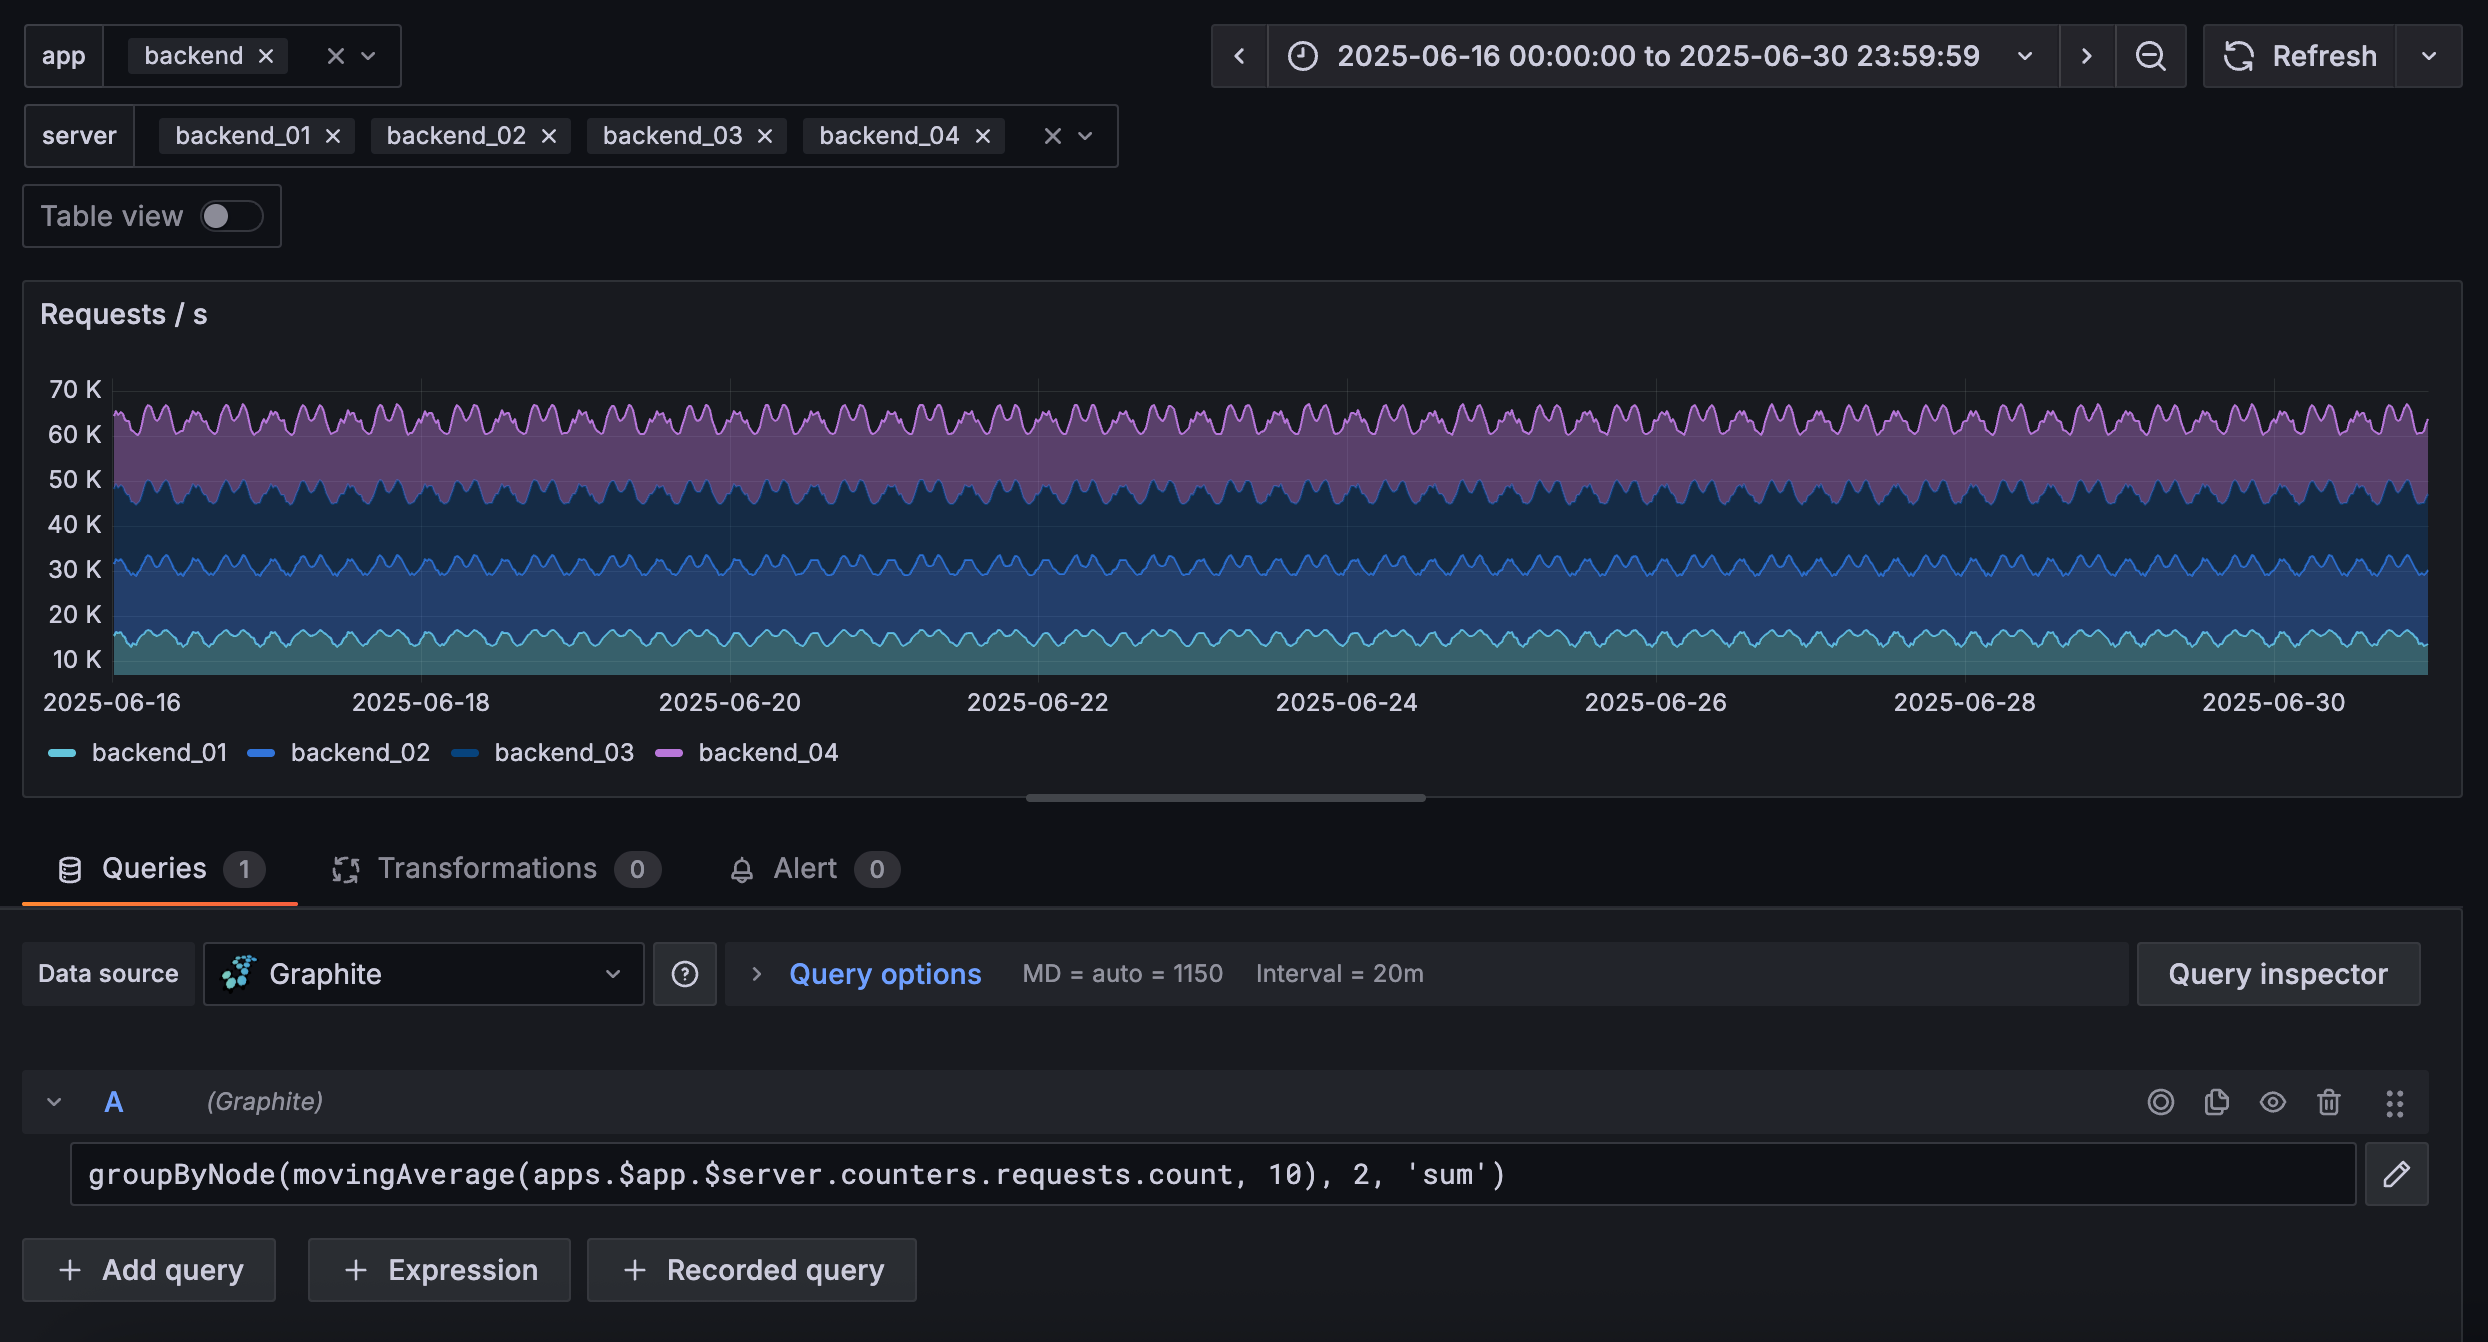
For example, if you were administering a dashboard to monitor several servers, it could have panels that use template queries like this one:
groupByNode(movingAverage(apps.$app.$server.counters.requests.count, 10), 2, 'sum')The following image shows a panel in edit mode using the query:
Variables in URLs
Variable values are always synced to the URL using query parameter syntax, var-<varname>=value.
For example:
https://play.grafana.org/d/HYaGDGIMk/templating-global-variables-and-interpolation?orgId=1&from=now-6h&to=now&timezone=utc&var-Server=CCC&var-MyCustomDashboardVariable=Hello%20World%21In the preceding example, the variables and values are var-Server=CCC and var-MyCustomDashboardVariable=Hello%20World%21.
Additional examples
The following dashboards in Grafana Play provide examples of template variables:
- Templating - Repeated panels - Using query variables to control how many panels appear in a dashboard.
- Templating - Nested Variables Drilldown - Demonstrates how changing one variable value can change the values available in a nested variable.
- Templating - Global variables and interpolation - Shows you how the syntax for Grafana variables works.
Next steps
The following topics describe how to add and manage variables in your dashboards:
Was this page helpful?
Related resources from Grafana Labs


