
Panel editor overview
In the panel editor, you can update all the elements of a visualization including the data source, queries, time range, and visualization display options.
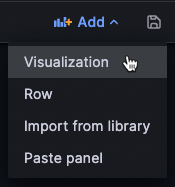
To add a panel in a new dashboard click + Add visualization in the middle of the dashboard. To add a panel to an existing dashboard, click Add in the dashboard header and select Visualization in the drop-down:
Panel menu
To access the panel editor, hover over the top-right corner of any panel. Click the panel menu icon that appears and select Edit. The panel menu gives you access to the following actions:
- View: View the panel in full screen.
- Edit: Open the panel editor to edit panel and visualization options.
- Share: Share the panel as a link, embed, or library panel.
- Explore: Open the panel in Explore, where you can focus on your query.
- Inspect: Open the Inspect drawer, where you can review the panel data, stats, metadata, JSON, and query.
- Data: Open the Inspect drawer in the Data tab.
- Query: Open the Inspect drawer in the Query tab.
- Panel JSON: Open the Inspect drawer in the JSON tab.
- Extensions: Access other actions provided by installed applications, such as declaring an incident. Note that this option doesn’t appear unless you have app plugins installed which contribute an extension to the panel menu.
- More: Access other panel actions.
- Duplicate: Make a copy of the panel. Duplicated panels query data separately from the original panel. You can use the special
Dashboarddata source to share the same query results across panels instead. - Copy: Copy the panel to the clipboard.
- Create library panel: Create a panel that can be imported into other dashboards.
- Create alert: Open the alert rule configuration page in Alerting, where you can create a Grafana-managed alert based on the panel queries.
- Hide legend: Hide the panel legend.
- Get help: Send a snapshot or panel data to Grafana Labs Technical Support.
- Duplicate: Make a copy of the panel. Duplicated panels query data separately from the original panel. You can use the special
- Remove: Remove the panel from the dashboard.
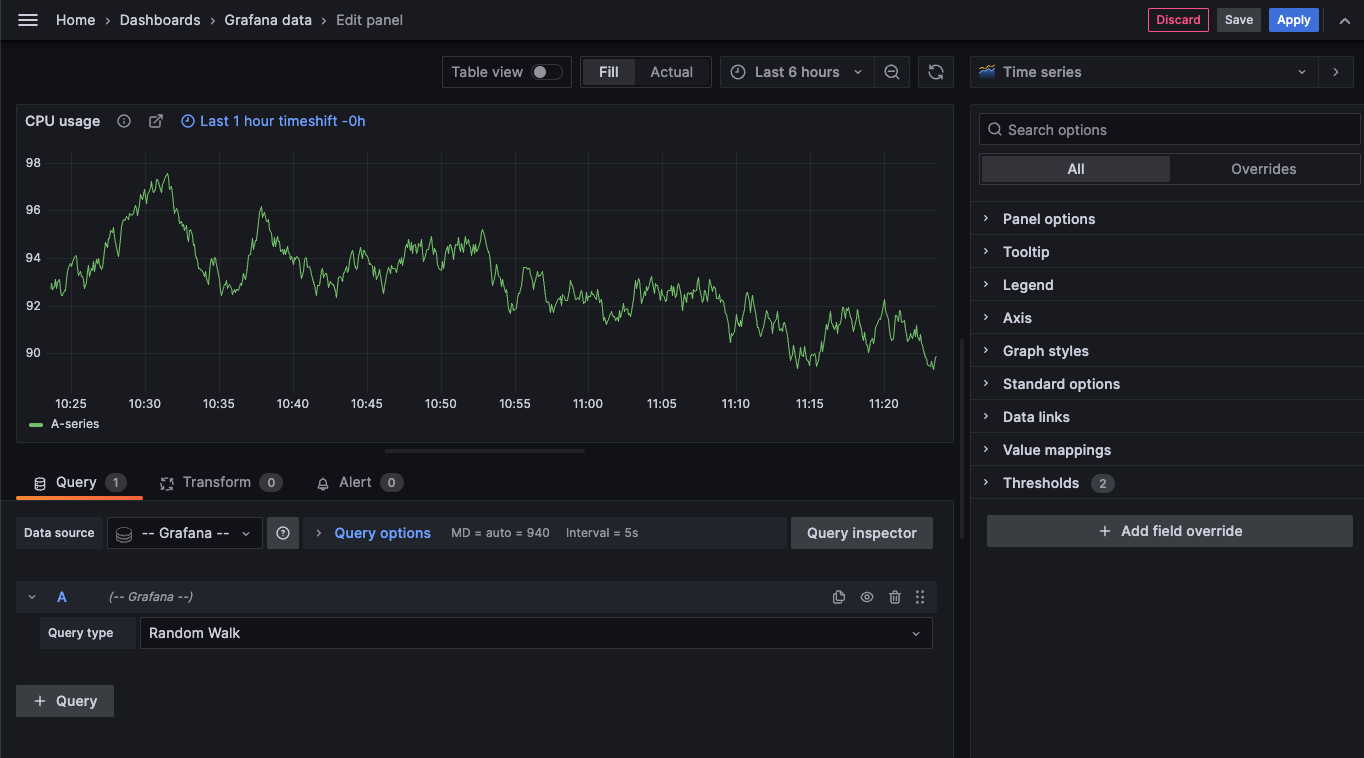
Panel editor
This section describes the areas of the Grafana panel editor.
Panel header: The header section lists the dashboard in which the panel appears and the following controls:
- Discard: Discards changes you have made to the panel since you last saved the dashboard.
- Save: Saves changes you made to the panel.
- Apply: Applies changes you made and closes the panel editor, returning you to the dashboard. You’ll have to save the dashboard to persist the applied changes.
Visualization preview: The visualization preview section contains the following options:
- Table view: Convert any visualization to a table so you can see the data. Table views are helpful for troubleshooting. This view only contains the raw data. It doesn’t include transformations you might have applied to the data or the formatting options available in the Table visualization.
- Fill: The visualization preview fills the available space. If you change the width of the side pane or height of the bottom pane the visualization changes to fill the available space.
- Actual: The visualization preview has the exact size as the size on the dashboard. If not enough space is available, the visualization scales down preserving the aspect ratio.
- Time range controls: Default is either the browser local timezone or the timezone selected at a higher level.
Data section: The data section contains tabs where you enter queries, transform your data, and create alert rules (if applicable).
- Query tab: Select your data source and enter queries here. For more information, refer to Add a query. When you create a new dashboard, you’ll be prompted to select a data source before you get to the panel editor. You set or update the data source in existing dashboards using the drop-down in the Query tab.
- Transform tab: Apply data transformations. For more information, refer to Transform data.
- Alert tab: Write alert rules. For more information, refer to the overview of Grafana Alerting.
Panel display options: The display options section contains tabs where you configure almost every aspect of your data visualization.
Panel inspect drawer
The inspect drawer helps you understand and troubleshoot your panels. You can view the raw data for any panel, export that data to a comma-separated values (CSV) file, view query requests, and export panel and data JSON.
To access the panel inspect drawer from the edit view, hover over any part of the panel to display the actions menu on the top right corner. Click the menu and select Inspect.
Note
Not all panel types include all tabs. For example, dashboard list panels don’t have raw data to inspect, so they don’t display the Stats, Data, or Query tabs.
The panel inspector consists of the following options:
The panel inspect drawer displays opens a drawer on the right side. Click the arrow in the upper right corner to expand or reduce the drawer pane.
Data tab - Shows the raw data returned by the query with transformations applied. Field options such as overrides and value mappings aren’t applied by default.
Stats tab - Shows how long your query takes and how much it returns.
JSON tab - Allows you to view and copy the panel JSON, panel data JSON, and data frame structure JSON. This is useful if you are provisioning or administering Grafana.
Query tab - Shows you the requests to the server sent when Grafana queries the data source.
Error tab - Shows the error. Only visible when query returns error.
Was this page helpful?
Related resources from Grafana Labs


