Dashboard list
Dashboard lists allow you to display dynamic links to other dashboards. You can configure the list to use starred dashboards, recently viewed dashboards, a search query, and dashboard tags.
On each dashboard load, this panel queries the dashboard list, always providing the most up-to-date results.
You can use a dashboard list visualization to display a list of important dashboards that you want to track.
Configure a dashboard list visualization
Once you’ve created a dashboard, the following video shows you how to configure a dashboard list visualization:
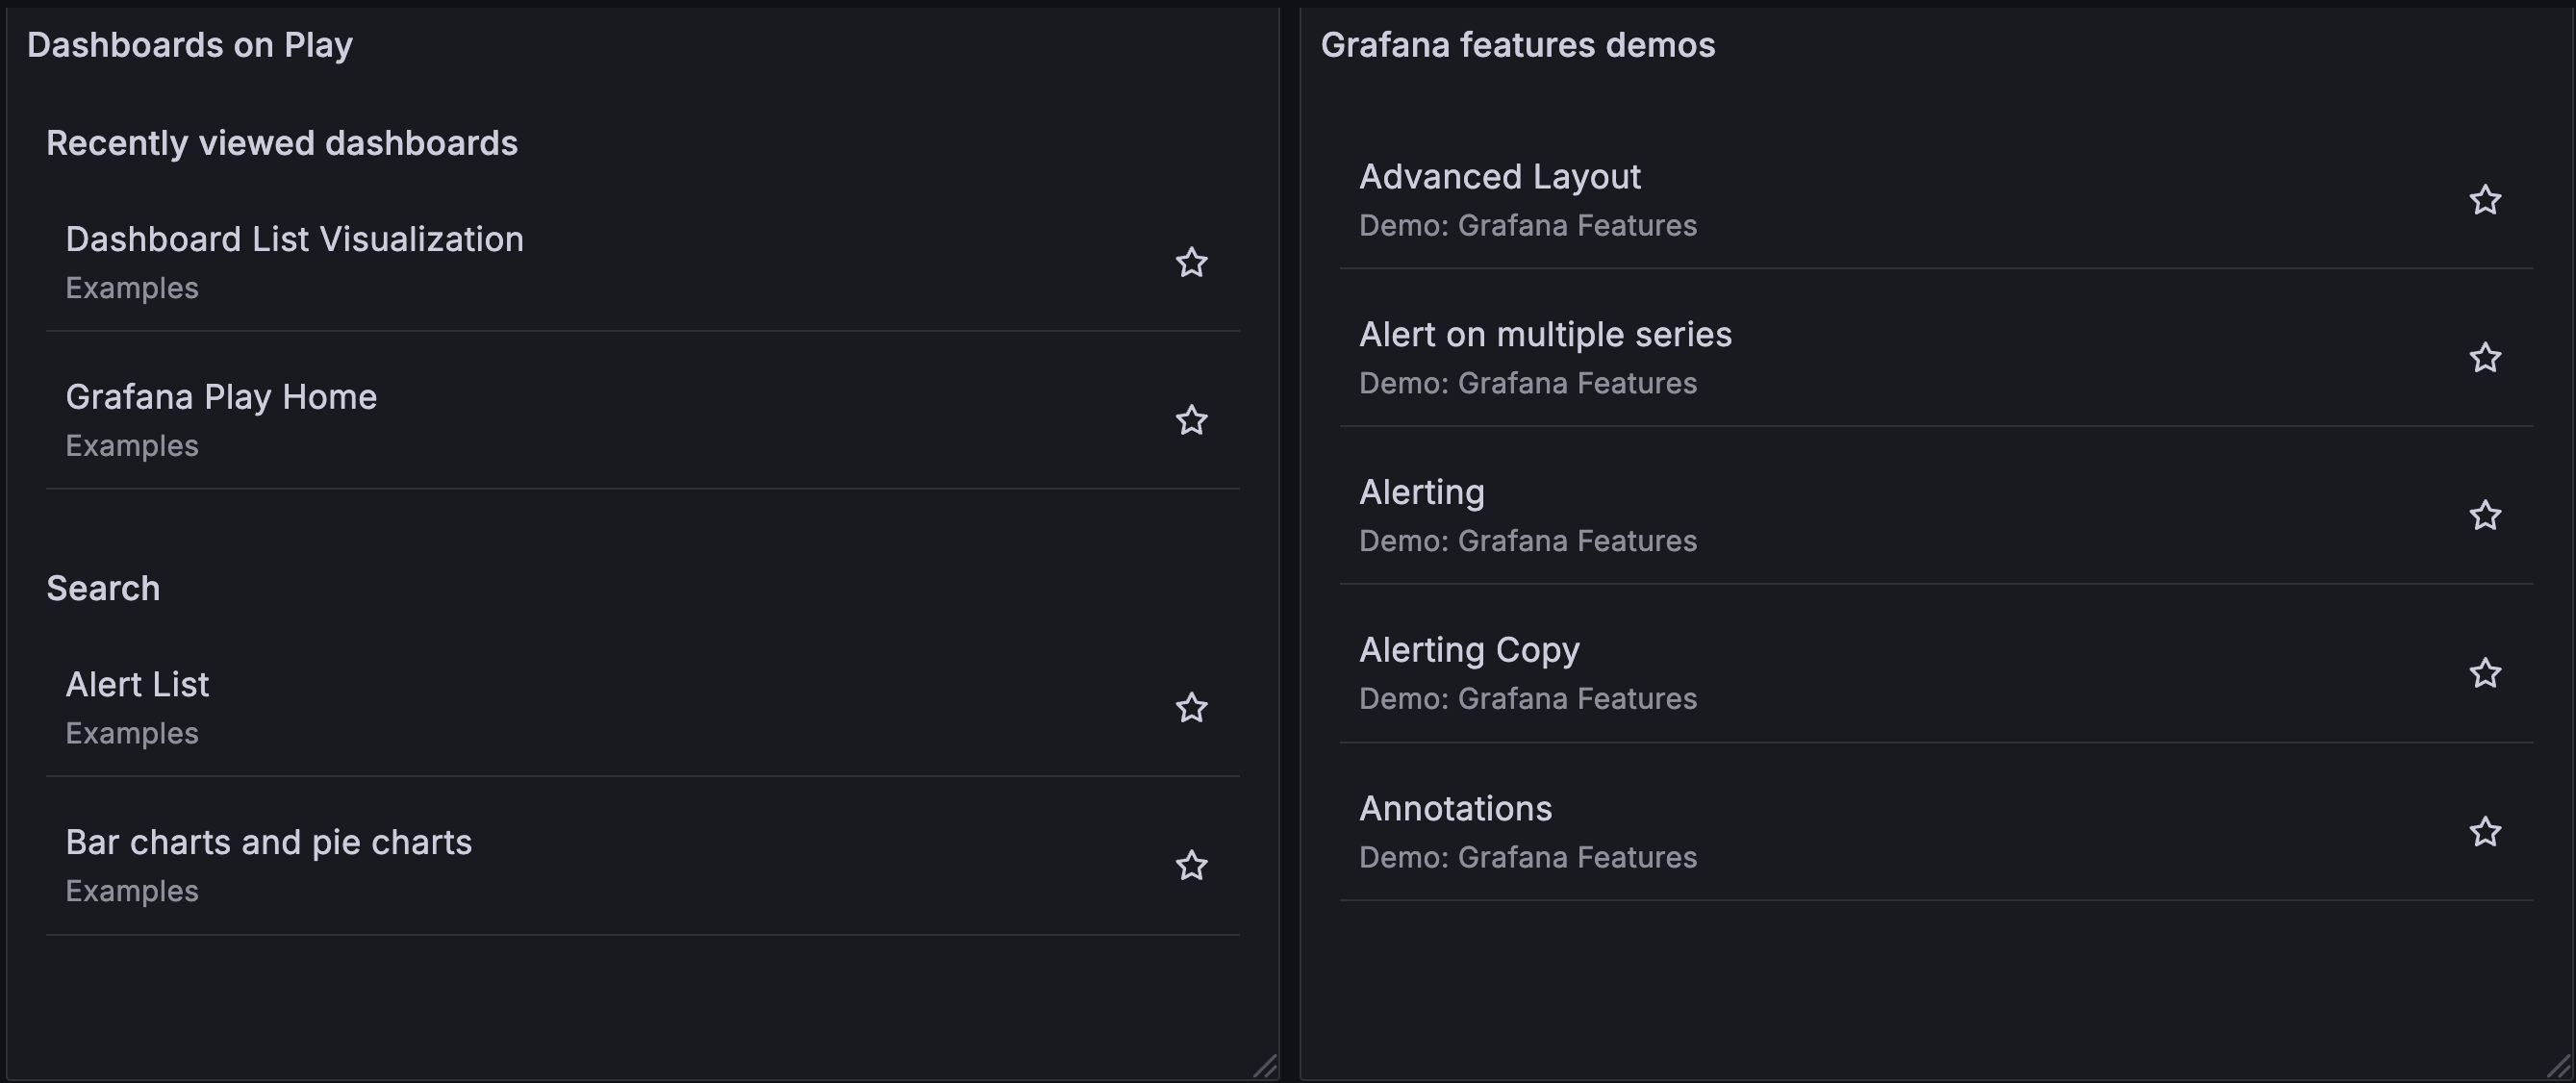
With Grafana Play, you can explore and see how it works, learning from practical examples to accelerate your development. This feature can be seen on Dashboard List Visualization.
Configuration options
The following section describes the configuration options available in the panel editor pane for this visualization. These options are, as much as possible, ordered as they appear in Grafana.
Panel options
In the Panel options section of the panel editor pane, set basic options like panel title and description, as well as panel links. To learn more, refer to Configure panel options.
Dashboard list options
Use the following options to refine your dashboard list visualization.
Query
Use this field to search by dashboard name. Query terms are case-insensitive and partial values are accepted. For example, if you have dashboards called “Indoor Temps” and “Outdoor temp”, entering the word “temp” returns both results. This option is only applied when the Search switch is toggled on.
Folder
Only dashboards from the selected folder are included in search results and displayed in the dashboard list. To include all dashboards in search results, select the top-level Dashboards folder. This option is only applied when the Search switch is toggled on.
Tags
Enter tags by which you want to search. Note that tags don’t appear as you type, and they’re case sensitive. When you specify multiple tags, dashboards must match all tags.
When multiple tags, query strings, and folders appear, the dashboard list displays dashboards matching all conditions.
This option is only applied when the Search switch is toggled on.


