Configure standard options
Standard options in the panel editor pane let you change how field data is displayed in your visualizations. Options that you apply don’t change the data, they just change how Grafana displays the data.
When you set a standard option, the change is applied to all fields or series. For example, if you set the Unit option to Percentage, all fields with numeric values are displayed as percentages.
For more granular control over the display of fields, refer to Configure overrides.
Supported visualizations
You can configure standard options for the following visualizations:
Standard options
This section explains all available standard options.
To set these options, expand the Standard options section in the panel editor pane. Most field options won’t affect the visualization until you click outside of the field option box you’re editing or press Enter.
Note
Not all of the options listed apply to all visualizations with standard options.
Unit
This option lets you choose which unit a field should use. Click in the Unit field, then drill down until you find the unit you want. The unit you select is applied to all fields except time.
Custom units
You can also use the Unit drop-down to specify custom units, custom prefixes or suffixes, and date time formats.
To set a custom unit, enter the unit you want to use and then select it in the drop-down. It’ll be the last option listed. For example, if you enter a unit called “Hearts”, the drop-down will then include the option Custom unit: Hearts.
You can further define a custom unit with specific syntax. For example, to set a custom currency unit called “Gems”, enter currency:Gems in the field. The drop-down will include the option Custom unit: currency:Gems:
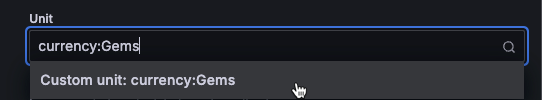
The following table lists the special syntax options for custom units:
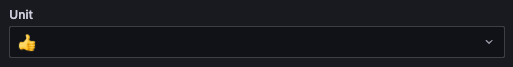
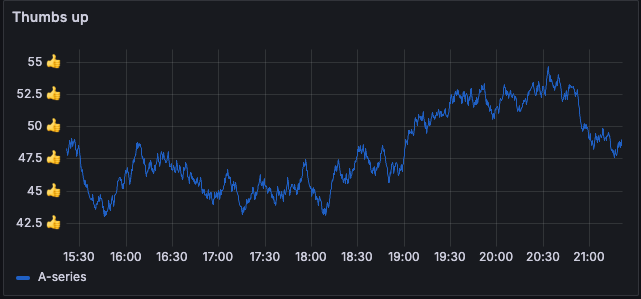
You can also paste a native emoji in the Unit drop-down and select it as a custom unit:
Time format units
All Date & time format units in Grafana (such as Datetime ISO or Datetime US) expect input values to be in milliseconds since the Unix epoch (January 1, 1970). If your data source provides timestamps in seconds, these will be incorrectly interpreted as dates very close to January 1, 1970.
To display timestamps that are in seconds since epoch, multiply your timestamp values by 1000 using a transformation following these steps:
- In the panel editor, click the Transformations tab.
- Click Add transformation.
- Select the Add field from calculation transformation.
- Set the following options:
- Mode - Binary operation
- Operation
- Select your timestamp field
- Select the asterisk (
*) for multiply by - Enter 1000 in the Field or Number field
- Toggle the Replace all fields switch on if you want to see the calculated field.
Control unit scaling
By default, Grafana automatically scales the unit based on the magnitude of the value. For example, if you have values of 0.14kW and 3000kW, Grafana displays them as 140W and 3MW, respectively. You can use custom units to control this behavior by setting a prefix, suffix, or custom SI unit.
String units
Sometimes Grafana is too aggressive in interpreting strings and displaying them as numbers. To configure Grafana to show the original string value, select Misc > String in the Unit drop-down.
Min
Set the minimum value used in percentage threshold calculations. Leave this field empty to automatically calculate the minimum.
Max
Set the maximum value used in percentage threshold calculations. Leave this field empty to automatically calculate the maximum.
Field min/max
By default, the calculated Min and Max are based on the minimum and maximum of all series and fields. When you enable Field min/max, Grafana calculates the min or max of each field individually, based on the minimum or maximum value of the field.
Decimals
Specify the number of decimals Grafana includes in the rendered value. If you leave this field empty, Grafana automatically truncates the number of decimals based on the value. For example 1.1234 displays as 1.12 and 100.456 displays as 100.
To display all decimals, set the unit to String.
Display name
Set the display title of all fields. You can use variables in the field title.
When multiple stats, fields, or series are displayed, this field controls the title in each stat. You can use expressions like ${__field.name} to use only the series name or the field name in the title.
The following table shows examples of the different field names generated using various expressions. In this example, there’s a field with a name of “Temp” and labels of {“Loc”=“PBI”, “Sensor”=“3”}:
If the value is an empty string after rendering the expression for a particular field, then the default display method is applied.
Color scheme
The Color scheme options let you set single or multiple colors for your entire visualization.
The color options and their effect on a visualization depend on the visualization you’re working with and some visualizations have different color options.
Select one of the following schemes:
You can also use the legend to open the color picker by clicking the legend series color icon. Setting color this way automatically creates an override rule that set’s a specific color for a specific series.
No value
Enter what Grafana should display if the field value is empty or null. The default value is a hyphen (-).


