Configure thresholds
In dashboards, a threshold is a value or limit you set for a metric that’s reflected visually when it’s met or exceeded. Thresholds are one way you can conditionally style and color your visualizations based on query results.
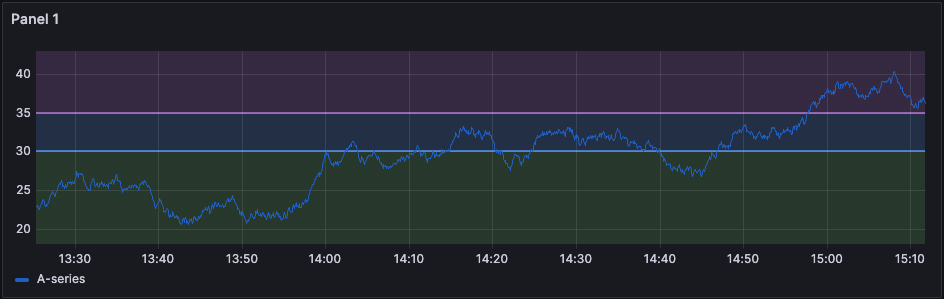
Using thresholds, you can color grid lines and regions in a time series visualization:
You can color the background or value text in a stat visualization:

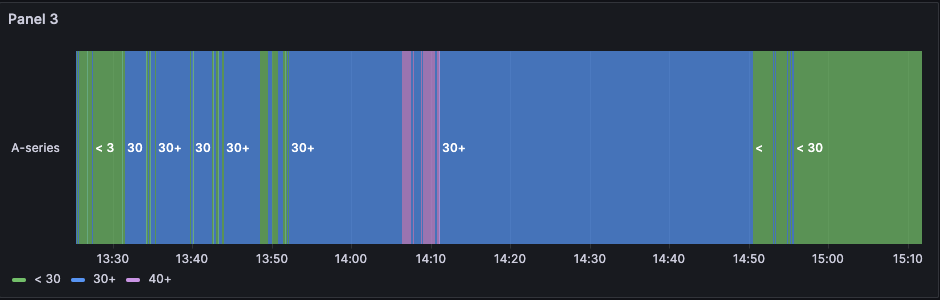
You can define regions and region colors in a state timeline:
You can also use thresholds to:
- Color lines in a time series visualization
- Color the gauge and threshold markers in a gauge
- Color markers in a geomap
- Color cell text or background in a table
With Grafana Play, you can explore and see how it works, learning from practical examples to accelerate your development. This feature can be seen on Threshold example.
Supported visualizations
You can set thresholds in the following visualizations:
Default thresholds
On visualizations that support thresholds, Grafana has the following default threshold settings:
- 80 = red
- Base = green
- Mode = Absolute
- Show thresholds = Off (for some visualizations); for more information, see the Show thresholds option.
Thresholds options
You can set the following options to further define how thresholds look.
Threshold value
This number is the value that triggers the threshold. You can also set the color associated with the threshold in this field.
The Base value represents minus infinity. By default, it’s set to the color green, which is generally the “good” color.
Thresholds mode
There are two threshold modes:
- Absolute thresholds are defined by a number. For example, 80 on a scale of 1 to 150.
- Percentage thresholds are defined relative to minimum or maximum. For example, 80 percent.
Show thresholds
Note
This option is supported for the bar chart, candlestick, time series, and trend visualizations.
Set if and how thresholds are shown with the following options.
| Option | Example |
|---|---|
| Off | |
| As lines | 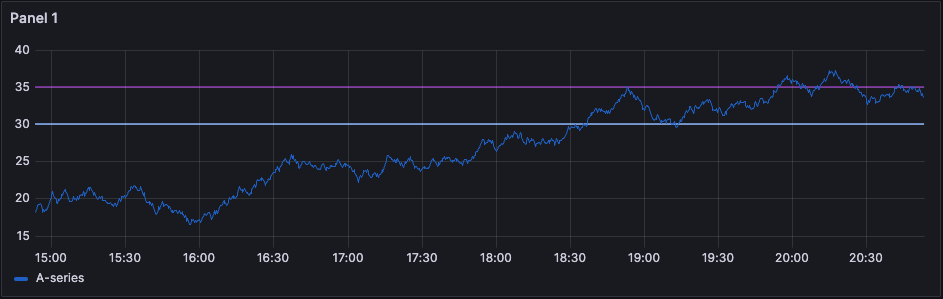 |
| As lines (dashed) | 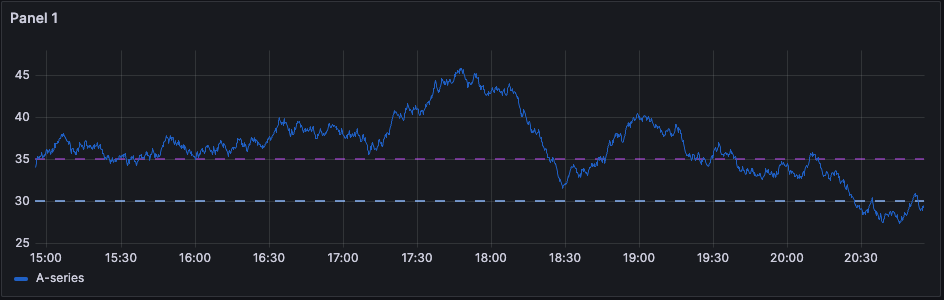 |
| As filled regions | 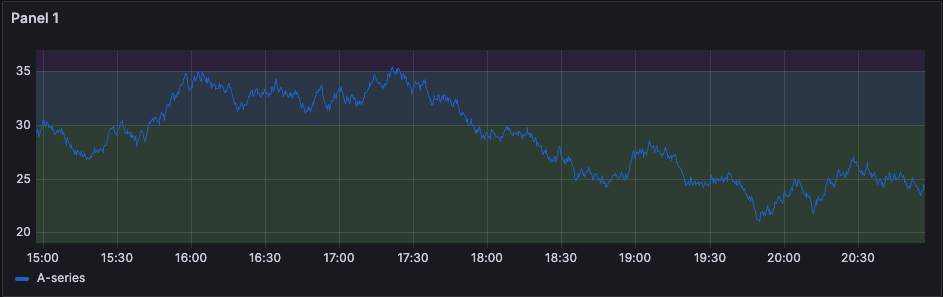 |
| As filled regions and lines | |
| As filled regions and lines (dashed) |  |
Add a threshold
You can add as many thresholds to a visualization as you want. Grafana automatically sorts thresholds values from highest to lowest.
- Navigate to the panel you want to update.
- Hover over any part of the panel you want to work on to display the menu on the top right corner.
- Click the menu and select Edit.
- Scroll to the Thresholds section or enter
thresholdsin the search bar at the top of the panel edit pane. - Click + Add threshold.
- Enter a new threshold value or use the up and down arrows at the right side of the field to increase or decrease the value incrementally.
- Click the colored circle to the left of the threshold value to open the color picker, where you can update the threshold color.
- Under Thresholds mode, select either Absolute or Percentage.
- Under Show thresholds, set how the threshold is displayed or turn it off.
- Click Save in the top-right corner.
- Enter an optional description of your changes and click Save.
- Click Back to dashboard and then Exit edit.
To delete a threshold, navigate to the panel that contains the threshold and click the trash icon next to the threshold you want to remove.


