Configure custom branding
Custom branding enables you to replace the Grafana Labs brand and logo with your corporate brand and logo.
Note
Available in Grafana Enterprise and Grafana Cloud paid accounts. Grafana Cloud Free plans support login title and footer link customization only. For Cloud users, click Open a Support Ticket from the Cloud Portal to create a ticket to configure custom branding.
The grafana.ini file includes Grafana Enterprise custom branding. As with all configuration options, you can use environment variables to set custom branding.
With custom branding, you can modify the following elements. Hover your cursor over a number to learn more about each element.
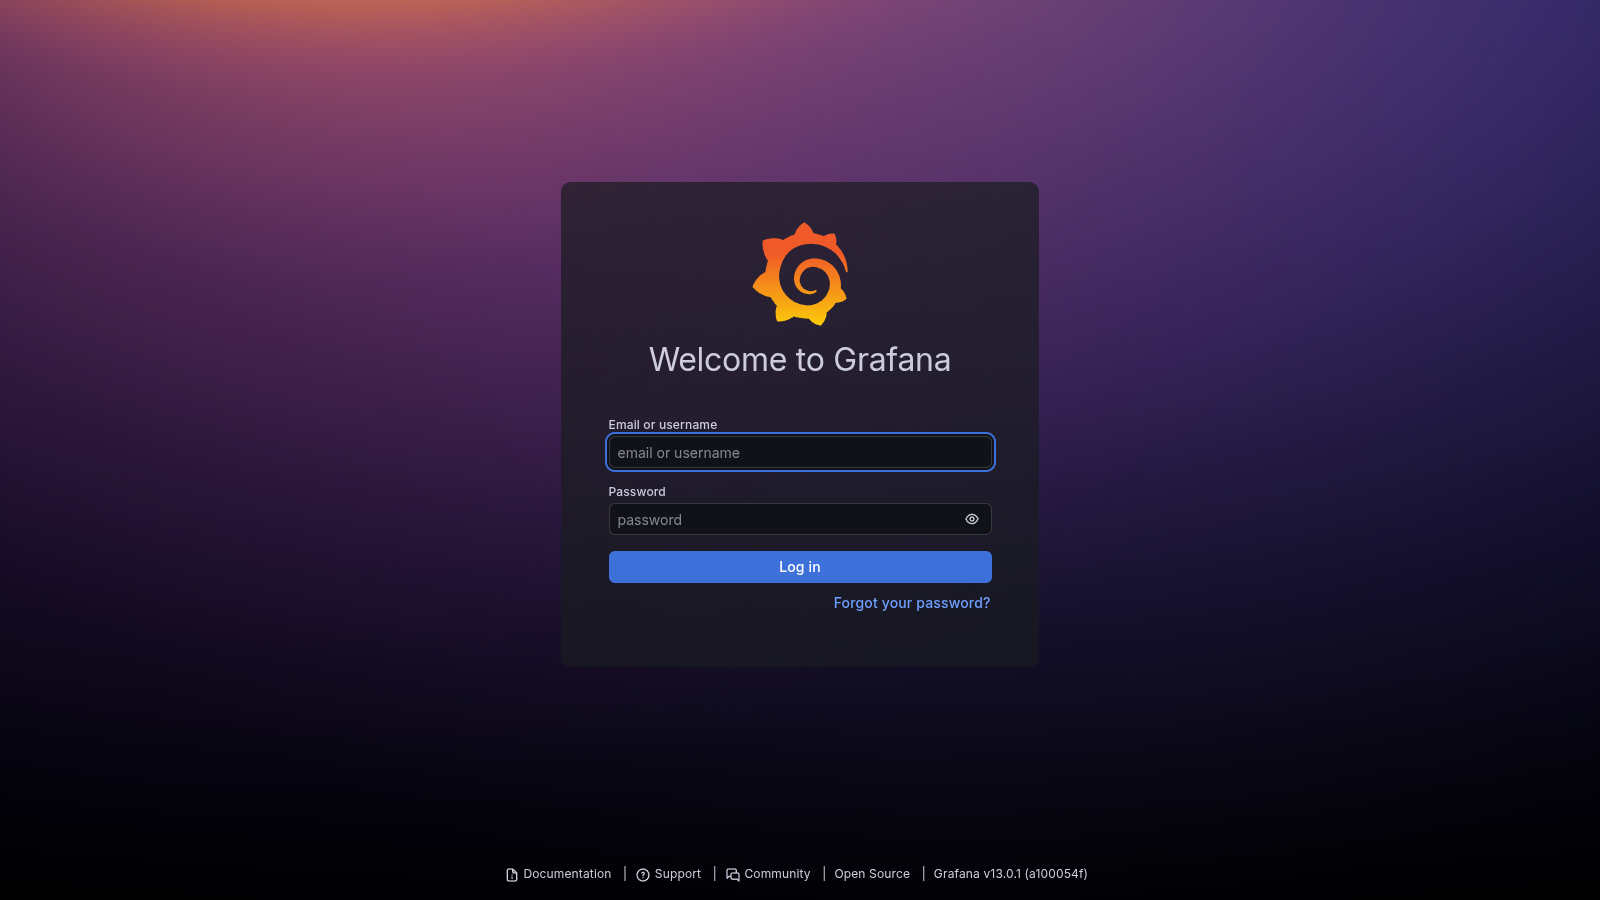
Login background (
login_background)The full-page background behind the login card. Accepts any valid CSS
backgroundvalue, includingurl()for images.Login box background (
login_box_background)The background of the login form card. Accepts any valid CSS
backgroundexpression.Login logo (
login_logo)The logo at the top of the login card. Grafana recommends SVG files, 48x48 pixels or smaller. When set, the login title and subtitle don’t appear.
Login title (
login_title)The main heading on the login page. Defaults to “Welcome to Grafana”. Doesn’t appear if a login logo is set.
Login subtitle (
login_subtitle)Secondary text below the login title. Empty by default. Doesn’t appear if a login logo is set.
Footer and help menu links (
footer_links)Links shown at the bottom of the login page. These same links also appear in the Help menu when logged in. By default: Documentation, Support, and Community.
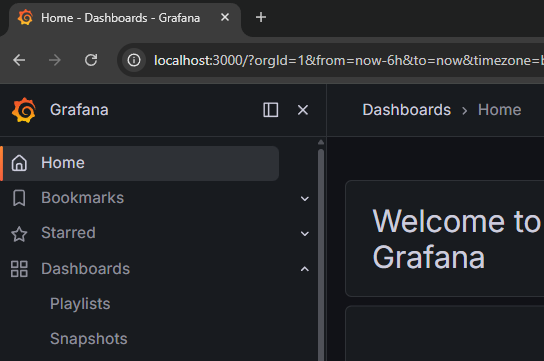
Fav icon (
fav_icon)The small icon in the browser tab. Defaults to the Grafana sunburst icon.
Application title (
app_title)The text appended to every page title in the browser tab. Defaults to “Grafana”. This setting controls the name in both the browser tab and the main menu header.
Side menu top logo (
menu_logo)The logo in the top-left corner of the application, also shown in the main menu header.
Application title (
app_title)The application name in the main menu header, next to the side menu logo. This setting controls the name in both the main menu header and the browser tab.
You can also customize the loading logo (loading_logo), which appears during the initial page load splash screen.
You will have to host your logo and other images used by the custom branding feature separately. Make sure Grafana can access the URL where the assets are stored.
The configuration file in Grafana Enterprise contains the following options. For more information about configuring Grafana, refer to Configure Grafana.
# Enterprise only
[white_labeling]
# Set to your company name to override application title
;app_title =

# Set to main title on the login page (Will not appear if a login logo is set)
;login_title =

# Set to login subtitle (Will not appear if a login logo is set)
;login_subtitle =

# Set to complete URL to override login logo
;login_logo =

# Set to complete CSS background expression to override login background
# example: login_background = url(http://www.bhmpics.com/wallpapers/starfield-1920x1080.jpg)
;login_background =

# Set to complete CSS background expression to override login box background
;login_box_background =

# Set to complete URL to override menu logo
;menu_logo =

# Set to complete URL to override fav icon (icon shown in browser tab)
;fav_icon =

# Set to complete URL to override apple/ios icon
;apple_touch_icon =

# Set to complete URL to override loading logo
;loading_logo =

# Set to `true` to remove the Grafana edition from appearing in the footer
;hide_edition =
Note
For the
login_logooption, Grafana recommends using SVG files that are 48 pixels by 48 pixels or smaller. You also don’t need to use theurl()function forlogin_logo.Additionally, you can copy images to the local Grafana image directory,
/usr/share/grafana/public/img/, and setlogin_logoto the stored image. For example:login_logo = /public/img/<YOUR_LOGO.svg>
You have the option of adding custom links in place of the default footer links (Documentation, Support, Community). Below is an example of how to replace the default footer and help links with custom links.
footer_links = support guides extracustom
footer_links_support_text = Support
footer_links_support_url = http://your.support.site
footer_links_guides_text = Guides
footer_links_guides_url = http://your.guides.site
footer_links_extracustom_text = Custom text
footer_links_extracustom_url = http://your.custom.site
The following example shows configuring custom branding using environment variables instead of the custom.ini or grafana.ini files.
GF_WHITE_LABELING_FOOTER_LINKS=support guides extracustom
GF_WHITE_LABELING_FOOTER_LINKS_SUPPORT_TEXT=Support
GF_WHITE_LABELING_FOOTER_LINKS_SUPPORT_URL=http://your.support.site
GF_WHITE_LABELING_FOOTER_LINKS_GUIDES_TEXT=Guides
GF_WHITE_LABELING_FOOTER_LINKS_GUIDES_URL=http://your.guides.site
GF_WHITE_LABELING_FOOTER_LINKS_EXTRACUSTOM_TEXT=Custom Text
GF_WHITE_LABELING_FOOTER_LINKS_EXTRACUSTOM_URL=http://your.custom.site
Note
The following two links are always present in the footer:
- Grafana edition
- Grafana version with build number
If you specify footer_links or GF_WHITE_LABELING_FOOTER_LINKS, then all other default links are removed from the footer, and only what is specified is included.
Custom branding for shared dashboards
In addition to the customizations described below, you can customize the footer of your shared dashboards.
To customize the footer of a shared dashboard, add the following section to the grafana.ini file.
[white_labeling.public_dashboards]

# Hides the footer for the shared dashboards if set to `true`.
# example: footer_hide = "true"
;footer_hide =

# Set to text shown in the footer
;footer_text =

# Set to complete url to override shared dashboard footer logo. Default is `grafana-logo` and will display the Grafana logo.
# An empty value will hide the footer logo.
;footer_logo =

# Set to link for the footer
;footer_link =

# Set to `true` to hide the Grafana logo next to the title
;header_logo_hide =
If you specify footer_hide to true, all the other values are ignored because the footer will not be shown.


