
Google Cloud Monitoring query editor
This topic explains querying specific to the Google Cloud Monitoring data source. For general documentation on querying data sources in Grafana, see Query and transform data.
Choose a query editing mode
The Google Cloud Monitoring query editor helps you build queries for two types of data, which both return time series data:
You can also create Monitoring Query Language (MQL) queries.
You also use the query editor when you annotate visualizations.
Query metrics

The metrics query editor helps you select metrics, group and aggregate by labels and time, and use filters to specify which time series you want to query.
Create a metrics query
- Select the Metrics option in the Query Type dropdown.
- Select a project from the Project dropdown.
- Select a Google Cloud Platform service from the Service dropdown.
- Select a metric from the Metric dropdown.
- (Optional) Use the plus and minus icons in the filter and group-by sections to add and remove filters or group-by clauses.
Google Cloud Monitoring supports several metrics types, such as GAUGE, DELTA, and CUMULATIVE.
Each supports different aggregation options, such as reducers and aligners.
The metrics query editor lists available aggregation methods for a selected metric, and sets a default reducer and aligner when you select a metric.
Apply a filter
To add and apply a filter:
- Click the plus icon in the filter section.
- Select a field to filter by.
- Enter a filter value, such as
instance_name = grafana-1.
To remove the filter, click the trash icon.
Use simple wildcards
When you set the operator to = or !=, you can add wildcards to the filter value field.
For example, entering us-* captures all values that start with “us-”, and entering *central-a captures all values that end with “central-a”.
*-central-* captures all values with the substring of “-central-”.
Simple wildcards perform better than regular expressions.
Use regular expressions
When you set the operator to =~ or !=~, you can add regular expressions to the filter value field.
For example, entering us-central[1-3]-[af] matches all values that start with “us-central”, then are followed by a number in the range of 1 to 3, a dash, and then either an “a” or an “f”.
You don’t need leading and trailing slashes when you create these regular expressions.
Configure pre-processing options
The query editor displays pre-processing options when the selected metric has a metric type of DELTA or CUMULATIVE.
- The Rate option aligns and converts data points to a rate per time series.
- The Delta option aligns data points by their delta (difference) per time series.
Group time series
To combine multiple time series and reduce the amount of data returned for a metric, specify a grouping and a function.
Group by
Use the Group By segment to group resource or metric labels, which reduces the number of time series and aggregates the results by group.
For example, if you group by instance_name, Grafana displays an aggregated metric for the specified Compute instance.
Metadata labels
Resource metadata labels contain information that can uniquely identify a resource in Google Cloud. A time series response returns metadata labels only if they’re part of the Group By segment in the time series request.
There’s no API for retrieving metadata labels, so you can’t populate the Group By list with the metadata labels that are available for the selected service and metric. However, the Group By field list comes with a pre-defined set of common system labels.
You can’t pre-define user labels, but you can enter them manually in the Group By field. If you include a metadata label, user label, or system label in the Group By segment, you can create filters based on it and expand its value on the Alias field.
Group by function
To combine the time series in the group into a single time series, select a grouping function.
Align data
You can align all data points received in a fixed length of time by applying an alignment function to combine those data points, and then assigning a timestamp to the result.
Select an alignment function
During alignment, all data points are received in a fixed interval. Within each interval, as defined by the alignment period), and for each time series, the data is aggregated into a single point. The value of that point is determined by the type of alignment function you use.
For more information on alignment functions, refer to alignment metric selector.
Define the alignment period
You can set the Alignment Period field to group a metric by time if you’ve chosen an aggregation.
The default, called “cloud monitoring auto”, uses GCP Google Cloud Monitoring’s default groupings. These enable you to compare graphs in Grafana with graphs in the Google Cloud Monitoring UI.
The default values for “cloud monitoring auto” are:
- 1m for time ranges < 23 hours
- 5m for time ranges >= 23 hours and < 6 days
- 1h for time ranges >= 6 days
The other automatic option is “grafana auto”, which automatically sets the Group By time depending on the time range chosen and width of the time series panel.
For more information about “grafana auto”, refer to Interval variable.
You can also choose fixed time intervals to group by, like 1h or 1d.
Set alias patterns
The Alias By helps you control the format of legend keys. By default, Grafana shows the metric name and labels, which can be long and difficult to read.
You can use patterns in the alias field to customize the legend key’s format:
| Alias pattern | Description | Alias pattern example | Example result |
|---|---|---|---|
{{metric.label.xxx}} | Returns the metric label value. | {{metric.label.instance_name}} | grafana-1-prod |
{{metric.type}} | Returns the full Metric Type. | {{metric.type}} | compute.googleapis.com/instance/cpu/utilization |
{{metric.name}} | Returns the metric name part. | {{metric.name}} | instance/cpu/utilization |
{{metric.service}} | Returns the service part. | {{metric.service}} | compute |
{{resource.label.xxx}} | Returns the resource label value. | {{resource.label.zone}} | us-east1-b |
{{resource.type}} | Returns the name of the monitored resource type. | {{resource.type}} | gce_instance |
{{metadata.system_labels.xxx}} | Returns the metadata system label value. | {{metadata.system_labels.name}} | grafana |
{{metadata.user_labels.xxx}} | Returns the metadata user label value. | {{metadata.user_labels.tag}} | production |
Alias pattern examples
Using metric labels:
You can select from a list of metric and resource labels for a metric in the Group By dropdown. You can then include them in the legend key using alias patterns.
For example, given this value of Alias By: {{metric.type}} - {{metric.label.instance_name}}
An expected result would look like: compute.googleapis.com/instance/cpu/usage_time - server1-prod
Using the Monitored Resource Type:
You can also resolve the name of the Monitored Resource Type with the resource.type alias.
For example, given this value of Alias By: {{resource.type}} - {{metric.type}}
An expected result would look like: gce_instance - compute.googleapis.com/instance/cpu/usage_time
Deep-link from Grafana panels to the Google Cloud Console Metrics Explorer
Note
Available in Grafana v7.1 and higher.

You can click on a time series in the panel to access a context menu, which contains a link to View in Metrics Explorer in Google Cloud Console. The link points to the Google Cloud Console’s Metrics Explorer and runs the Grafana panel’s query there.
If you select the link, you first select an account in the Google Account Chooser. Google then redirects you to the Metrics Explorer.
The provided link is valid for any account, but displays the query only if your account has access to the query’s specified GCP project.
Understand automatic unit detection
Grafana issues one query to the Cloud Monitoring API per query editor row, and each API response includes a unit. Grafana attempts to convert the returned unit into a unit compatible with its time series panel.
If successful, Grafana displays the unit on the panel’s Y-axis. If the query editor rows return different units, Grafana uses the unit from the last query editor row in the time series panel.
Use the Monitoring Query Language
Note
Available in Grafana v7.4 and higher.
The Monitoring Query Language (MQL) query builder helps you query and display MQL results in time series format. To understand basic MQL concepts, refer to Introduction to Monitoring Query Language.
Create an MQL query
To create an MQL query:
- Select the Metrics option in the Query Type dropdown.
- Select a project from the Project dropdown.
- Enter your MQL query in the text area.
Set alias patterns for MQL queries
MQL queries use the same alias patterns as metric queries.
However, {{metric.service}} is not supported, and {{metric.type}} and {{metric.name}} show the time series key in the response.
Query Service Level Objectives
Note
Available in Grafana v7.0 and higher.
 query editor")
The SLO query builder helps you visualize SLO data in time series format. To understand basic concepts in service monitoring, refer to the Google Cloud Monitoring documentation.
Create an SLO query
To create an SLO query:
- Select the Service Level Objectives (SLO) option in the Query Type dropdown.
- Select a project from the Project dropdown.
- Select an SLO service from the Service dropdown.
- Select an SLO from the SLO dropdown.
- Select a time series selector from the Selector dropdown.
Grafana’s time series selectors use descriptive names that map to system names that Google uses in the Service Monitoring documentation:
| Selector dropdown value | Corresponding time series selector |
|---|---|
| SLI Value | select_slo_health |
| SLO Compliance | select_slo_compliance |
| SLO Error Budget Remaining | select_slo_budget_fraction |
| SLO Burn Rate | select_slo_burn_rate |
Alias patterns for SLO queries
The Alias By field helps you control the format of legend keys for SLO queries.
| Alias pattern | Description | Example result |
|---|---|---|
{{project}} | Returns the GCP project name. | myProject |
{{service}} | Returns the service name. | myService |
{{slo}} | Returns the SLO. | latency-slo |
{{selector}} | Returns the selector. | select_slo_health |
Alignment period and group-by time for SLO queries
SLO queries use the same alignment period functionality as metric queries.
Create a Prometheus query
To create an Prometheus query:
- Select the PromQL option in the Query Type dropdown.
- Select a project from the Project dropdown.
- Enter your Prometheus query in the text area.
- Enter a Min Step interval. The Min step setting defines the lower bounds on the interval between data points. For example, set this to
1hto hint that measurements are taken hourly. This setting supports the$__intervaland$__rate_intervalmacros.
Apply annotations
Annotations overlay rich event information on top of graphs. You can add annotation queries in the Dashboard menu’s Annotations view.
Rendering annotations is expensive, and it’s important to limit the number of rows returned. There’s no support for displaying Google Cloud Monitoring’s annotations and events, but it works well with custom metrics in Google Cloud Monitoring.
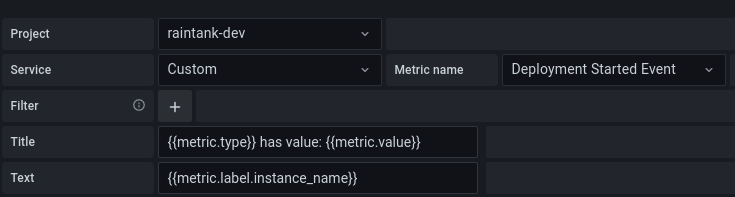
With the query editor for annotations, you can select a metric and filters.
The Title and Text fields support templating and can use data returned from the query.
For example, the Title field could have the following text:
{{metric.type}} has value: {{metric.value}}
Example result: monitoring.googleapis.com/uptime_check/http_status has this value: 502
Patterns for the annotation query editor
| Alias pattern format | Description | Alias pattern example | Example result |
|---|---|---|---|
{{metric.value}} | Value of the metric/point. | {{metric.value}} | 555 |
{{metric.type}} | Returns the full Metric Type. | {{metric.type}} | compute.googleapis.com/instance/cpu/utilization |
{{metric.name}} | Returns the metric name part. | {{metric.name}} | instance/cpu/utilization |
{{metric.service}} | Returns the service part. | {{metric.service}} | compute |
{{metric.label.xxx}} | Returns the metric label value. | {{metric.label.instance_name}} | grafana-1-prod |
{{resource.label.xxx}} | Returns the resource label value. | {{resource.label.zone}} | us-east1-b |
Was this page helpful?
Related resources from Grafana Labs


