

Alerting on forecasts
A forecast predicts the future state of a signal, such as expected disk space utilization over the next month. Common forecast use cases include:
- Capacity planning: Detect when resources such as disk space, memory, CPU, or database connections are expected to approach their limits.
- Demand and business planning: Analyze expected demand, costs, production, or other business metrics.
Standard alert rules evaluate the current state of a signal. A forecast-based alert compares a predicted future value with a threshold condition, allowing you to act before this happens.
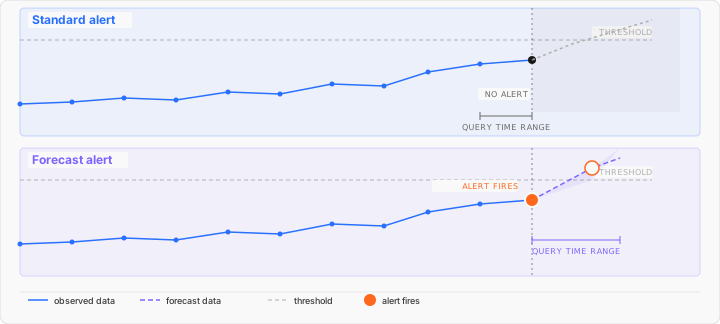
Different forecasting tools provide different forecasting approaches, which are often chosen based on the behavior of the signal.
- Linear forecasts are used for signals that follow a relatively steady trend.
- Seasonal forecasts are better suited to signals with recurring patterns, such as daily or weekly traffic.
The following examples show how to create alerts using both types of forecasts.
Linear forecast with predict_linear
When a signal follows a relatively steady trend, you can use the PromQL predict_linear function to predict its future value.
predict_linear performs a linear regression over the values in a range vector and extrapolates the resulting trend into the future. The function takes two arguments:
predict_linear(<range-vector>, <seconds>)<range-vector>provides the historical data used to calculate the trend.<seconds>specifies how far into the future to predict, in seconds.
For example:
predict_linear(<metric>[14d], 7 * 24 * 3600)This uses the last 14 days of data to calculate a linear trend and predicts the value 7 days from the current evaluation time.
How predict_linear works
The calculation is based on a simple linear regression. It calculates the slope from the historical data and extrapolates that slope into the future:
predicted_value = value_at_evaluation_time + slope * timeThe result is a single predicted value at the requested future time, rather than a forecast series covering the entire future period.
When to use predict_linear
predict_linear is useful when a signal follows a relatively steady trend, such as disk utilization that is consistently increasing.
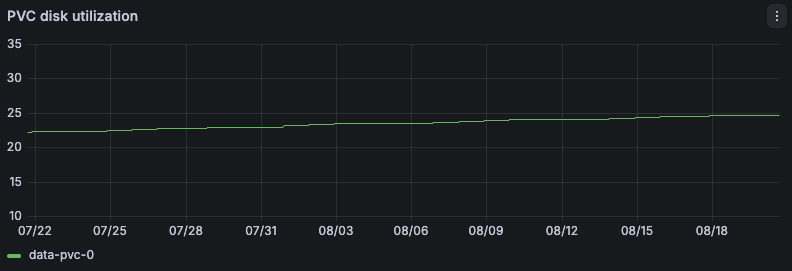
It is not suitable for signals with strong recurring patterns. For example, if a signal follows daily or weekly cycles, a straight-line projection might produce values that do not reflect the signal’s normal behavior.
Another consideration is that predict_linear assumes the current trend continues. A sudden signal change can make the extrapolated trend inaccurate and lead to an inaccurate prediction.
Alert on a future predicted value
You can compare the predicted value with a threshold directly in an alert rule:
predict_linear(<metric>[14d], 7 * 24 * 3600) > 85This evaluates whether the predicted value seven days from now exceeds 85.
The following example uses predict_linear to forecast disk utilization for a PostgreSQL persistent volume claim:
predict_linear(
  max by (persistentvolumeclaim) (
    100 * (
      1 - kubelet_volume_stats_available_bytes{persistentvolumeclaim="<id>"}
      /
      kubelet_volume_stats_capacity_bytes{persistentvolumeclaim="<id>"}
    )
  )[14d:1h],
  7 * 24 * 3600
)
The query works as follows:
- It calculates the disk utilization percentage for the volume.
predict_linearuses the previous14days of disk utilization to predict the value7days into the future.- The subquery
[14d:1h]evaluates the historical data at1-hour intervals. This resolution is sufficient for a forecast over a long period. - The alert rule uses a threshold condition that fires when the predicted utilization exceeds
85%. - The alert rule evaluates every
12hours because disk utilization changes relatively slowly.
Tip
You can explore this alert example in Grafana Play.
Alert description: The PVC is forecast to reach more than 85% used capacity within the next 7 days based on the last 14 days of usage. Review disk growth and plan capacity expansion before the volume reaches the threshold.
Seasonal forecast with Grafana Cloud Machine Learning
When a signal follows recurring patterns, such as daily or weekly traffic cycles, a linear forecast cannot accurately represent its future behavior.
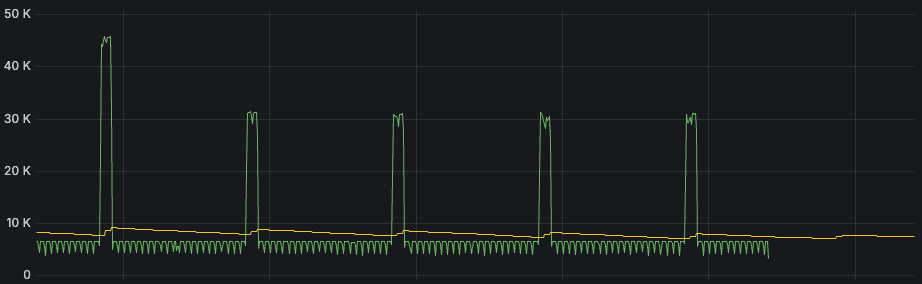
In these cases, you can use Grafana Machine Learning forecasting to generate a forecast that accounts for trends and seasonality.
Unlike predict_linear, which returns a single predicted value at a specific point in the future, a Grafana Machine Learning forecast produces a series of predicted values over the forecast period. It also provides upper and lower bounds that represent the uncertainty of the prediction.
Each forecast produces these Prometheus metrics:
<forecast_metric_name>:predicted{ml_forecast="yhat"}: The predicted value, shown as the blue line.<forecast_metric_name>:predicted{ml_forecast="yhat_upper"}: The upper bound of the prediction interval, shown as the upper edge of the blue band.<forecast_metric_name>:predicted{ml_forecast="yhat_lower"}: The lower bound of the prediction interval, shown as the lower edge of the blue band.<forecast_metric_name>:actual: The current value of the signal, shown as the green line.
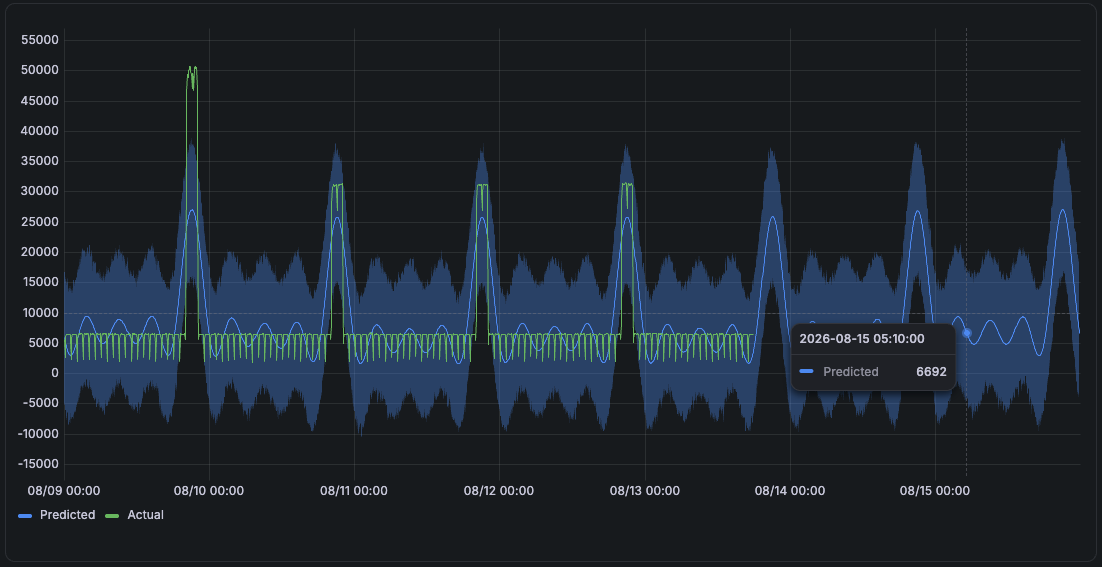
Because the forecast is stored in the grafanacloud-ml-metrics Prometheus data source, you can use the forecast metrics directly in alert rules to detect:
- When the forecast is expected to breach a threshold at any point in the future.
- When the current signal deviates from the expected forecast range.
Alert on a future prediction
Like the predict_linear example, a forecast alert can detect whether a signal is expected to exceed a threshold within a future time window.
In this example, the alert query uses the upper forecast bound (yhat_upper) rather than the central prediction. This accounts for prediction uncertainty and provides a more conservative capacity-planning signal.
<forecast_metric_name>:predicted{ml_forecast="yhat_upper"} over the next 7 days > 80%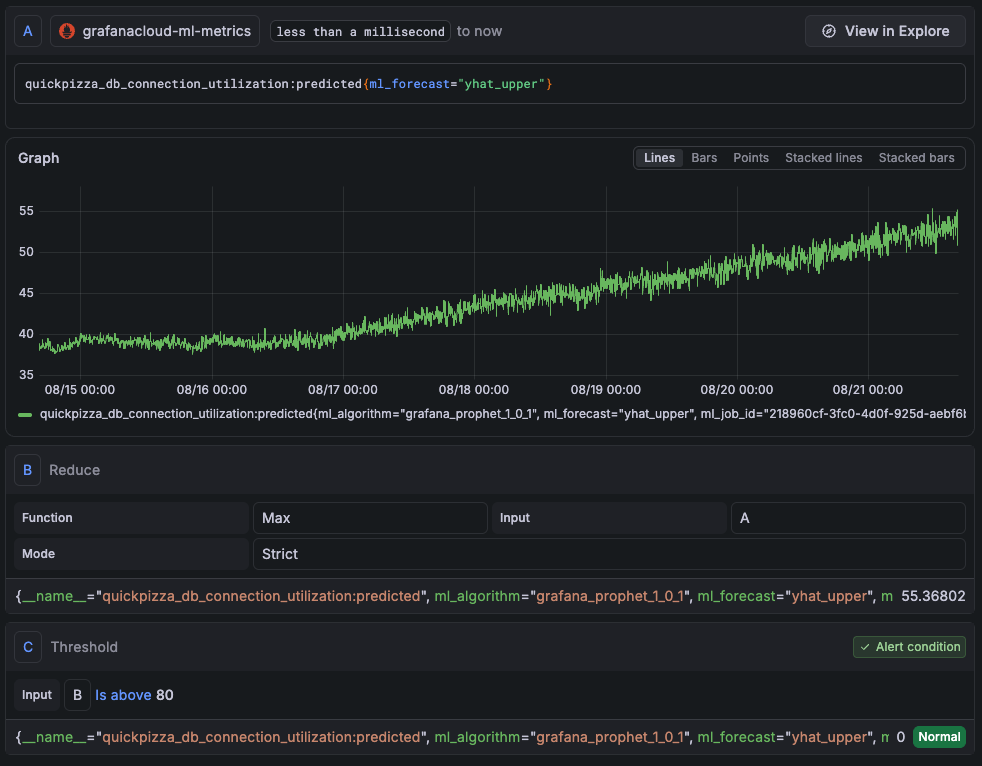
In this example, the forecast provides up to 15 days of future prediction data. The maximum function value is used so that the alert fires if the forecast is expected to exceed the threshold at any point during the next 7 days.
Tip
You can explore this alert example in Grafana Play.
Alert when the actual state is outside the forecast
A forecast-based alert can also detect when the current signal deviates from the prediction.
In the previous examples, forecast alerts detect potential future situations: they alert when a signal is expected to exceed a threshold at some point in the future. The key differences in this case are:
- The alert does not look for a future threshold breach. Instead, it compares the current value with the forecast range and alerts when the actual value falls outside the forecast range.
- The forecast acts as an adaptive baseline. While a standard alert rule evaluates the signal against a fixed threshold, a forecast-based alert rule evaluates the signal against the forecast, which can change over time based on seasonal patterns.
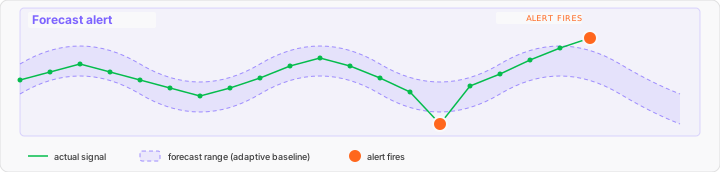
For alerting, each forecast produces an anomalous metric (<forecast_metric_name>:anomalous) that returns 0 when the actual value is within the prediction interval. You can use this metric directly in a forecast alert:
# Fires when the actual value is outside the prediction interval
<forecast_metric_name>:anomalous
Alert only on unexpectedly high values
You can also configure an alert to fire only when the actual value exceeds the predicted upper bound.
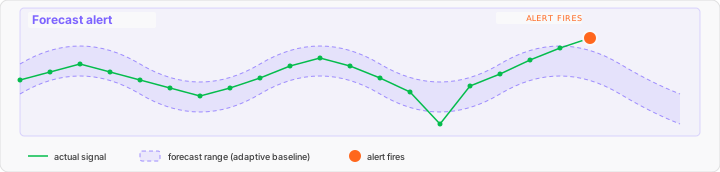
In this case, the alert rule can also query <forecast_metric_name>:anomalous, which returns 1 when the actual value is above the upper bound and -1 when it is below the lower bound:
<forecast_metric_name>:anomalous == 1Alternatively, you can compare the actual value directly with the predicted upper bound:
<forecast_metric_name>:actual >
ignoring (ml_forecast) <forecast_metric_name>:predicted{ml_forecast="yhat_upper"}
Tip
You can explore a similar alert example in Grafana Play.
Note
Adaptive alerts are useful when a signal varies over time and a fixed threshold would miss meaningful deviations or generate alerts during normal changes in behavior.
For example, the traffic might be higher during business hours and lower overnight. Comparing the current value with the forecast range adapts to these recurring patterns.
Learn more
For more information about forecasting and alerting with Grafana Cloud Machine Learning, refer to:
Was this page helpful?
Related resources from Grafana Labs



