Alert rules
An alert rule is a set of evaluation criteria for when an alert rule should fire. An alert rule consists of:
- Queries and expressions that select the data set to evaluate.
- A condition (the threshold) that the query must meet or exceed to trigger the alert instance.
- An interval that specifies the frequency of alert rule evaluation and a duration indicating how long the condition must be met to trigger the alert instance.
- Other customizable options, for example, setting what should happen in the absence of data, notification messages, and more.
Grafana supports two different alert rule types: Grafana-managed alert rules and data source-managed alert rules.
Grafana-managed alert rules
Grafana-managed alert rules are the most flexible alert rule type. They allow you to create alerts that can act on data from any of the supported data sources, and use multiple data sources in a single alert rule.
Additionally, you can also add expressions to transform your data, set custom alert conditions, and include images in alert notifications.

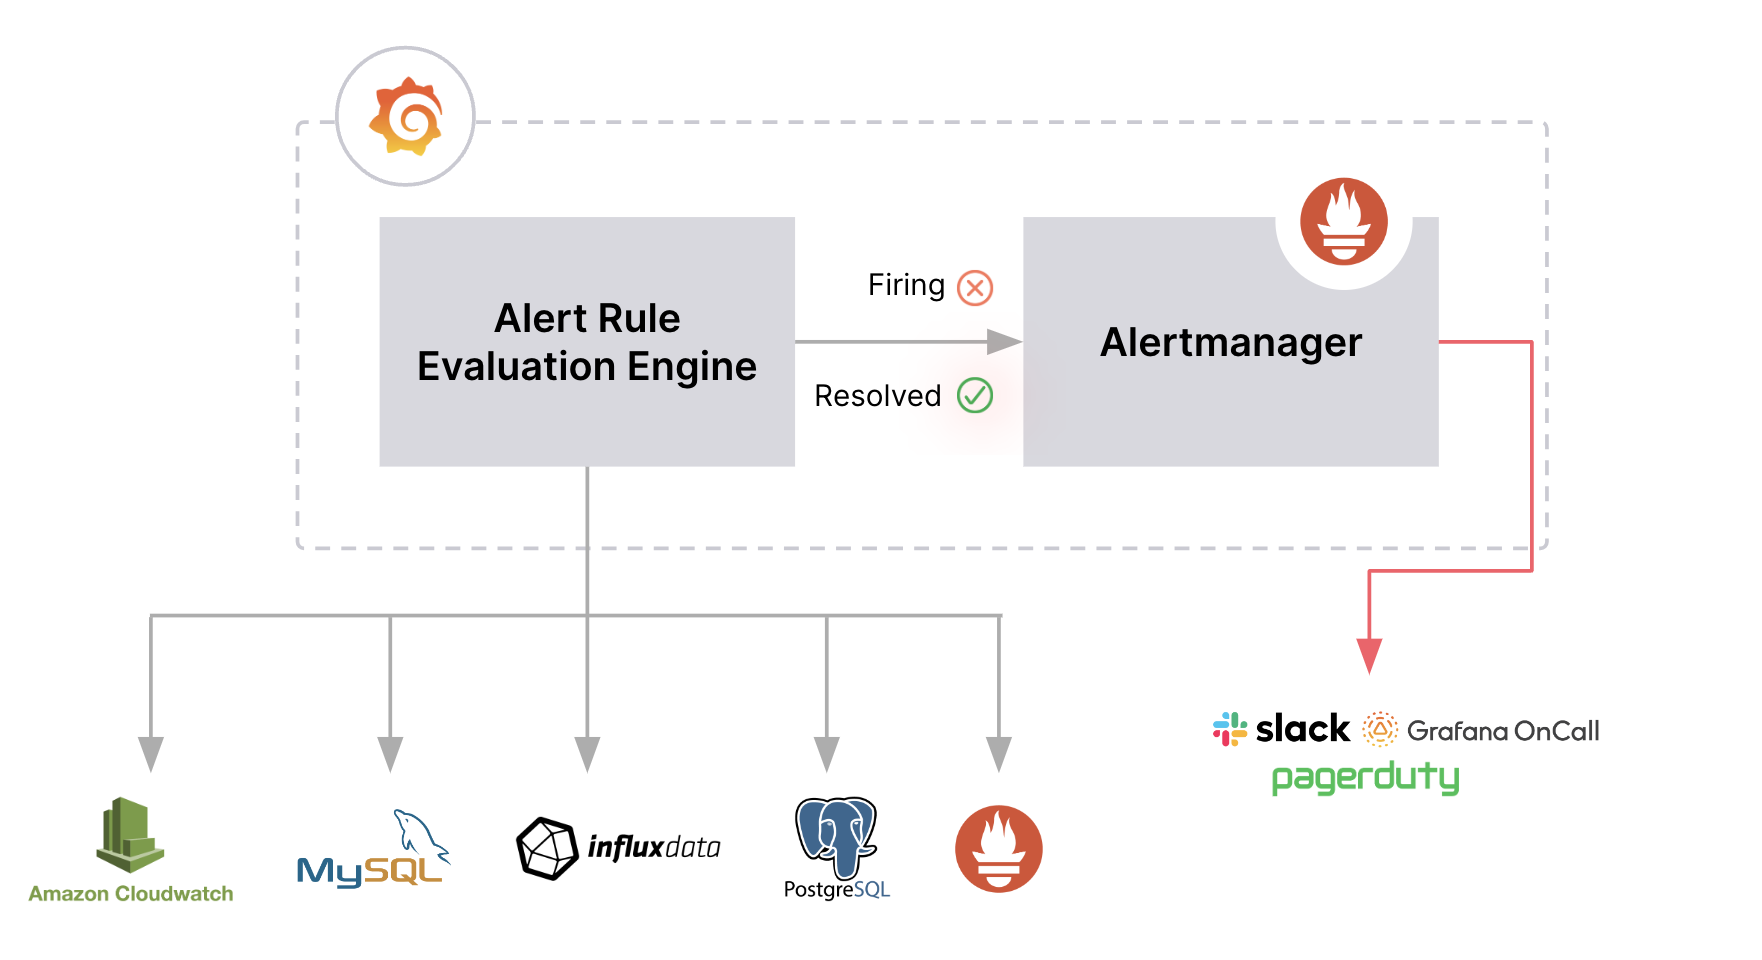
- Alert rules are created within Grafana based on one or more data sources.
- Alert rules are evaluated by the Alert Rule Evaluation Engine from within Grafana.
- Firing and resolved alert instances are forwarded to handle their notifications.
Supported data sources
Grafana-managed alert rules can query backend data sources if Grafana Alerting is enabled by specifying {"backend": true, "alerting": true} in the plugin.json.
Find the public data sources supporting Alerting in the Grafana Plugins directory.
Data source-managed alert rules
Data source-managed alert rules can improve query performance via recording rules and ensure high-availability and fault tolerance when implementing a distributed architecture.
They are only supported for Prometheus-based or Loki data sources with the Ruler API enabled. For more information, refer to the Loki Ruler API or Mimir Ruler API.

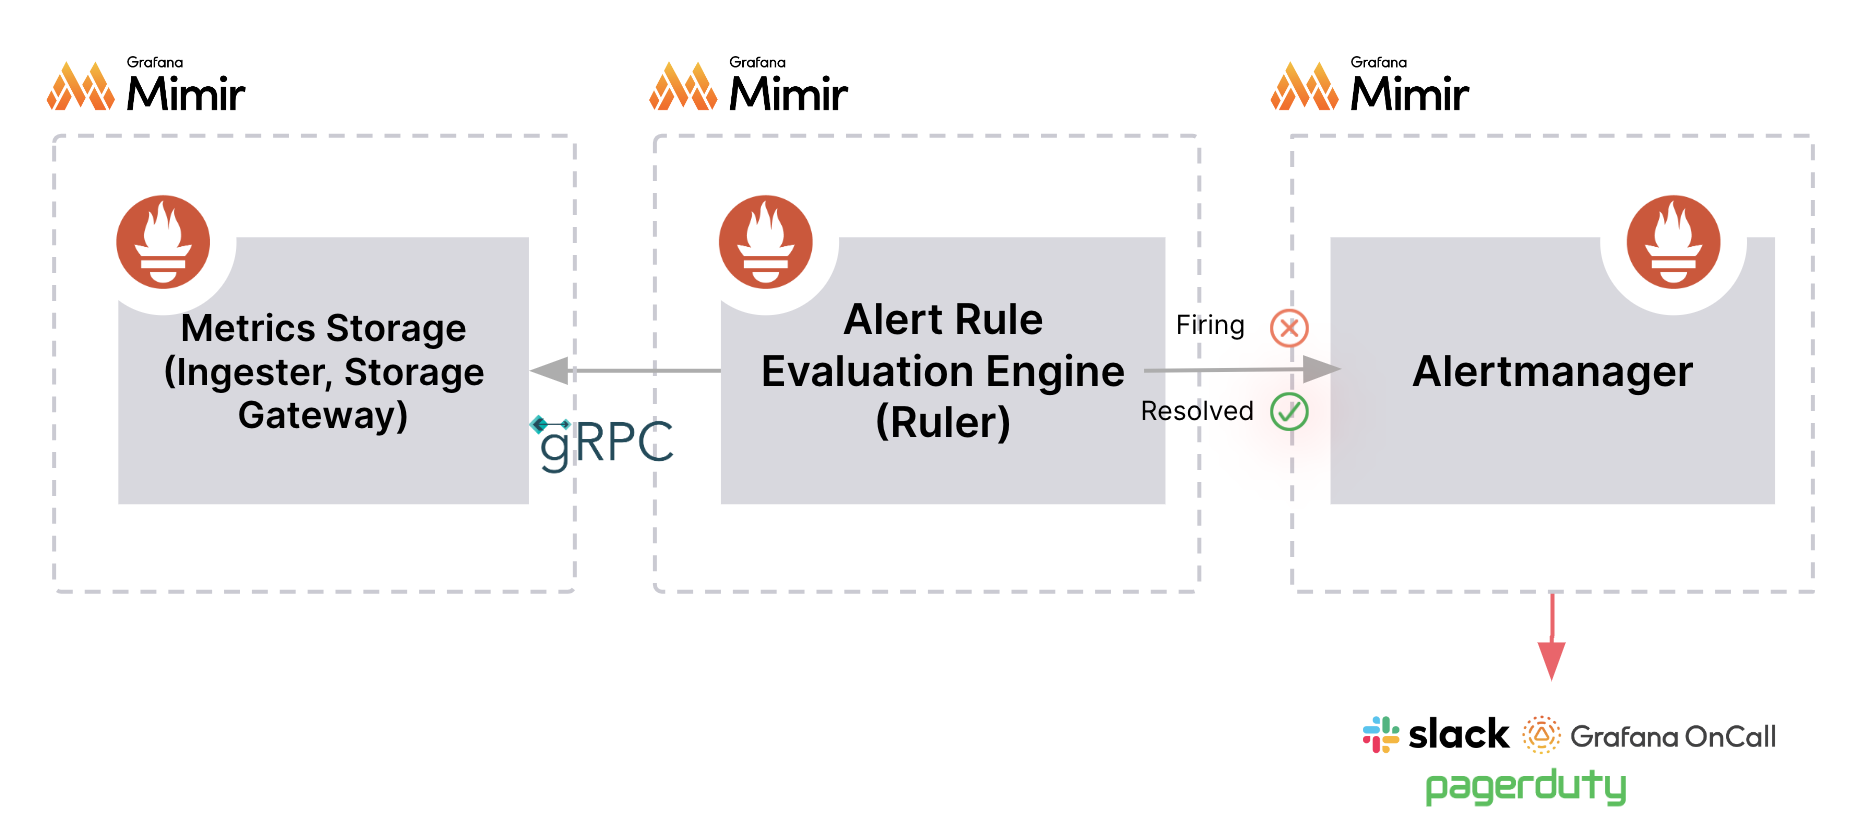
- Alert rules are created and stored within the data source itself.
- Alert rules can only query Prometheus-based data. It can use either queries or recording rules.
- Alert rules are evaluated by the Alert Rule Evaluation Engine.
- Firing and resolved alert instances are forwarded to handle their notifications.
Recording rules
A recording rule allows you to pre-compute frequently needed or computationally expensive expressions and save their result as a new set of time series. This is useful if you want to run alerts on aggregated data or if you have dashboards that query computationally expensive expressions repeatedly.
Querying this new time series is faster, especially for dashboards since they query the same expression every time the dashboards refresh. For more information, refer to Create recording rules.
Alternatively, Grafana Enterprise and Grafana Cloud offer recorded queries that can be executed against any data source.
Comparison between alert rule types
When choosing which alert rule type to use, consider the following comparison between Grafana-managed and data source-managed alert rules.
Feature | Grafana-managed alert rule | Data source-managed alert rule |
|---|---|---|
| Create alert rules | Yes | No. You can only create alert rules that are based on Prometheus-based data. |
| Mix and match data sources | Yes | No |
| Includes support for recording rules | No | Yes |
| Add expressions to transform | Yes | No |
| Use images in alert notifications | Yes | No |
| Organization | Organize and manage access with folders | Use namespaces |
| Scaling | More resource intensive, depend on the database, and are likely to suffer from transient errors. They only scale vertically. | Store alert rules within the data source itself and allow for “infinite” scaling. Generate and send alert notifications from the location of your data. |
| Alert rule evaluation and delivery | Alert rule evaluation and delivery is done from within Grafana, using an external Alertmanager; or both. | Alert rule evaluation and alert delivery is distributed, meaning there is no single point of failure. |


