
Example of dynamic thresholds per dimension
In Grafana Alerting, each alert rule supports only one condition expression.
That’s enough in many cases—most alerts use a fixed numeric threshold like latency > 3s or error_rate > 5% to determine their state.
As your alerting setup grows, you may find that different targets require different threshold values.
Instead of duplicating alert rules, you can assign a different threshold value to each target—while keeping the same condition. This simplifies alert maintenance.
This example shows how to do that using multi-dimensional alerts and a Math expression.
Example overview
You’re monitoring latency across multiple API services. Initially, you want to get alerted if the 95th percentile latency (p95_api_latency) exceeds 3 seconds, so your alert rule uses a single static threshold:
p95_api_latency > 3But the team quickly finds that some services require stricter thresholds. For example, latency for payment APIs should stay under 1.5s, while background jobs can tolerate up to 5s. The team establishes different thresholds per service:
p95_api_latency{service="checkout-api"}: must stay under1.5s.p95_api_latency{service="auth-api"}: also strict,1.5s.p95_api_latency{service="catalog-api"}: less critical,3s.p95_api_latency{service="async-tasks"}: background jobs can tolerate up to5s.
You want to avoid creating one alert rule per service—this is harder to maintain.
In Grafana Alerting, you can define one alert rule that monitors multiple similar components like this scenario. This is called multi-dimensional alerts: one alert rule, many alert instances—one per unique label set.
But there’s an issue: Grafana supports only one alert condition per rule.
One alert rule
├─ One condition ( e.g., $A > 3)
│  └─ Applies to all returned series in $A
│     ├─ {service="checkout-api"}
│     ├─ {service="auth-api"}
│     ├─ {service="catalog-api"}
│     └─ {service="async-tasks"}
To evaluate per-service thresholds, you need a distinct threshold value for each returned series.
Dynamic thresholds using a Math expression
You can create a dynamic alert condition by operating on two queries with a Math expression.
$Afor query results (e.g.,p95_api_latency).$Bfor per-service thresholds (from CSV data or another query).$A > $Bis the Math expression that defines the alert condition.
Grafana evaluates the Math expression per series, by joining series from $A and $B based on their shared labels before applying the expression.
Here’s an example of an arithmetic operation:
$Areturns series{host="web01"} 30and{host="web02"} 20.$Breturns series{host="web01"} 10and{host="web02"} 0.$A + $Breturns{host="web01"} 40and{host="web02"} 20.
In practice, you must align your threshold input with the label sets returned by your alert query.
The following table illustrates how a per-service threshold is evaluated in the previous example:
In this example:
$Acomes from thep95_api_latencyquery.$Bis manually defined with a threshold value for each series in$A.- The alert condition compares
$A>$Busing a Math relational operator (e.g.,>,<,>=,<=,==,!=) that joins series by matching labels. - Grafana evaluates the alert condition and sets the firing state where the condition is true.
The Math expression works as long as each series in $A can be matched with exactly one series in $B. They must align in a way that produces a one-to-one match between series in $A and $B.
Caution
If a series in one query doesn’t match any series in the other, it’s excluded from the result and a warning message is displayed:
1 items dropped from union(s): ["$A > $B": ($B: {service=payment-api})]
Labels in both series don’t need to be identical. If labels are a subset of the other, they can join. For example:
$Areturns series{host="web01", job="event"}30 and{host="web02", job="event"}20.$Breturns series{host="web01"}10 and{host="web02"}0.$A+$Breturns{host="web01", job="event"}40 and{host="web02", job="event"}20.
Try it with TestData
You can use the TestData data source to replicate this example:
Add the TestData data source through the Connections menu.
Create an alert rule.
Navigate to Alerting → Alert rules and click New alert rule.
Simulate a query (
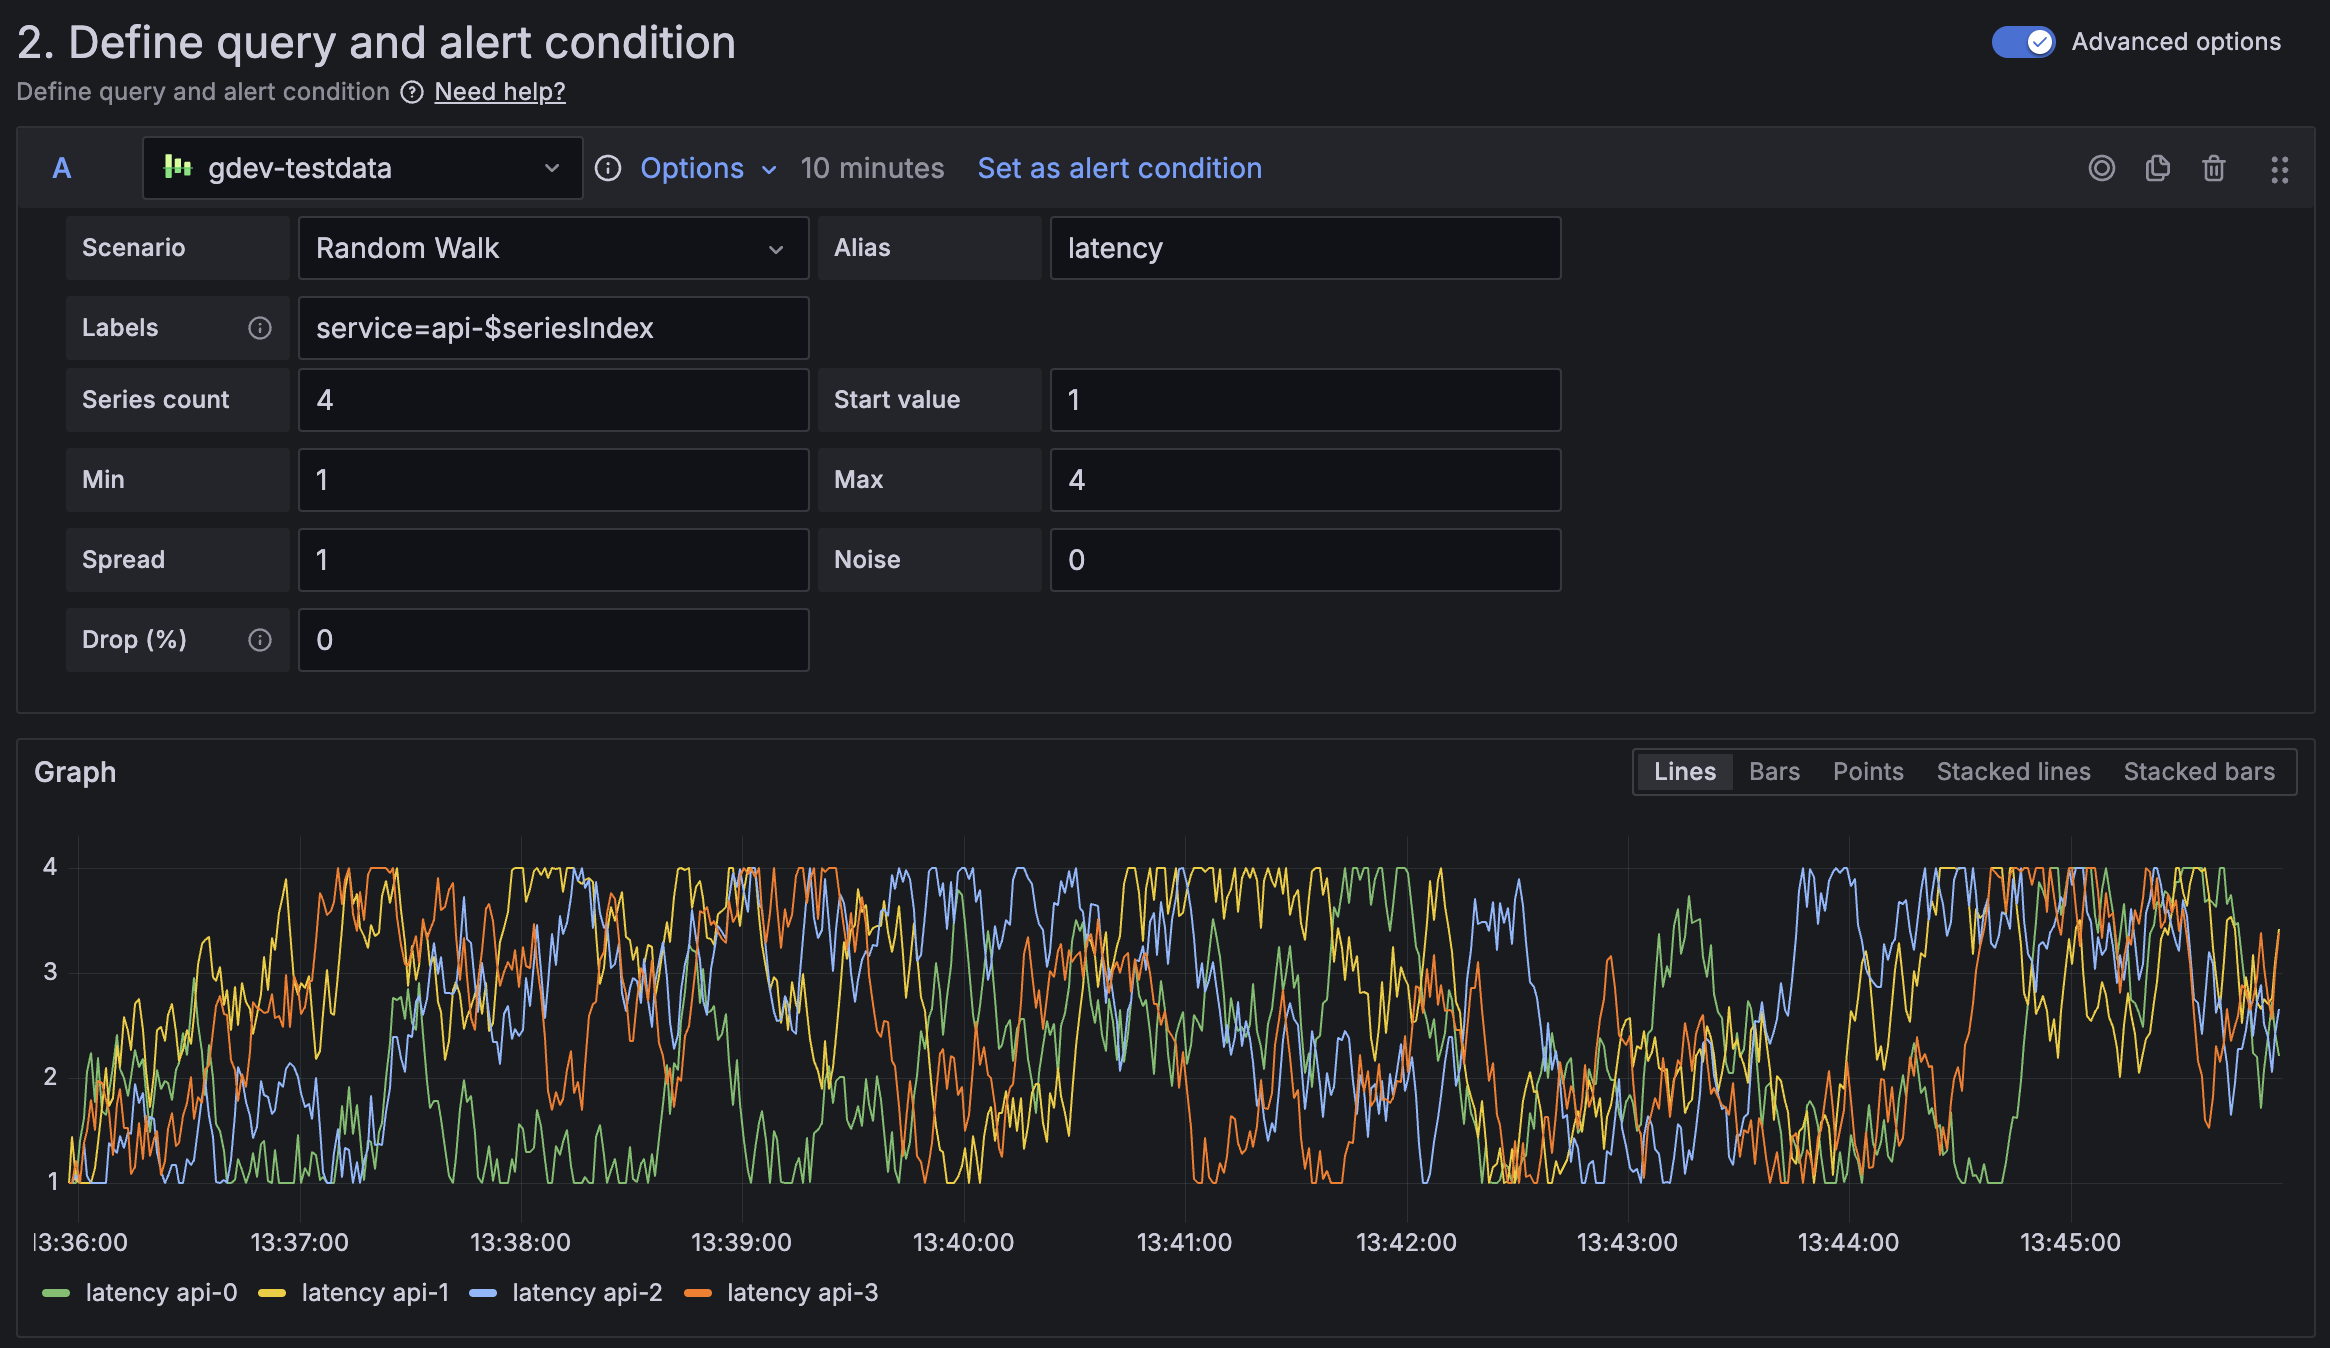
$A) that returns latencies for each service.Select TestData as the data source and configure the scenario.
Scenario: Random Walk
Alias: latency
Labels: service=api-$seriesIndex
Series count: 4
Start value: 1
Min: 1, Max: 4
This uses
$seriesIndexto assign unique service labels:api-0,api-1, etc.
![TestData data source returns 4 series to simulate latencies for distinct API services.]()
Define per-service thresholds with static data.
Add a new query (
$B) and select TestData as the data source.From Scenario, select CSV Content and paste this CSV:
 service,value
 api-0,1.5
 api-1,1.5
 api-2,3
 api-3,5
The
servicecolumn must match the labels from$A.The
valuecolumn is a numeric value used for the alert comparison.For details on CSV format requirements, see table data examples.
Add a new Reduce expression (
$C).- Type: Reduce
- Input: A
- Function: Mean
- Name: C
This calculates the average latency for each service:
api-0,api-1, etc.Add a new Math expression.
- Type: Math
- Expression:
$C > $B - Set this expression as the alert condition.
This fires if the average latency (
$C) exceeds the threshold from$Bfor any service.Preview the alert.

Alert preview evaluating multiple series with distinct threshold values ![Give it a try using Grafana Play]() Give it a try using Grafana Play
Give it a try using Grafana PlayWith Grafana Play, you can explore and see how it works, learning from practical examples to accelerate your development. This feature can be seen on this alert example.

Other use cases
This example showed how to build a single alert rule with different thresholds per series using multi-dimensional alerts and Math expressions.
This approach scales well when monitoring similar components with distinct reliability goals.
By aligning series from two queries, you can apply a dynamic threshold—one value per label set—without duplicating rules.
While this example uses static CSV content to define thresholds, the same technique works in other scenarios:
- Dynamic thresholds from queries or recording rules: Fetch threshold values from a real-time query, or from custom recording rules.
- Combine multiple conditions: Build more advanced threshold logic by combining multiple conditions—such as latency, error rate, or traffic volume.
For example, you can define a PromQL expression that sets a latency threshold which adjusts based on traffic—allowing higher response times during periods of high-load.
(
  // Fires when p95 latency > 2s during usual traffic (≤ 1000 req/s)
  service:latency:p95 > 2 and service:request_rate:rate1m <= 1000
)
or
(
  // Fires when p95 latency > 4s during high traffic (> 1000 req/s)
  service:latency:p95 > 4 and service:request_rate:rate1m > 1000
)

