
Example of dynamic labels in alert instances
Labels are essential for scaling your alerting setup. They define metadata like severity, team, category, or environment, which you can use for alert routing.
A label like severity="critical" can be set statically in the alert rule configuration, or dynamically based on a query value such as the current free disk space. Dynamic labels adjust label values at runtime, allowing you to reuse the same alert rule across different scenarios.
This example shows how to define dynamic labels based on query values, along with key behavior to keep in mind when using them.
First, it’s important to understand how Grafana Alerting treats labels.
Alert instances are defined by labels
Each alert rule creates a separate alert instance for every unique combination of labels.
This is called multi-dimensional alerts: one rule, many instances—one per unique label set.
For example, a rule that queries CPU usage per host might return multiple series (or dimensions):
{alertname="ServerHighCPU", instance="prod-server-1" }{alertname="ServerHighCPU", instance="prod-server-2" }{alertname="ServerHighCPU", instance="prod-server-3" }
Each unique label combination defines a distinct alert instance, with its own evaluation state and potential notifications.
The full label set of an alert instance can include:
- Labels from the query result (e.g.,
instance) - Auto-generated labels (e.g.,
alertname) - User-defined labels from the rule configuration
User-defined labels
As shown earlier, alert instances automatically include labels from the query result, such as instance or job. To add more context or control alert routing, you can define user-defined labels in the alert rule configuration:
User-defined labels can be either:
Fixed labels: These have the same value for every alert instance. They are often used to include common metadata, such as team ownership.
Templated labels: These calculate their values based on the query result at evaluation time.
Templated labels
Templated labels evaluate their values dynamically, based on the query result. This allows the label value to vary per alert instance.
Use templated labels to inject additional context into alerts. To learn about syntax and use cases, refer to Template annotations and labels.
You can define templated labels that produce either:
- A fixed value per alert instance.
- A dynamic value per alert instance that changes based on the last query result.
Fixed values per alert instance
You can use a known label value to enrich the alert with additional metadata not present in existing labels. For example, you can map the instance label to an env label that represents the deployment environment:
{{- if eq $labels.instance "prod-server-1" -}}production
{{- else if eq $labels.instance "stag-server-1" -}}staging
{{- else -}}development
{{- end -}}
This produces alert instances like:
{alertname="ServerHighCPU", instance="prod-server-1", env="production"}{alertname="ServerHighCPU", instance="stag-server-1", env="staging"}
In this example, the env label is fixed for each alert instance and does not change during its lifecycle.
Dynamic values per alert instance
You can define a label whose value depends on the numeric result of a query—mapping it to a predefined set of options. This is useful for representing severity levels within a single alert rule.
Instead of defining three separate rules like:
- CPU ≥ 90 →
severity=critical - CPU ≥ 80 →
severity=warning - CPU ≥ 70 →
severity=minor
You can define a single rule and assign severity dynamically using a template:
{{/* $values.B.Value refers to the numeric result from query B */}}
{{- if gt $values.B.Value 90.0 -}}critical
{{- else if gt $values.B.Value 80.0 -}}warning
{{- else if gt $values.B.Value 70.0 -}}minor
{{- else -}}none
{{- end -}}
This pattern lets you express multiple alerting scenarios in a single rule, while still routing based on the severity label value.
Example overview
In the previous severity template, you can set the alert condition to $B > 70 to prevent firing when severity=none, and then use the severity label to route distinct alert instances to different contact points.
For example, configure a
notification policy that matches alertname="ServerHighCPU" with the following children policies:
severity=critical→ escalate to an incident response and management solution (IRM).severity=warning→ send to the team’s Slack channel.severity=minor→ send to a non-urgent queue or log-only dashboard.
The resulting alerting flow might look like this:
This alerting setup allows you to:
- Use a single rule for multiple severity levels.
- Route alerts dynamically using the label value.
- Simplify alert rule maintenance and avoid duplication.
However, dynamic labels can introduce unexpected behavior when label values change. The next section explains this.
Caveat: a label change affects a distinct alert instance
Remember: alert instances are defined by their labels.
If a dynamic label changes between evaluations, this new value affects a separate alert instance.
Here’s what happens if severity changes from minor to warning:
- The instance with
severity="minor"disappears → it becomes a missing series. - A new instance with
severity="warning"appears → it starts from scratch. - After two evaluations without data, the
minorinstance is resolved and evicted.
Here’s a sequence example:
Learn more about this behavior in Stale alert instances.
In this example, the minor and warning alerts likely represent the same underlying issue, but Grafana treats them as distinct alert instances. As a result, this scenario generates two firing notifications and two resolved notifications, one for each instance.
This behavior is important to keep in mind when dynamic label values change frequently.
It can lead to multiple notifications firing and resolving in short intervals, resulting in noisy and confusing notifications.
Try it with TestData
You can replicate this scenario using the TestData data source to simulate an unstable signal—like monitoring a noisy sensor.
This setup reproduces label flapping and shows how dynamic label values affect alert instance behavior.
Add the TestData data source through the Connections menu.
Create an alert rule.
Navigate to Alerting → Alert rules and click New alert rule.
Simulate a query (
$A) that returns a noisy signal.Select TestData as the data source and configure the scenario.
- Scenario: Random Walk
- Series count: 1
- Start value: 51
- Min: 50, Max: 100
- Spread: 100 (ensures large changes between consecutive data points)
Add an expression.
- Type: Reduce
- Input: A
- Function: Last (to get the most recent value)
- Name: B
Define the alert condition.
Use a threshold like
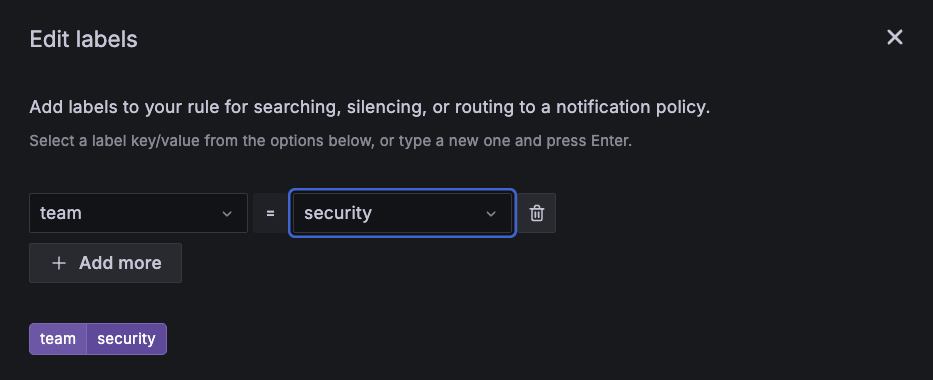
$B >= 50(it always fires).Click Edit Labels to add a dynamic label.
Create a new label
severityand set its value to the following:{{/* $values.B.Value refers to the numeric result from query B */}} {{- if gt $values.B.Value 90.0 -}}P1 {{- else if gt $values.B.Value 80.0 -}}P2 {{- else if gt $values.B.Value 70.0 -}}P3 {{- else if gt $values.B.Value 60.0 -}}P4 {{- else if gt $values.B.Value 50.0 -}}P5 {{- else -}}none {{- end -}}Set evaluation behavior.
Set a short evaluation interval (e.g.,
10s) to observe quickly label flapping and alert instance transitions in the history.Preview alert routing to verify the label template.
In Configure notifications, toggle Advanced options.
Click Preview routing and check the value of theseveritylabel:
Preview routing multiple times to verify how label values change over time. Observe alert state changes.
Click Save rule and exit, and open the alert history view to see how changes in
severityaffect the state of distinct alert instances.
You can find multiple transitions over time as the label value fluctuates. ![Give it a try using Grafana Play]() Give it a try using Grafana Play
Give it a try using Grafana PlayWith Grafana Play, you can explore and see how it works, learning from practical examples to accelerate your development. This feature can be seen on this alert example.


Considerations
Dynamic labels lets you reuse a single alert rule across multiple escalation scenarios—but it also introduces complexity. When the label value depends on a noisy metric and changes frequently, it can lead to flapping alert instances and excessive notifications.
These alerts often require tuning to stay reliable and benefit from continuous review. To get the most out of this pattern, consider the following:
Tune evaluation settings and queries for stability
Increase the evaluation interval and pending period to reduce the frequency of state changes. Additionally, consider smoothing metrics with functions like
avg_over_timeto reduce flapping.Use wider threshold bands
Define broader ranges in your label template logic to prevent label switching caused by small value changes.
Disable resolved notifications
When labels change frequently and alerts resolve quickly, you can reduce the number of notifications by disabling resolved notifications at the contact point.
Disable the Missing series evaluations setting
The Missing series evaluations setting (default: 2) defines how many intervals without data are allowed before resolving an instance. Consider disabling it if it’s unnecessary for your use case, as it can complicate alert troubleshooting.
Preserve context across related alerts
Ensure alert metadata includes enough information to help correlate related alerts during investigation.
Use separate alert rules and static labels when simpler
In some cases, defining separate rules with static labels may be easier to manage than one complex dynamic rule. This also allows you to customize alert queries for each specific case.
Learn more
Here’s a list of additional resources related to this example:
- Multi-dimensional alerting example – Explore how Grafana creates separate alert instances for each unique set of labels.
- Labels – Learn about the different types of labels and how they define alert instances.
- Template labels in alert rules – Use templating to set label values dynamically based on query results.
- Stale alert instances – Understand how Grafana resolves and removes stale alert instances.
- Handle missing data – Learn how Grafana distinguishes between missing series and
NoData. - Notification policies and routing – Create multiple notification policies to route alerts based on label values like
severityorteam. - Dynamic label example in Grafana Play - View this example in Grafana Play to explore alert instances and state transitions with dynamic labels.


