Grafana Advisor
Note
Grafana Advisor performs regular checks on data sources, plugins, and your Grafana instance, but will expand its capabilities in future releases to cover more aspects of your Grafana environment. You can suggest new checks and provide feedback through this form.
Grafana Advisor is a monitoring tool that helps administrators keep their Grafana instances running smoothly and securely. It automatically performs regular health checks on your Grafana server, providing actionable insights and recommendations for maintaining optimal system performance.
To access Grafana Advisor:
- Log in to your Grafana instance with an Administrator account.
- Navigate to the Administration section on the left navigation menu.
- Click Advisor.
- If you’re a first time user, select Generate report to run Advisor and obtain your first report. From now on, reporting is automated and updated periodically.
Navigate the Advisor report
An Advisor report can contain the following tasks and action suggestions:
Note
You can configure which checks Advisor will run. Refer to Configure application for details.
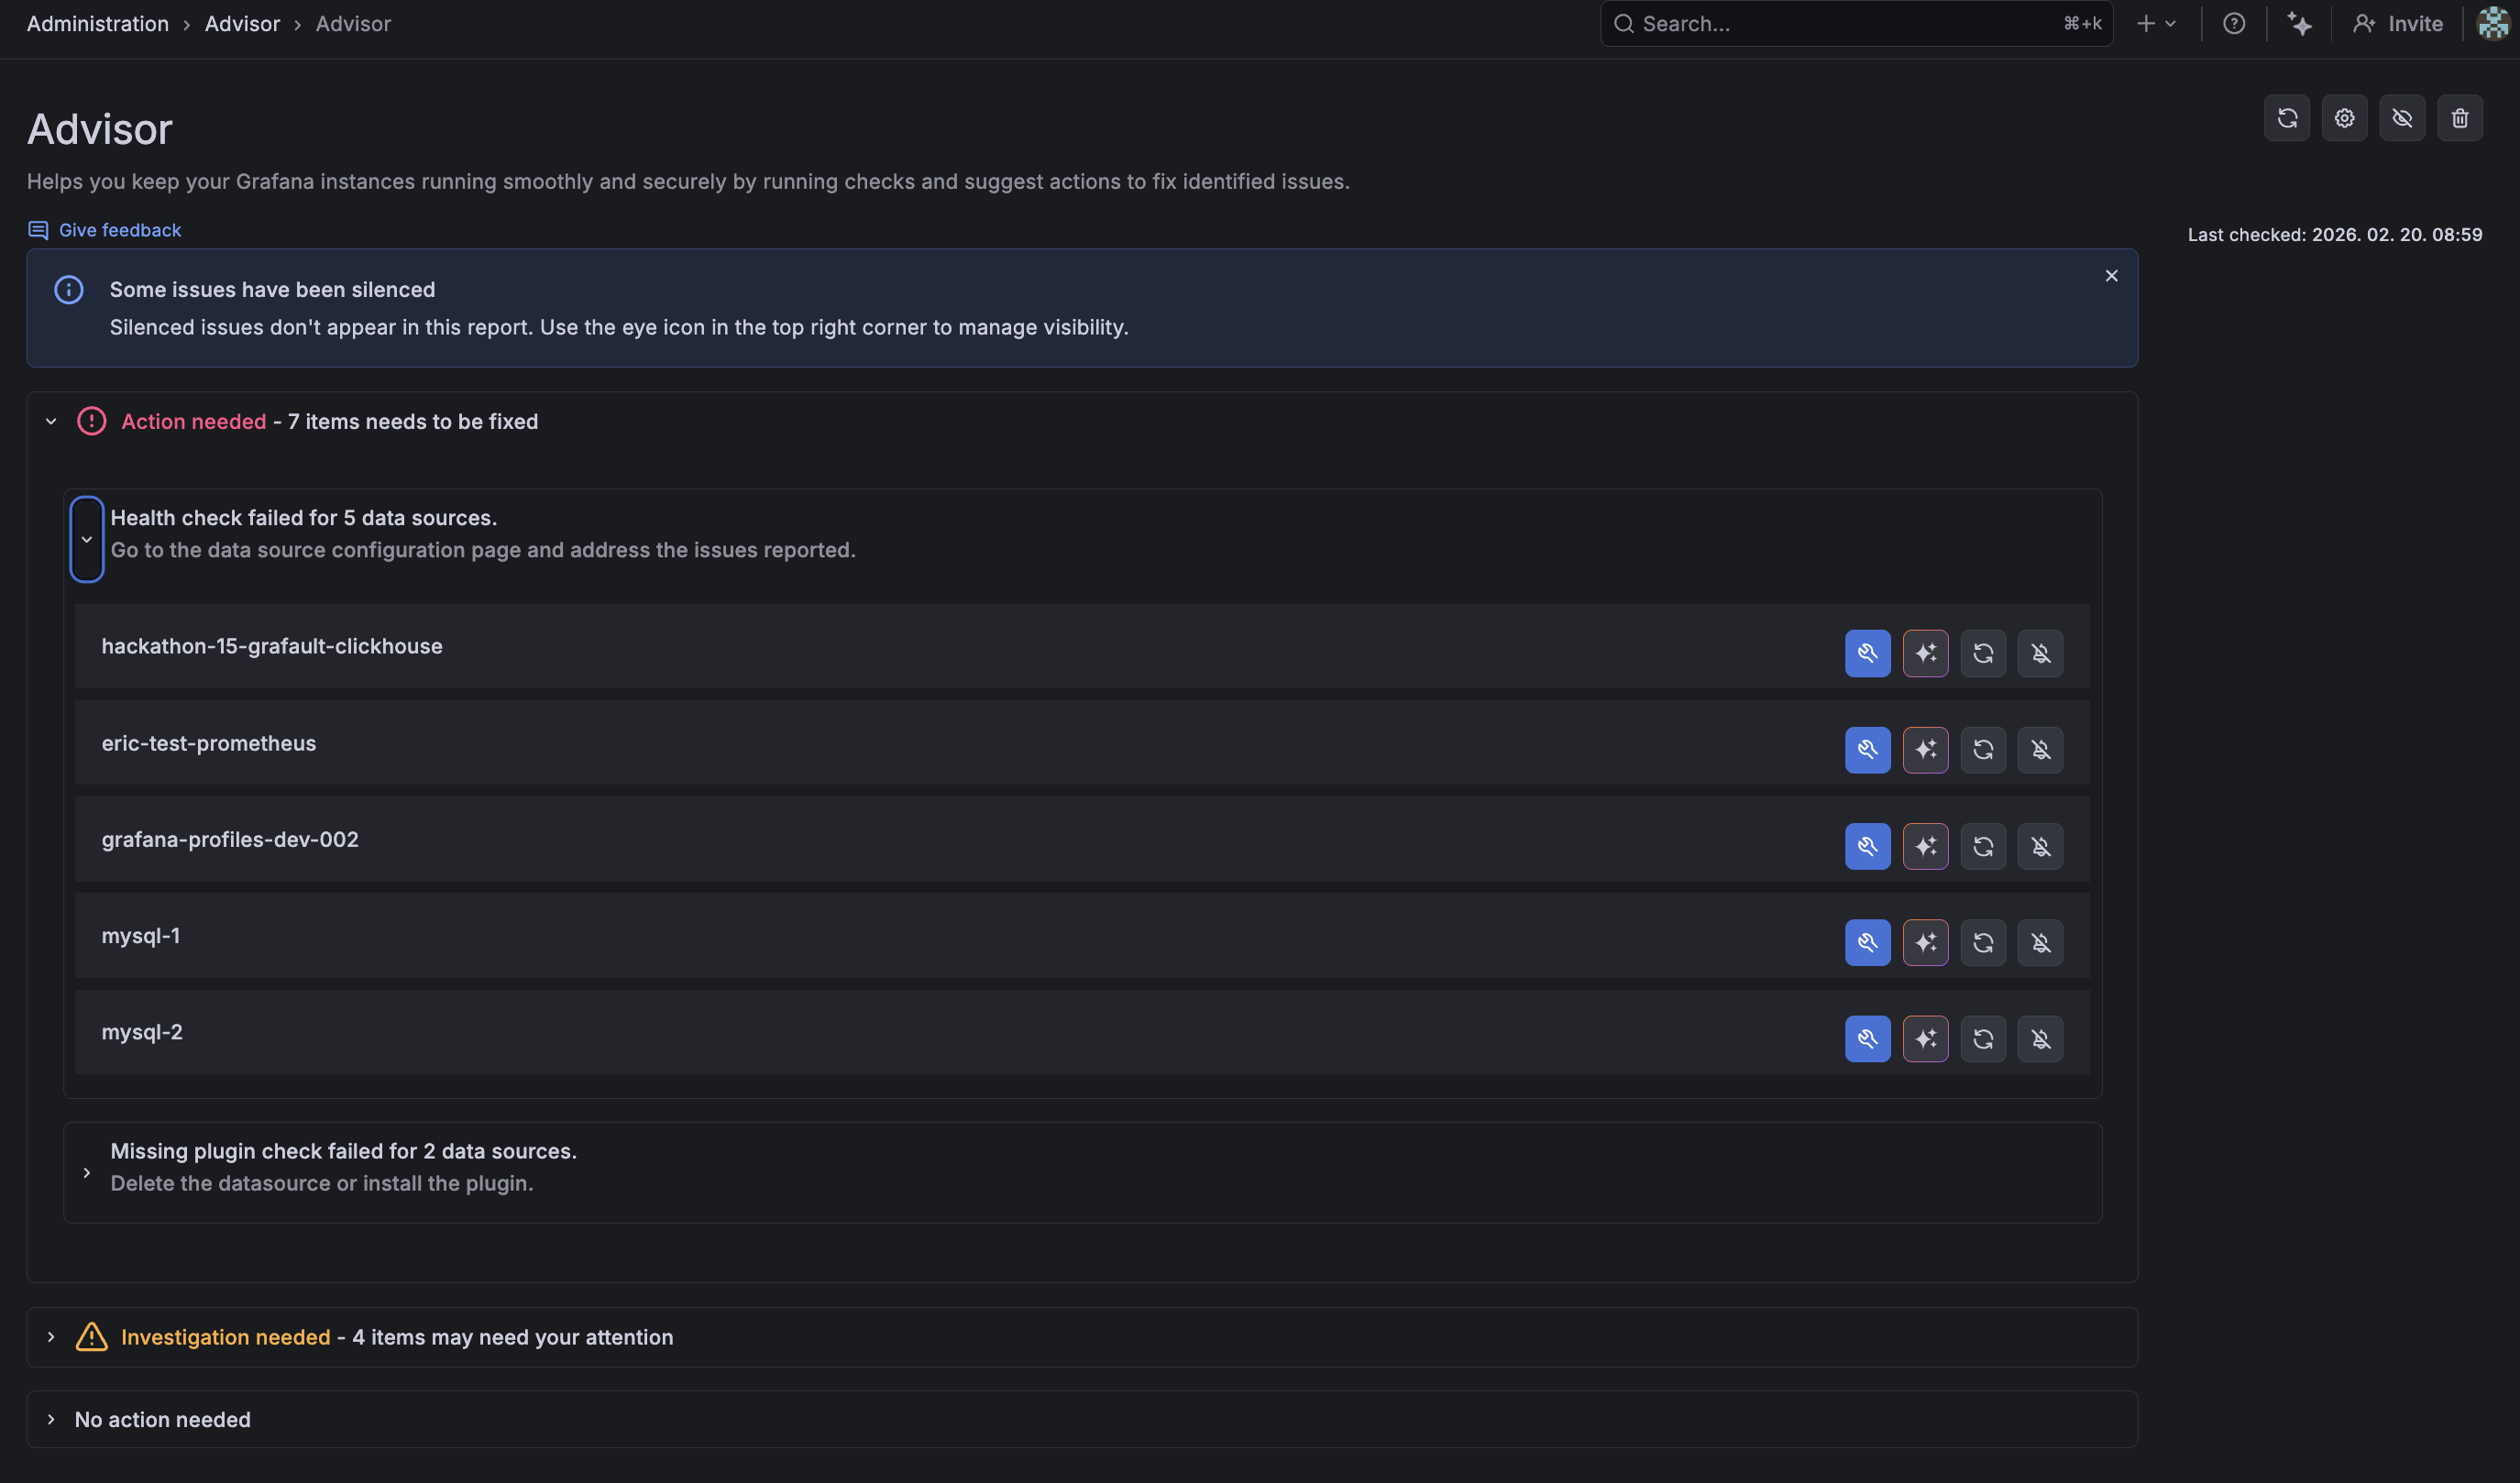
Action needed
This collapsible section displays issues requiring immediate attention. For each item, Grafana Advisor displays the specific name of the item that needs to be fixed. For data source issues, Grafana Advisor displays the specific data source name.
For each item, one or more buttons appear:
- Fix the issue.
- The Grafana Assistant sparkle icon, which will take you to the Assistant.
- Retry the check.
- Hide the error. If you hide an error you can see it again by clicking the Hide/Show silenced errors eye icon on the top right corner.
For details on how to update your plugins, refer to Manage your plugins if you’re using OSS/Enterprise, or refer to Find and use Grafana plugins if you’re using Grafana Cloud.
Investigation needed
This collapsible section provides information on issues that may not require immediate action but require your attention. For example, it provides information on plugins that require an upgrade. Similar to the Action needed section, clicking an item opens the plugin’s upgrade page. From there, you can either update to the latest version or select a specific version from the version history tab.
No action needed
This collapsible section provides more details about which checks have been performed and how many items have been analyzed. You can configure which checks Advisor will run. See how in Advisor menu > Configure application.
Use Grafana Advisor with Grafana Assistant
You can use Advisor with the Grafana Assistant, a purpose-built LLM in Grafana Cloud that allows you to troubleshoot incidents, manage resources, and answer product questions in minutes. The Assistant removes manual operations and speeds up response time. Strong privacy and security controls ensure conversations respect RBAC, route through vetted service providers, and rely on your telemetry to produce action-ready results.
If you click on the sparkle icon next to each issue detected, you will open a chat with the Assistant with all the existing information about the issue.
To learn more, refer to the Grafana Assistant documentation.
Advisor menu
On the top right corner of the Advisor UI you have the following options and settings:
- Refresh the report.
- Configure application. Click the cogwheel button to access Grafana Advisor plugin settings, where you can enable or disable checks according to your preferences. Available checks cover configuration, installed plugins and data sources, Grafana instance versions, or SSO settings.
- Hide/Show silenced issues.
- Delete reports.
Address issues detected by Grafana Advisor
To maintain system reliability and keep your Grafana instance secure and up to date, regularly check the Advisor page to resolve issues flagged by Grafana Advisor:
- Regular Monitoring: Check the Advisor page often to identify and address emerging issues.
- Immediate Action: Address “Action needed” items promptly to ensure system reliability.
- Systematic Review: After fixing flagged issues, use the “Refresh” button to confirm all checks pass.
- Proactive Updates: Address plugin update recommendations under “Investigation needed” even if they haven’t caused failures yet.
You can also set up your own alerts with Grafana Alerting, which allows you to monitor your incoming data and set up alerts for specific events or circumstances. You can then create, manage, and take action on your alerts from a single, consolidated view. Refer to the Grafana Alerting documentation for more information. To learn how to create an alert based on Grafana Advisor results, refer to Create an alert based on Grafana Advisor results.


