What's new from Grafana Labs
Grafana Labs products, projects, and features can go through multiple release stages before becoming generally available. These stages in the release life cycle can present varying degrees of stability and support. For more information, refer to release life cycle for Grafana Labs.
Loading...
Area of interest:
Cloud availability:
Cloud editions:
Self-managed availability:
Self-managed editions:
No results found. Please adjust your filters or search criteria.
There was an error with your request.
In Grafana v13.0, we’re removing several components deprecated since 2023 from the @grafana/ui package:
GraphGraphWithLegendGraphContextMenuGraphContextMenuHeadergraphTimeFormatgraphTickFormatterGraphSeriesTogglerGraphSeriesTogglerAPI
We’re also removing one component deprecated since January 2026:
The grafana-cli and grafana-server commands were deprecated in Grafana v10.0 in favor of the grafana cli and grafana server commands. Until now, both sets of commands were usable.
Previously, the Image Renderer authenticated with Grafana instances by using opaque tokens stored in the Grafana database in order to navigate to panels and dashboards to generate screenshots and PDFs.
Grafana alerting has added single-node alert evaluation for high availability clusters. When enabled, only one Grafana instance in the HA cluster evaluates alert rules, reducing query load on data sources.
Normally, when you run multiple instances of Grafana, all alert rules are evaluated on all instances by default. With single-node evaluation enabled, the Grafana cluster automatically chooses a primary instance that is responsible for evaluating all alert rules. Other instances skip evaluation entirely.
With single-node evaluation, the primary instance broadcasts fired alerts to all other instances through the cluster communication channel. This ensures that every instance’s embedded Alertmanager has the current alerts, which is necessary for failure recovery and for the Alertmanager API to return correct data on all instances.
Warning
Git Sync early adopters: A migration bug in Grafana v13.0.0 might cause dashboards and folders to be lost or reverted when upgrading from Grafana v12.x.x with Git Sync enabled. Upgrading from v13.0.0 to v13.0.1 does not recover lost data, and if you already upgraded, you must restore your database first, then upgrade to v13.0.1.
The config.apps and config.panels properties from the @grafana/runtime package are deprecated and scheduled for removal in Grafana 13.2.0, scheduled for the second half of 2026.
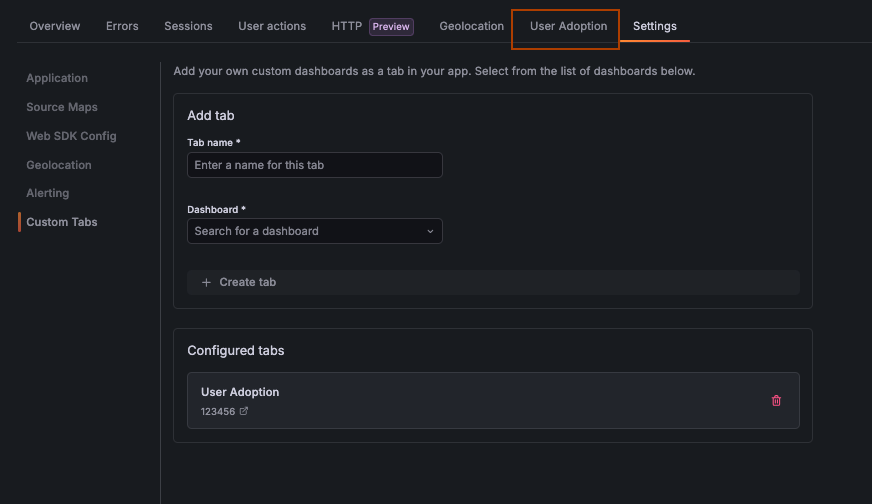
Add custom tabs in Frontend Observability that link directly to any Grafana dashboard, so your team can jump to the dashboards without losing context.
Whether it’s a custom performance dashboard, a business metrics view, or a team-specific RUM report, custom tabs let you surface the right context exactly where you need it. Tabs are configured from the Settings page and appear alongside existing navigation tabs once added, making it easy for every team member to access shared dashboards consistently.
We’ve introduced a quality of life improvement when configuring Adaptive Metrics exemptions; now, you create prefix and suffix exemptions, to more easily exempt classes of metrics. Support is available for this in the UI, Terraform provider, and API.
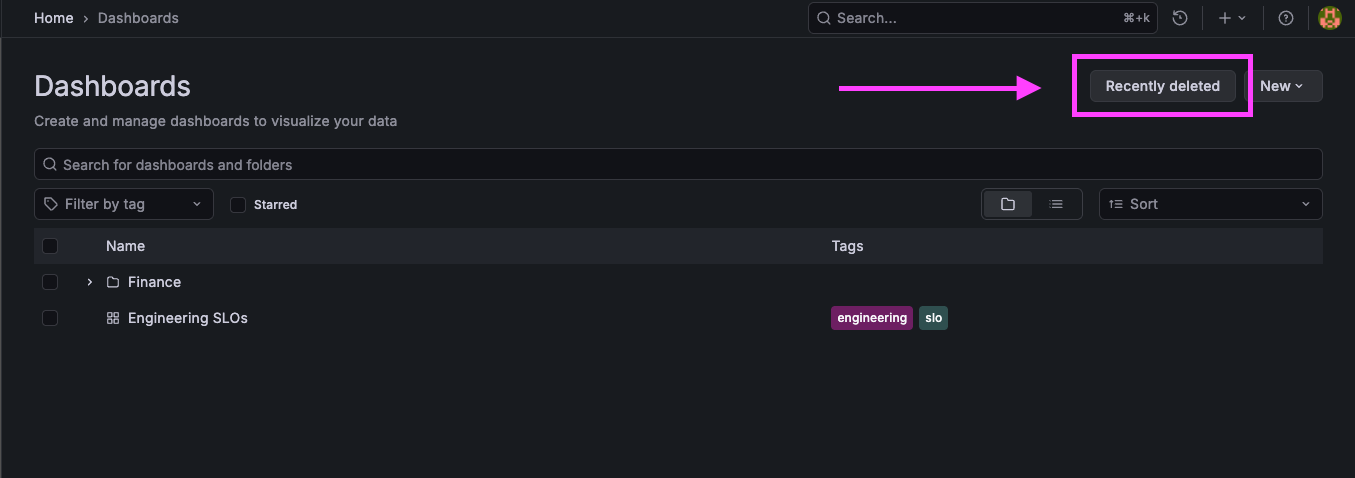
The restore dashboards feature is now generally available! We would love your feedback, you can share it here.
You can restore dashboards you’ve deleted without the need for a support ticket. With the new Recently deleted view, accidentally removing a dashboard no longer means lost work or rebuilding panels from scratch.
Prometheus and Loki data source-managed alerts are being deprecated in Grafana Cloud and can no longer be created in new stacks. Although the pre-provisioned data sources are being depreciated, users can still add their own data sources and can create data source-managed alerts in those data sources. New Grafana stacks now use Grafana-managed alerting (GMA) by default. Datasource-managed alerting (DMA) is not provisioned in new stacks. Existing stacks are not affected.
If your dashboard includes both an API gateway and a database, changing something like an $instance variable affects all panels at once. To avoid this, you might have to split up services across separate dashboards, which defeats the goal of having a unified view.
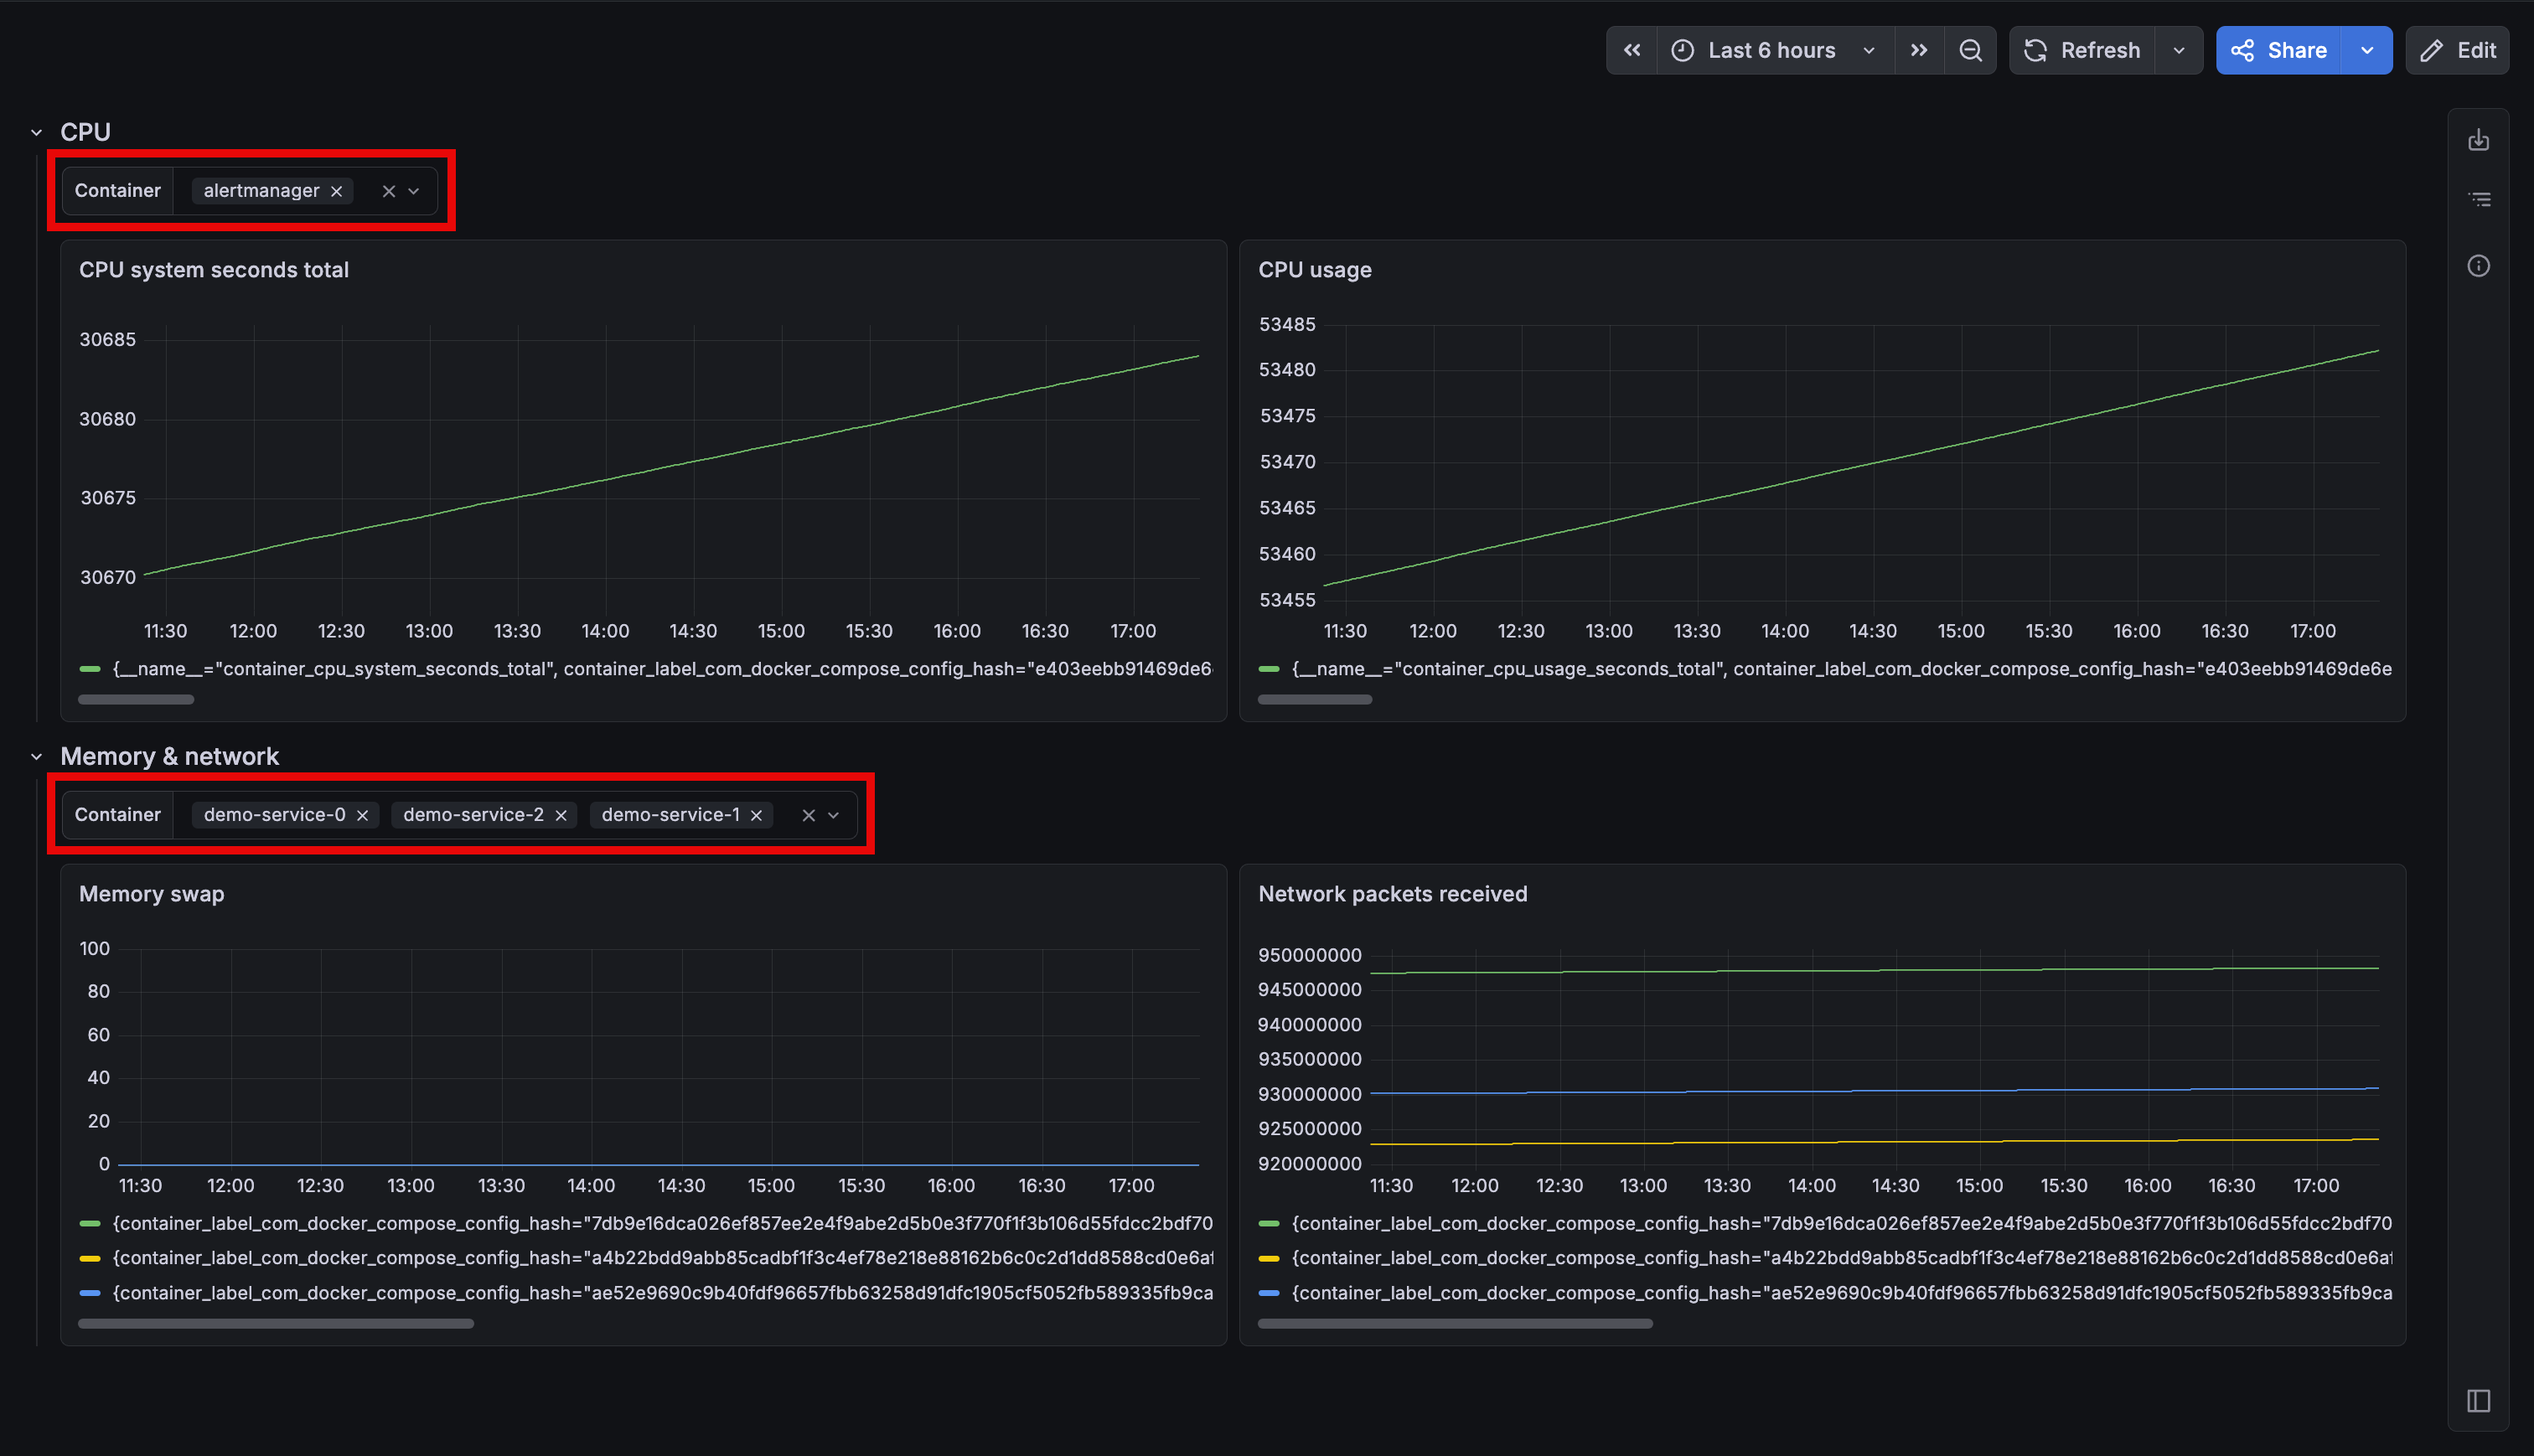
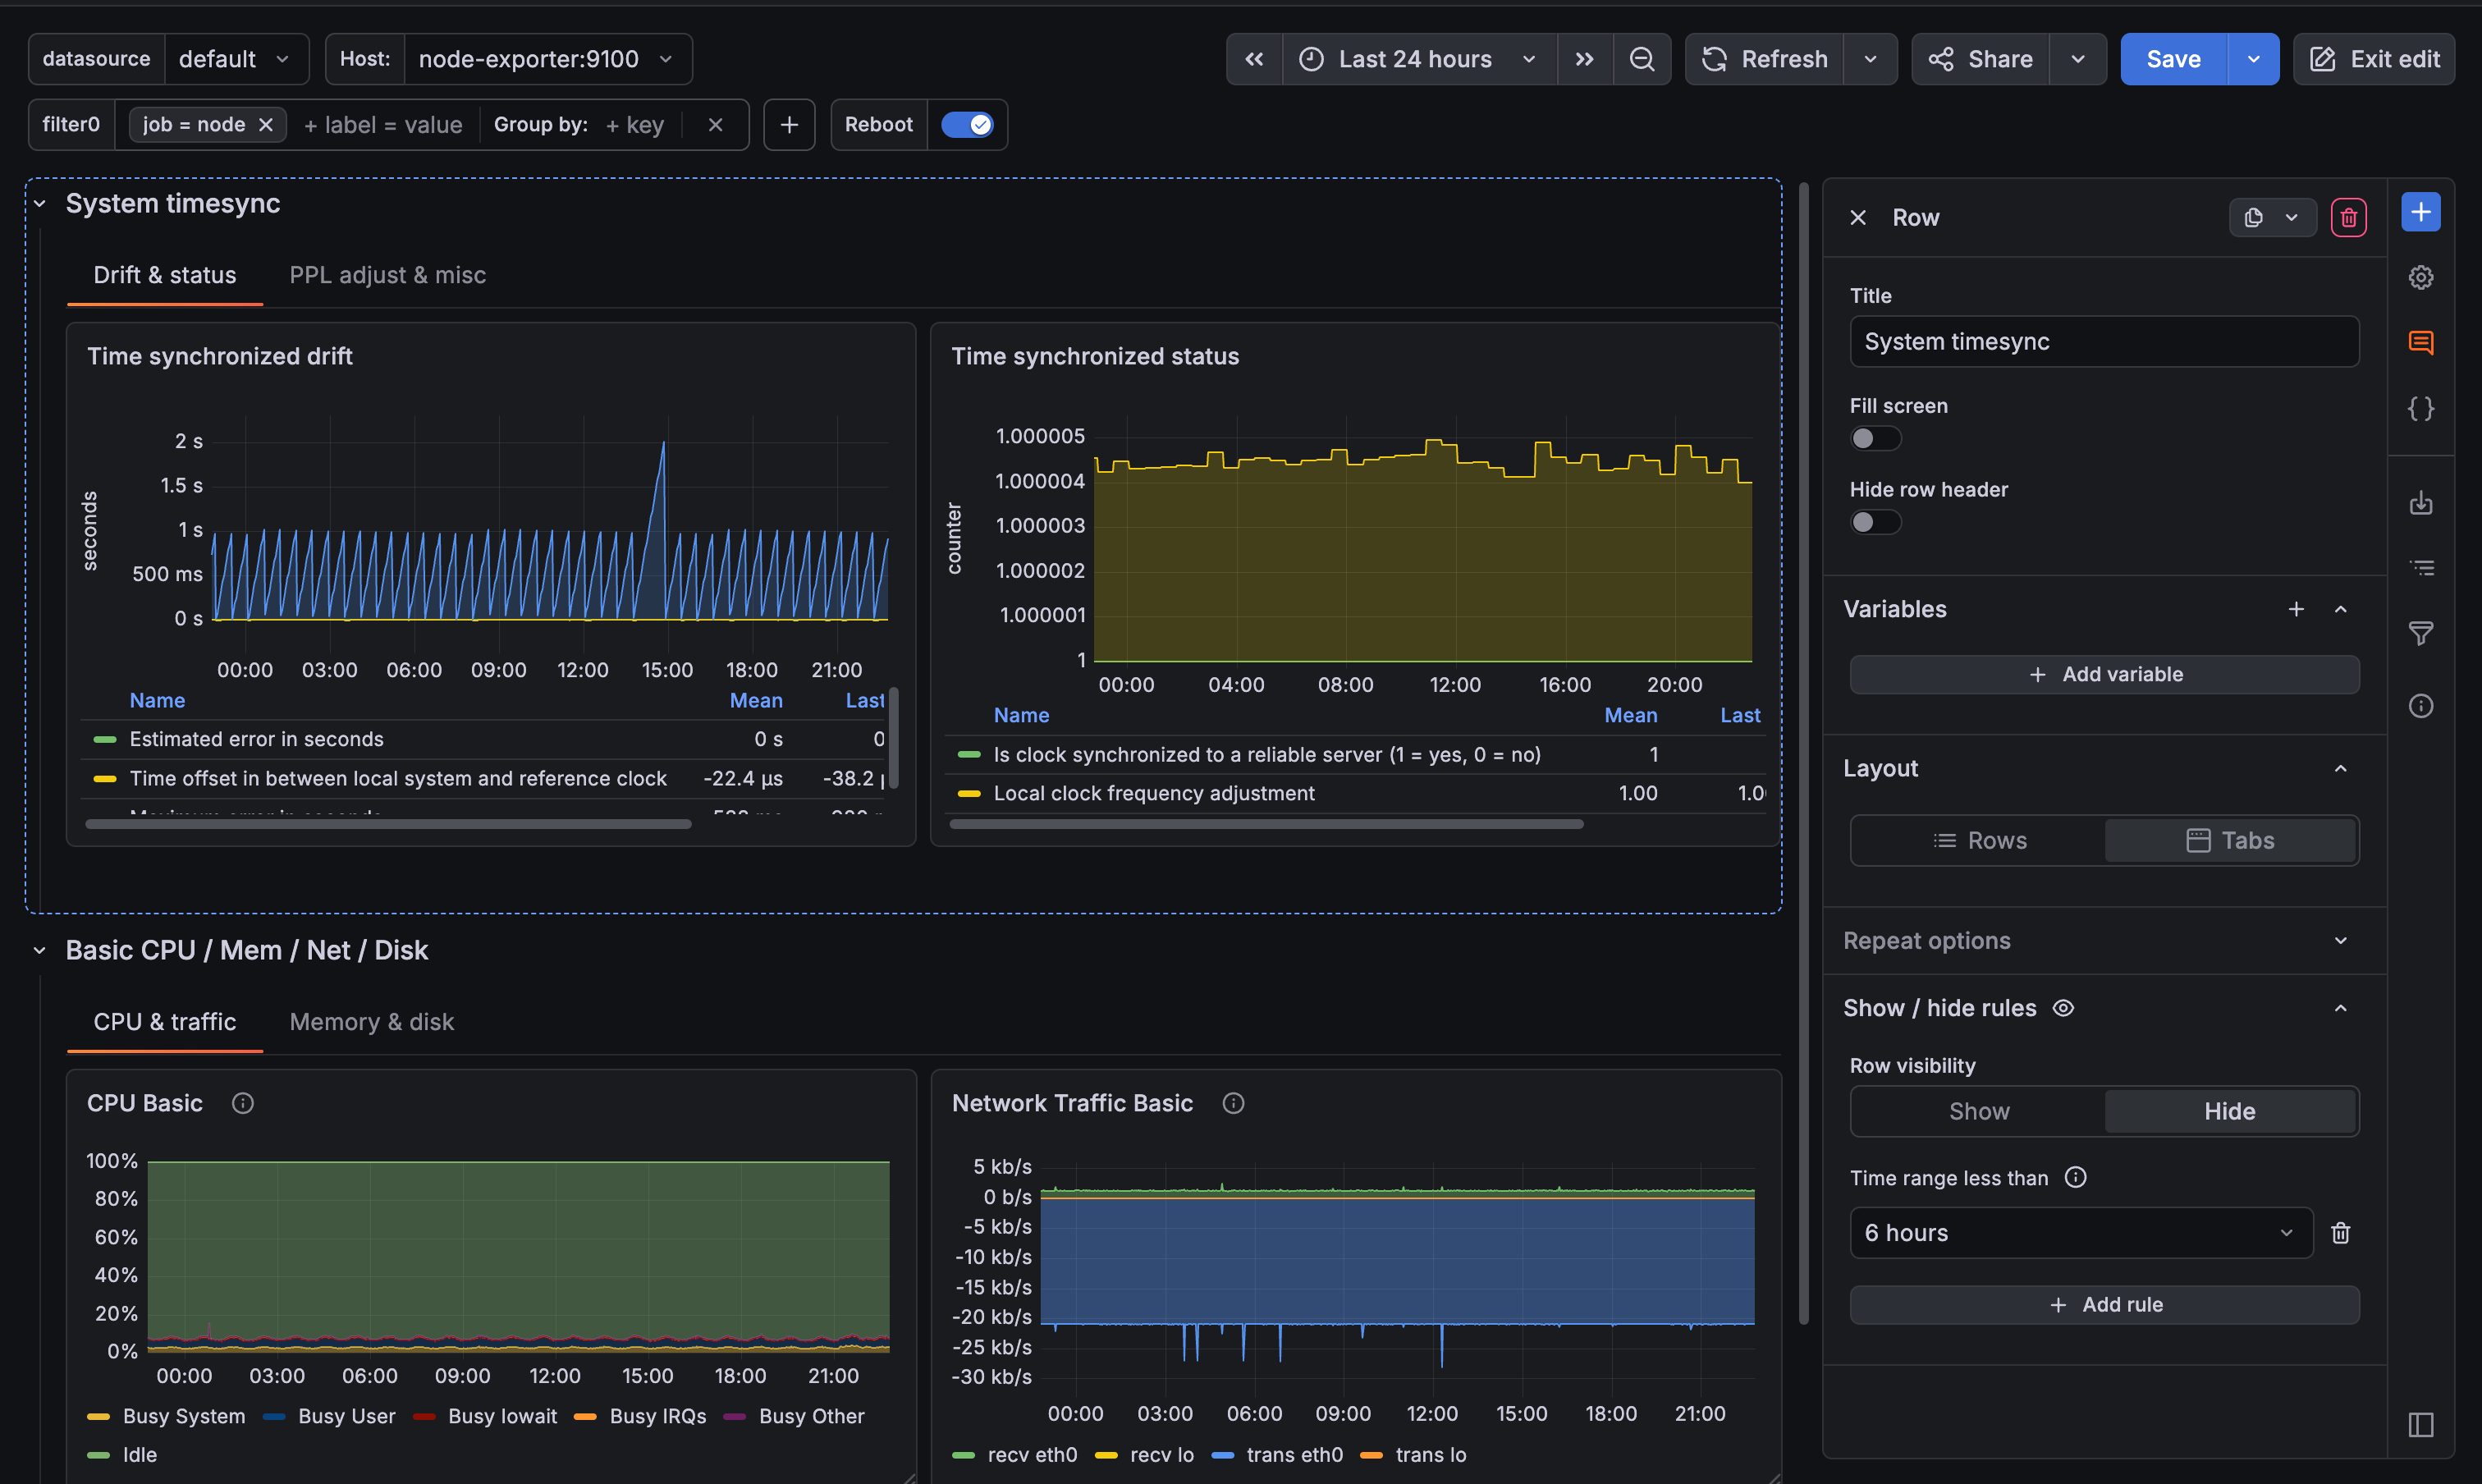
Dynamic dashboards are now on by default for all Grafana Cloud users and self-managed Grafana instances. Every new and existing dashboard uses the new layout engine, editing experience, and dashboard structure automatically. Your existing dashboards are migrated to the new schema when you open them. No manual steps required.
We’re excited to announce the public preview of Secrets Management for Grafana Cloud k6, a new feature that lets you securely store and use sensitive values in your performance tests. If your tests rely on API tokens, credentials, or any other confidential data, you no longer need to hardcode them into your scripts or pass them around manually.
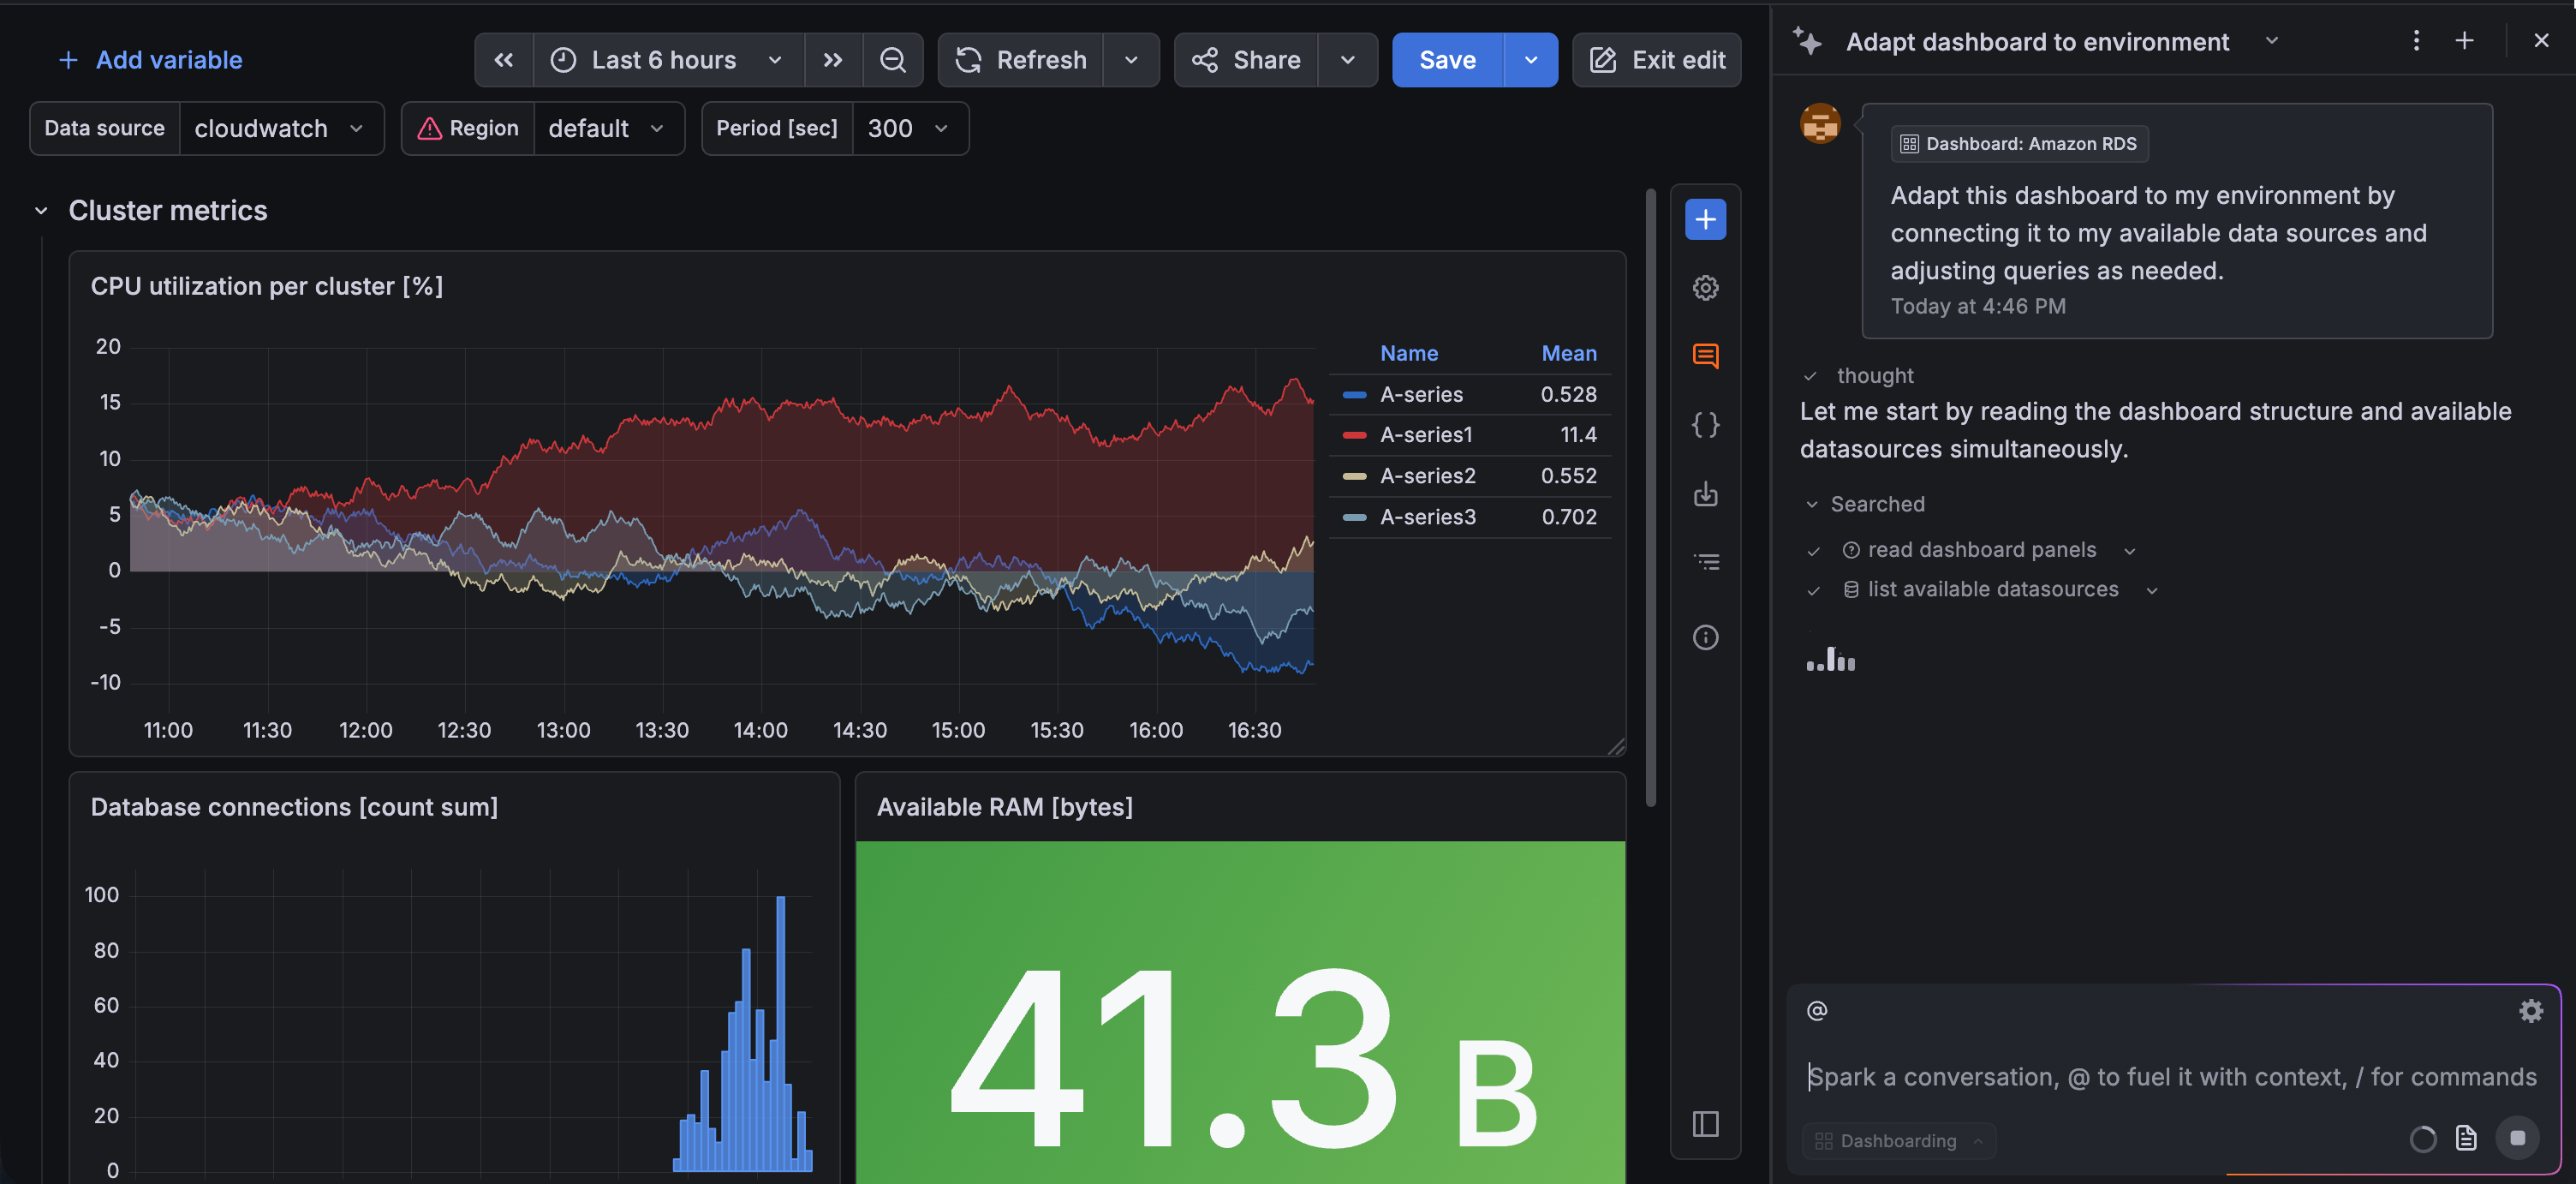
You can now customize suggested dashboards directly with Grafana Assistant, making it easier to turn recommendations into dashboards tailored to your environment.
When you build a dashboard from a data source, you’ll see a Customize with Assistant option when you hover your cursor over a suggestion. This launches Grafana Assistant with a preconfigured prompt that guides you through adapting the selected dashboard:
As Grafana evolves into a multi-tenant architecture, keeping the operational quality high requires predictable performances. For this reasons we are introducing limits to the number of dashboards and folders that can be created in each Grafana stack. Specifically, we are introducing: