What's new from Grafana Labs
Grafana Labs products, projects, and features can go through multiple release stages before becoming generally available. These stages in the release life cycle can present varying degrees of stability and support. For more information, refer to release life cycle for Grafana Labs.
Loading...
Area of interest:
Cloud availability:
Cloud editions:
Self-managed availability:
Self-managed editions:
No results found. Please adjust your filters or search criteria.
There was an error with your request.
Adaptive Logs Drop rules allow you precisely define noisy or wasteful logs to drop, and can be used in addition to our own optimization recommendations. Use cases for drop rules include filtering out debug logs, dropping health check log lines, or downsampling in non-production environments.
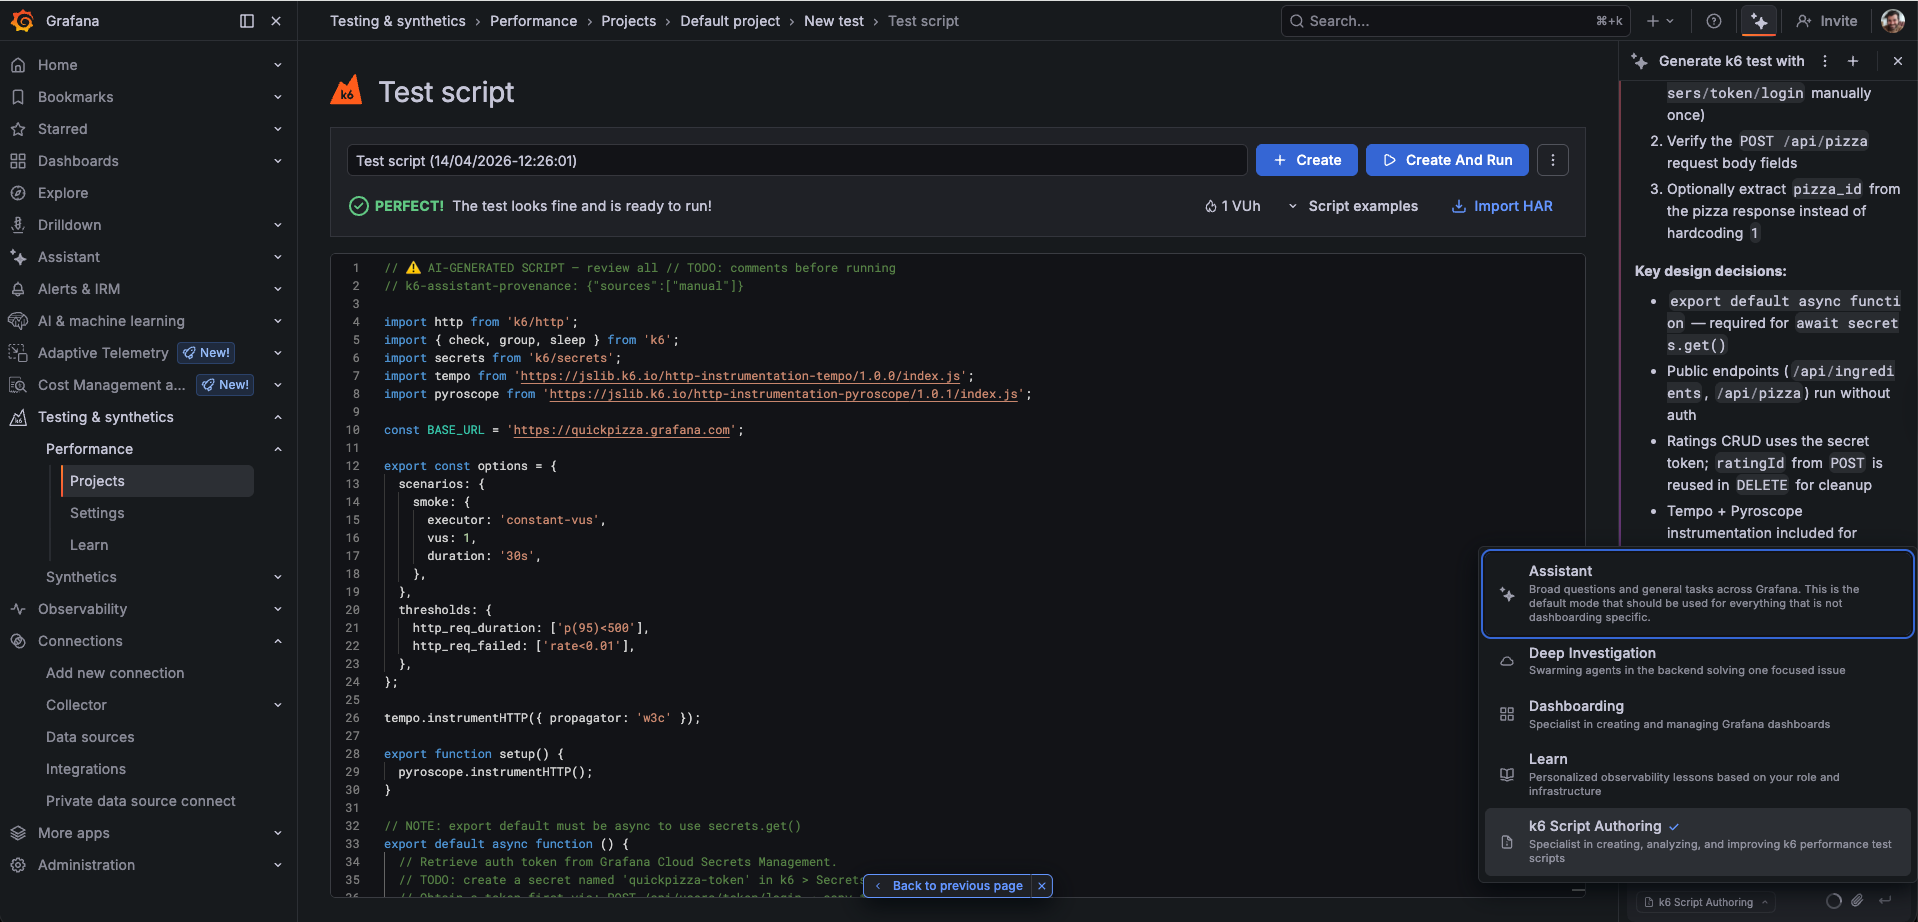
Writing a solid k6 performance test still means juggling URLs, VU counts, checks, thresholds, and how metrics will look in Grafana after the run. It is easy to get stuck on a blank script or to ship something that runs locally but does not match how your service actually behaves in production.
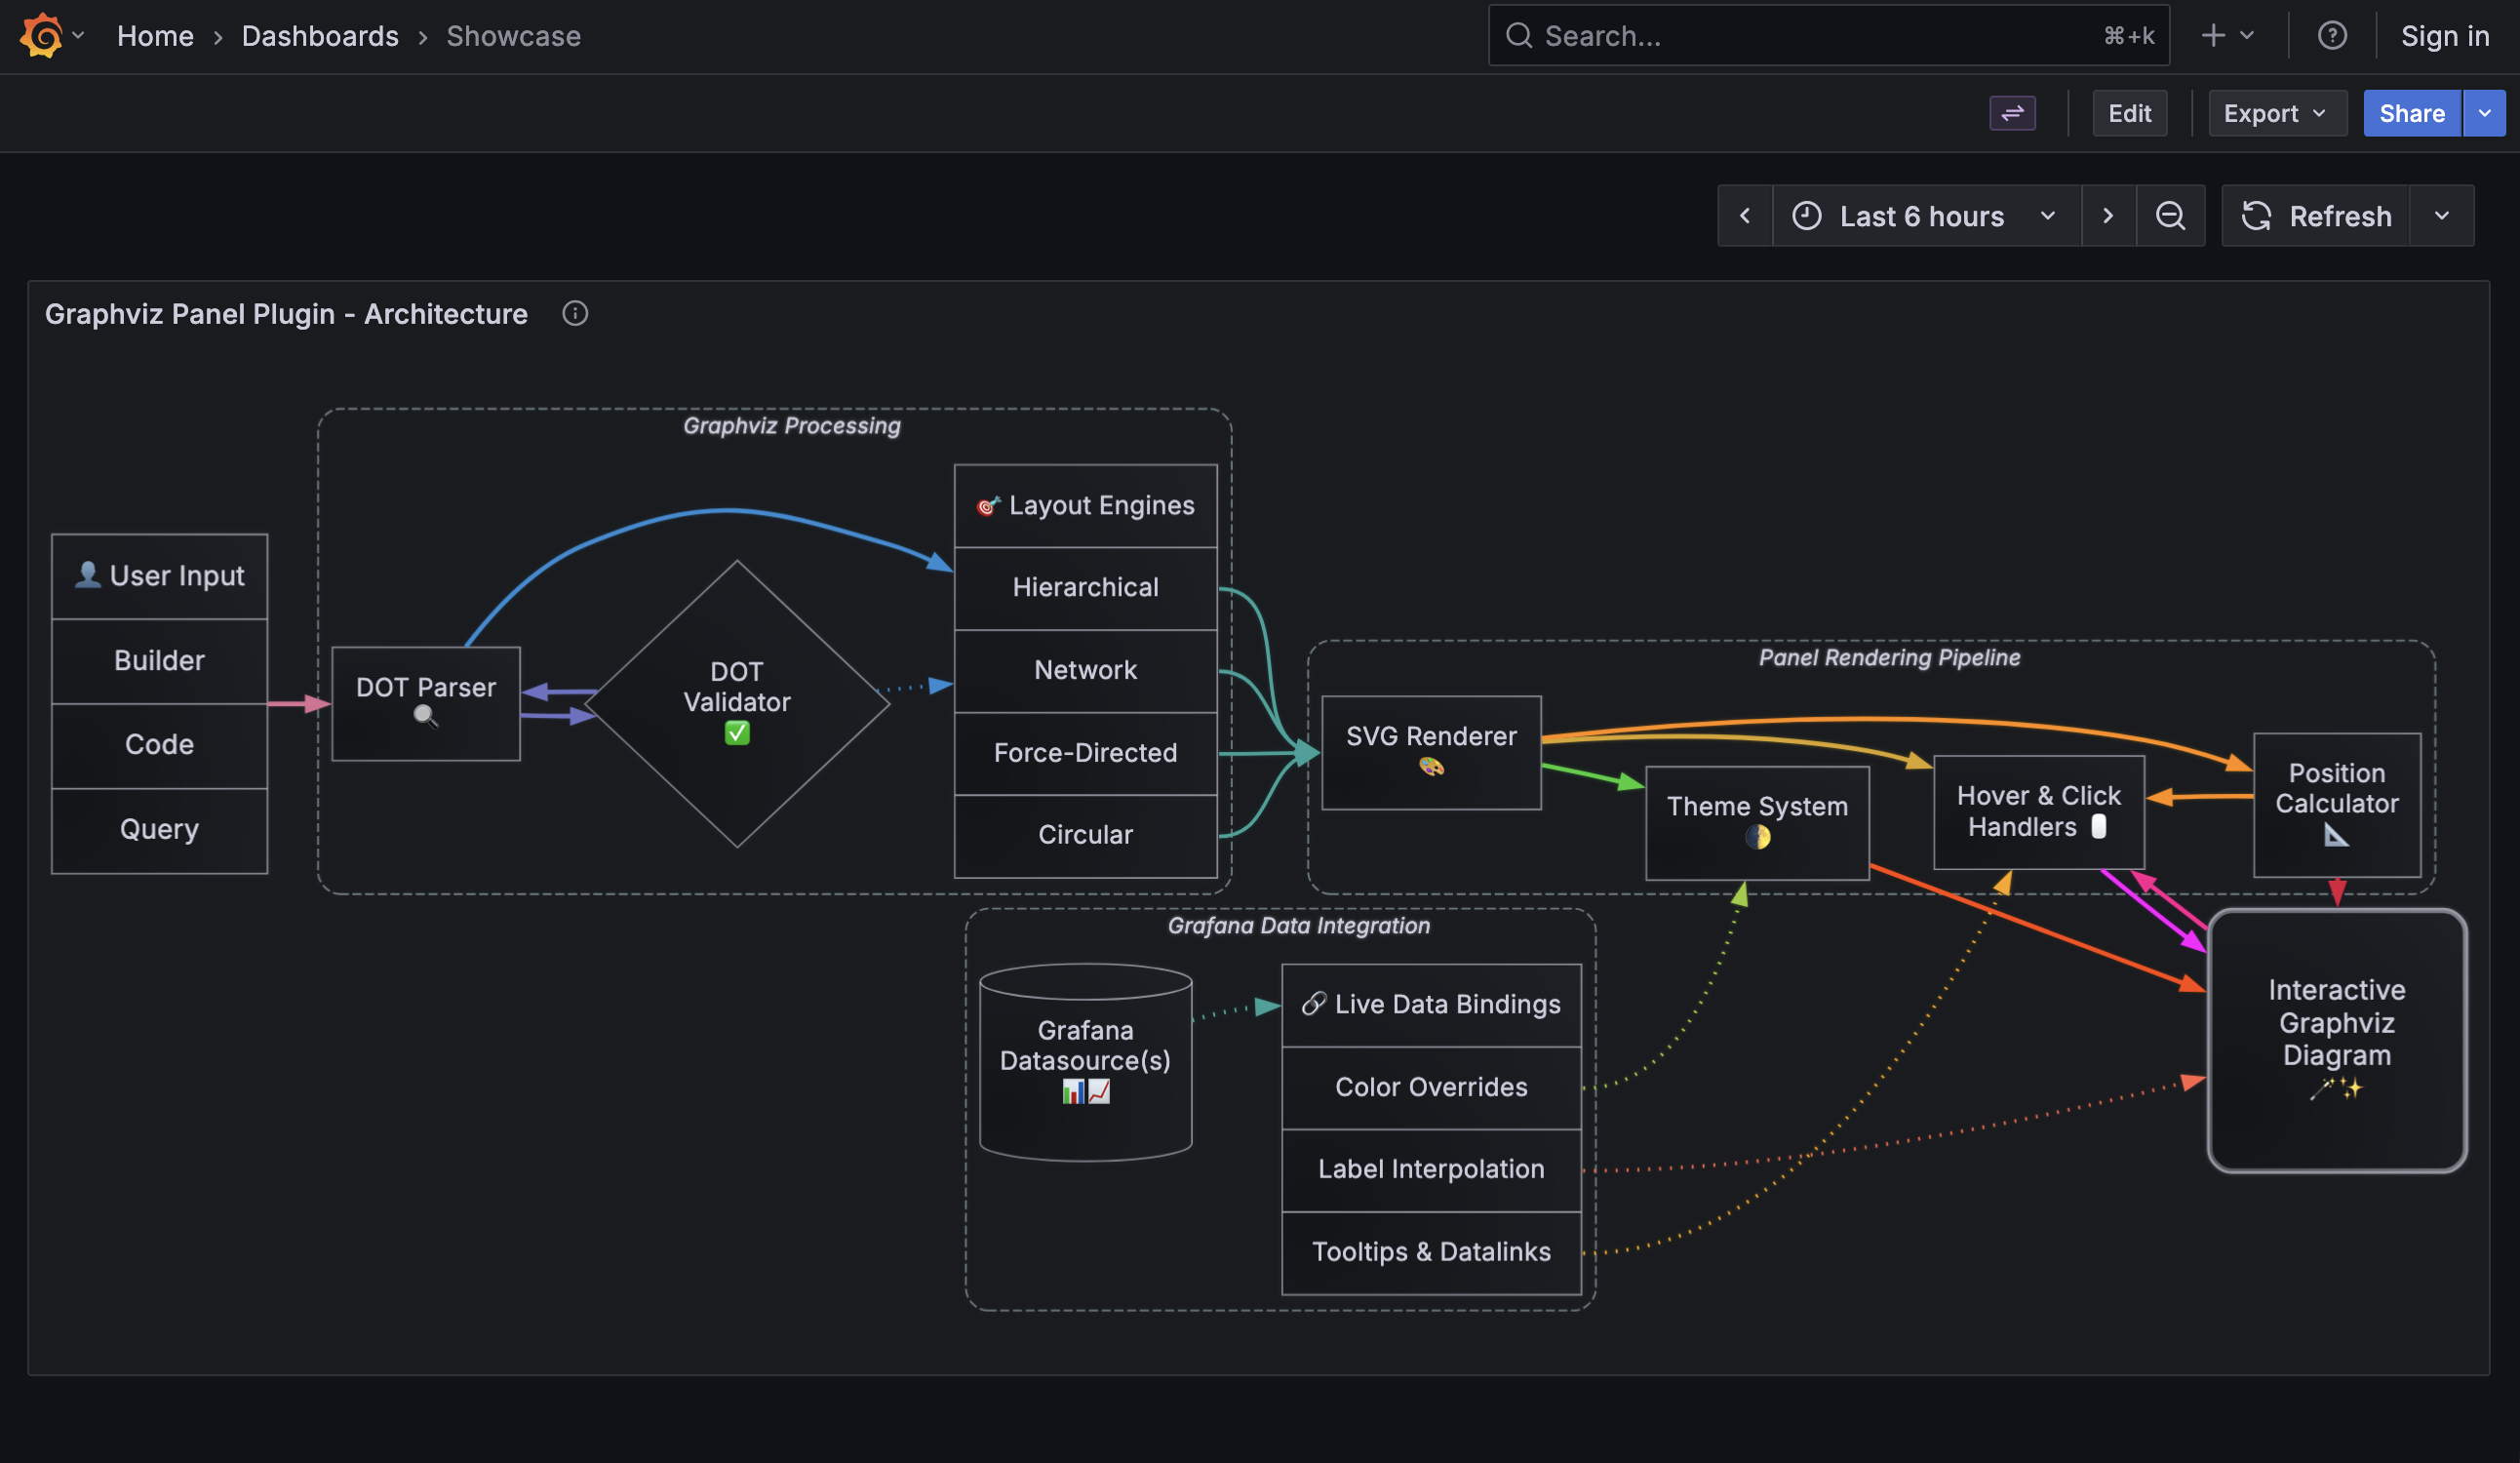
The new Graphviz panel plugin lets you define interactive diagrams in the Graphviz DOT language, and map live data to them from any data source.
Go beyond the visual query builder in Elasticsearch with a new raw query editor and support for two query languages: Elasticsearch Query DSL and ES|QL.
Grafana v13.0 upgrades the core application from React 18 to React 19. The SceneViewer panel in the IoT TwinMaker app (grafana-iot-twinmaker-app) depends on React APIs removed in React 19 and will fail to render after upgrading.
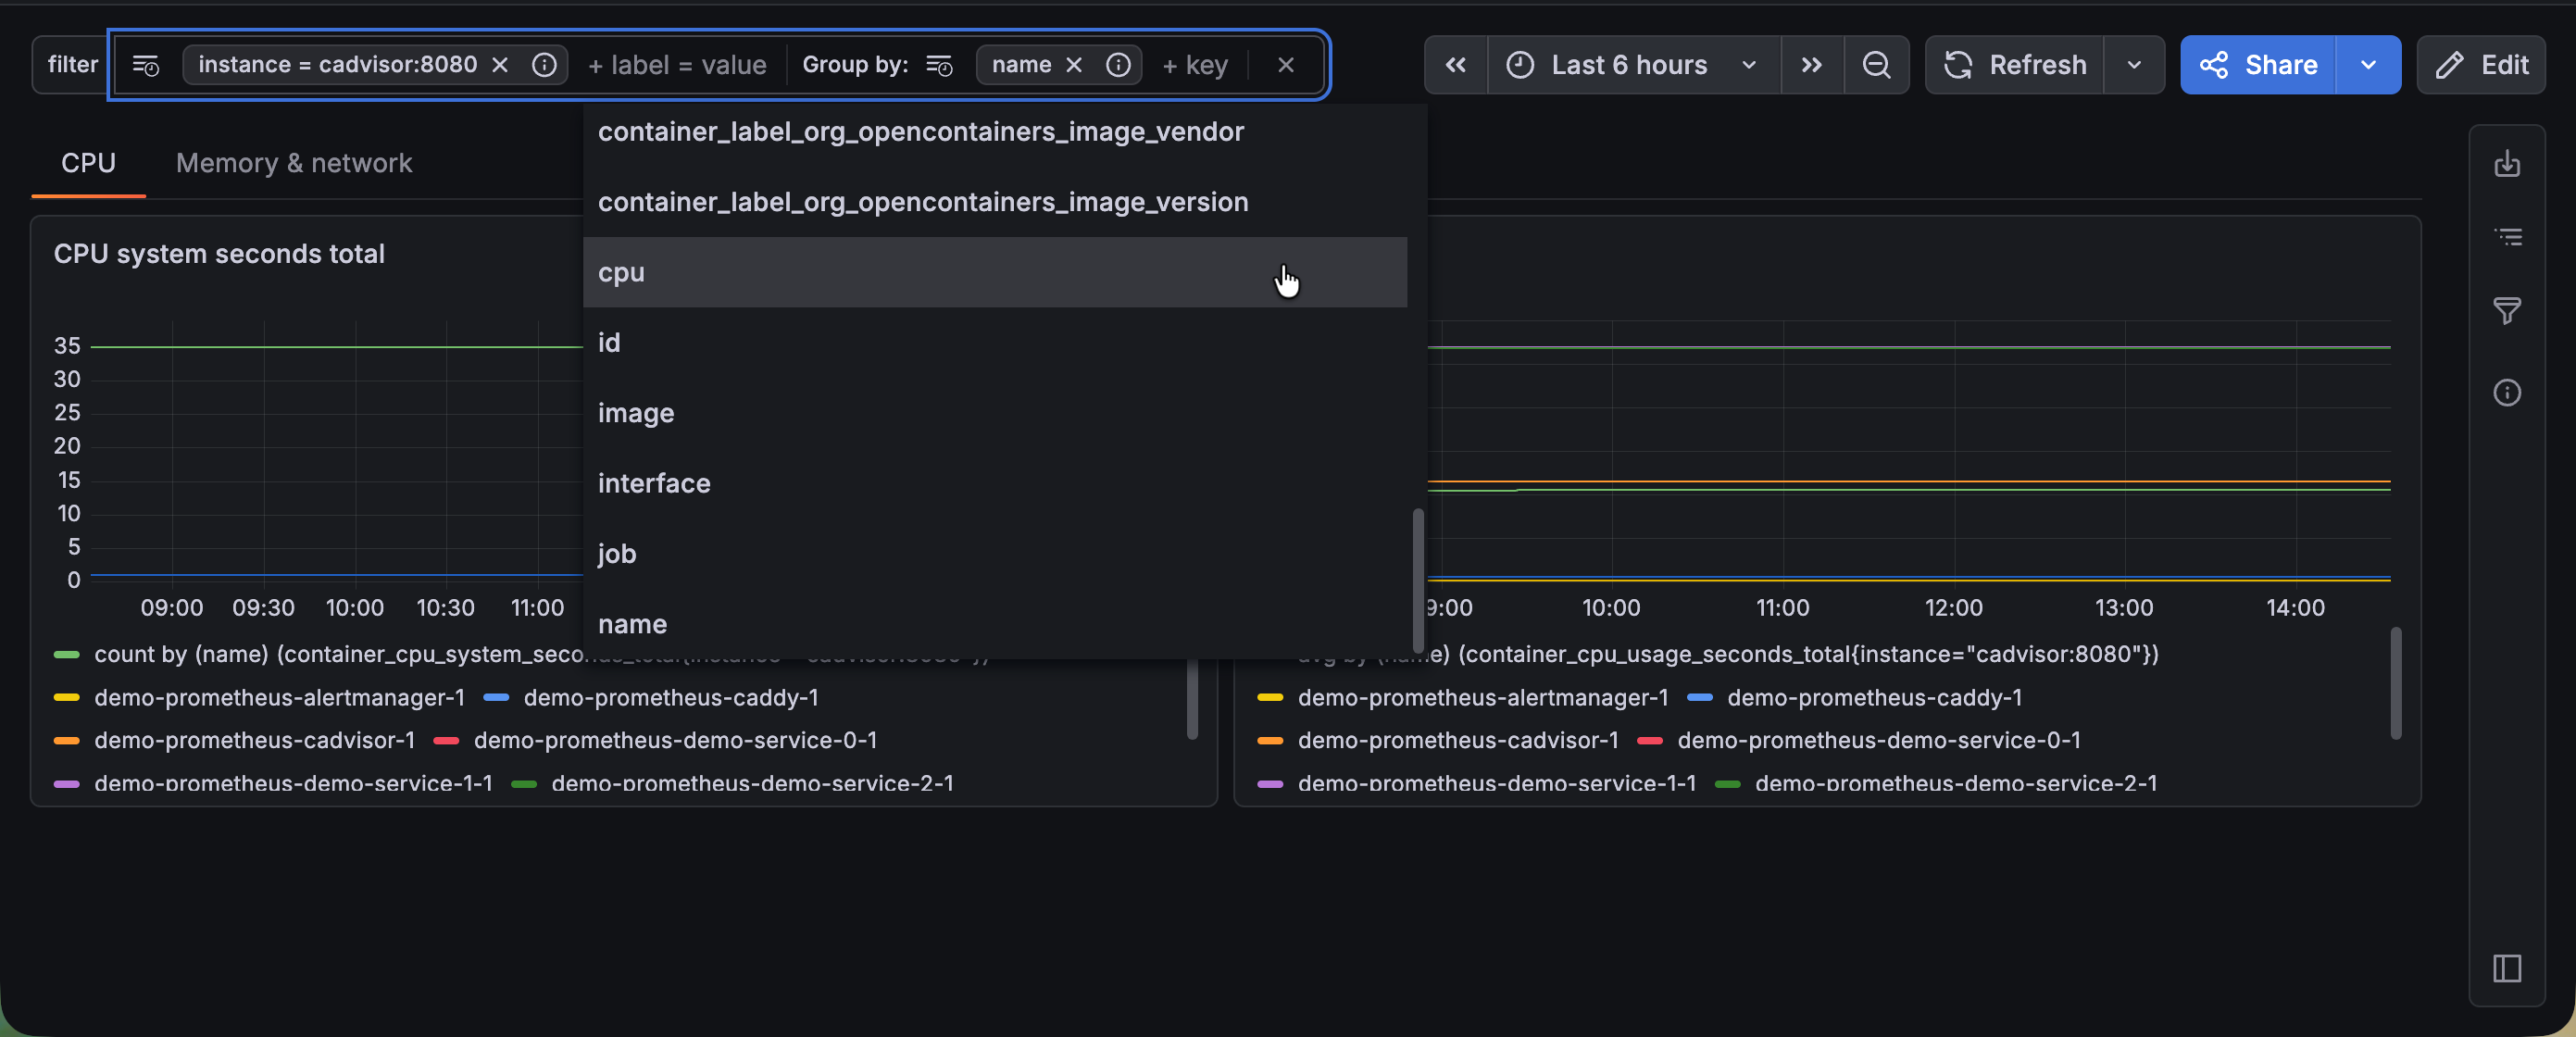
Drilling down into your data across a dashboard has traditionally meant working with basic filter controls, re-entering the same filters you used yesterday, and losing track of which filters are active when many are applied. Introducing the new Filter and Group by dashboard control to tackle all of these friction points and make dashboard exploration faster and more intuitive.
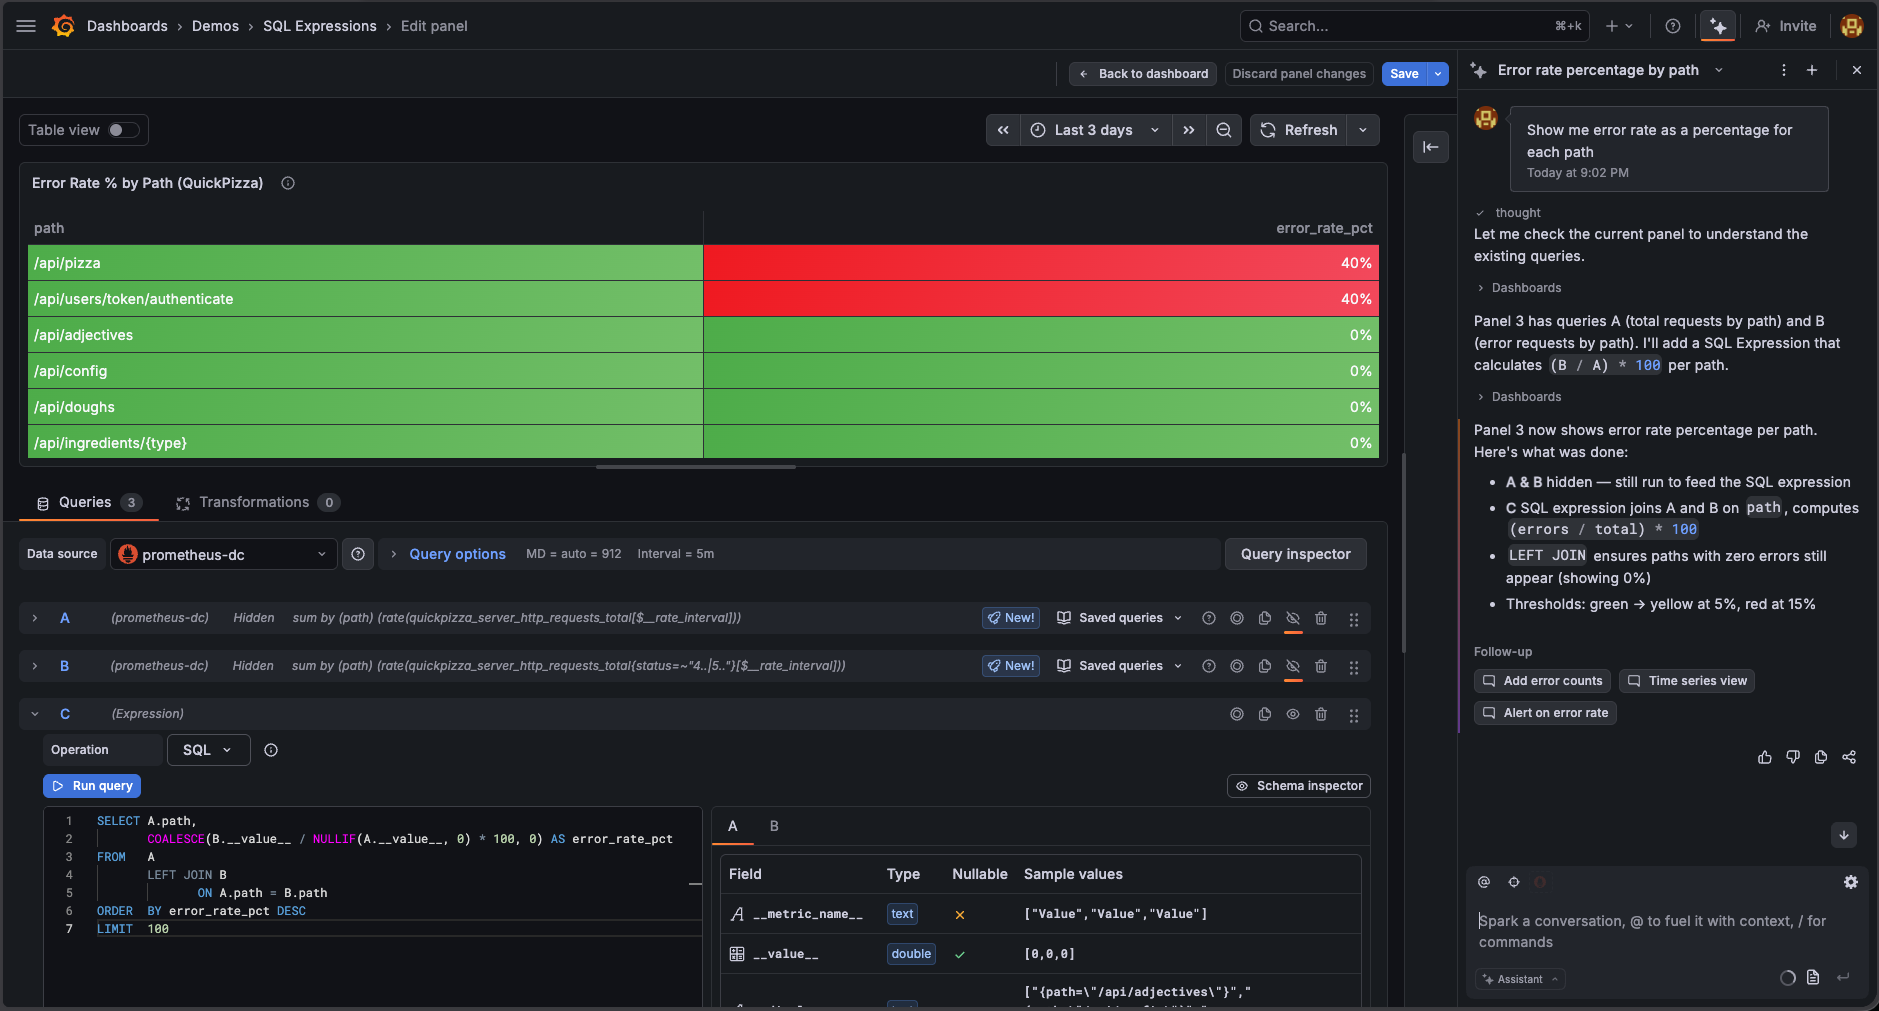
SQL Expressions let you combine and transform data across multiple queries using familiar SQL-joining results, computing ratios, and filtering before aggregating. But to use it, you had to know the feature existed, learn that your query names become table names, and get the MySQL-dialect syntax right yourself.
In Grafana 12.2.0, we introduced two new settings for controlling audit log emission for data source queries: log_datasource_query_request_body and log_datasource_query_response_body, which logs the request and response body payloads respectively.
Styling panels in Grafana used to require a lot of manual work: editing each panel individually, or duplicating one just to reuse its look and then swapping out the query. With the new copy-paste styles feature, you can copy the styling from one panel and apply it to another in just a couple of clicks.
Data source APIs that referenced data sources using a numeric id were deprecated in Grafana v9.0 in favor of APIs that reference data sources using a uid instead. In Grafana v13.0, these deprecated APIs are disabled by default.
Grafana Advisor is now generally available in Grafana v13.0.
You can use Advisor to uncover issues affecting the health of your Grafana instances, such as:
- Data sources with a failing health check that will result in failed queries
- Outdated plugins, which might be insecure or lacking the latest fixes and features
- Misconfigured SSO settings
Checks run once a week by default and can be triggered manually from the Advisor home page. You can also configure alerts to inform you when new issues arise.
The following Prometheus metrics are now deprecated in Grafana v13, and will be removed in a future release:
go_sql_stats_connections_max_opengo_sql_stats_connections_opengo_sql_stats_connections_in_usego_sql_stats_connections_idlego_sql_stats_connections_waited_forgo_sql_stats_connections_blocked_secondsgo_sql_stats_connections_closed_max_idlego_sql_stats_connections_closed_max_lifetimego_sql_stats_connections_closed_max_idle_timegrafana_database_conn_max_opengrafana_database_conn_opengrafana_database_conn_in_usegrafana_database_conn_idlegrafana_database_conn_wait_count_totalgrafana_database_conn_wait_duration_secondsgrafana_database_conn_max_idle_closed_totalgrafana_database_conn_max_idle_closed_secondsgrafana_database_conn_max_lifetime_closed_total
They are replaced by the following metrics, which provide the exact same data:
go_sql_max_open_connectionsgo_sql_open_connectionsgo_sql_in_use_connectionsgo_sql_idle_connectionsgo_sql_wait_count_totalgo_sql_wait_duration_seconds_totalgo_sql_max_idle_closed_totalgo_sql_max_idle_time_closed_totalgo_sql_max_lifetime_closed_total
Previously, the enable_gzip configuration option in the [server] section of the Grafana configuration file, which enables HTTP compression, was disabled by default with the recommendation that most users manually enable it. Starting in Grafana v13.0, this setting is enabled by default.
In Grafana v13.0, we’re removing several components deprecated since 2023 from the @grafana/ui package:
GraphGraphWithLegendGraphContextMenuGraphContextMenuHeadergraphTimeFormatgraphTickFormatterGraphSeriesTogglerGraphSeriesTogglerAPI
We’re also removing one component deprecated since January 2026: