What's new from Grafana Labs
Grafana Labs products, projects, and features can go through multiple release stages before becoming generally available. These stages in the release life cycle can present varying degrees of stability and support. For more information, refer to release life cycle for Grafana Labs.
Loading...
Area of interest:
Cloud availability:
Cloud editions:
Self-managed availability:
Self-managed editions:
No results found. Please adjust your filters or search criteria.
There was an error with your request.
AI coding assistants and LLM workflows work best when they can pull in clean, structured context—but until now, getting Grafana documentation into your prompt meant scraping HTML and stripping out navigation, headers, and styling. No more.
The legacy Prometheus Alertmanager built-in UI is no longer available in Grafana Cloud. This is the old Alertmanager web interface, served per cluster at alertmanager-<cluster>.grafana.net and reached through a separate OAuth login (its URLs contain a /#/ fragment, for example /#/alerts).
Cloud Provider Observability now supports enhanced metrics, enabling you to monitor important service insights that aren’t available directly in CloudWatch. New derived metrics for such services as AWS Lambda, DynamoDB, RDS, and ElastiCache provide deeper visibility into resource capacity, usage, and limits—helping you build more informative dashboards and alerts.
Quick filters and grouping are now generally available in Grafana!
The new Filter and Group by dashboard control makes it faster and easier to explore data by combining filtering and grouping in a single, intuitive experience. With default filters, recent filter history, a unified filters overview, and panel-level drilldowns, users can investigate data faster while keeping dashboards clean and easy to navigate.
The Cost Management and Billing app now supports Cost Attribution for Performance Testing!
You can break down Virtual User Hour (VUH) consumption using labels assigned to your k6 projects. This makes it easier to understand and allocate performance testing costs across teams, departments, environments, services, or any other dimension that matters to your organization.
Get started with troubleshooting and problem solving on the Kubernetes Monitoring home page’s **Overview tab**.

The PDC agent now supports a native Go SSH mode, enabled with the -use-gossh flag. This replaces the agent’s reliance on an external OpenSSH process with a direct SSH implementation via Go’s golang.org/x/crypto/ssh library, and brings several improvements:
The table visualization’s nested rows feature has gotten some significant upgrades: a redesigned editor for the Group to nested tables transformation and the ability to apply field overrides to fields inside nested sub-tables.
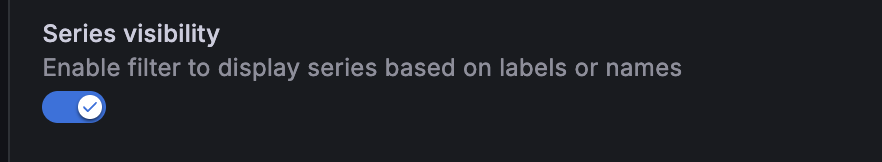
When a time series panel renders a long list of series, finding the ones you care about often means editing the query or scanning a crowded legend. The new Series visibility filter in the time series visualization lets you narrow visible series interactively— by name, by label, or both— without touching the underlying query.
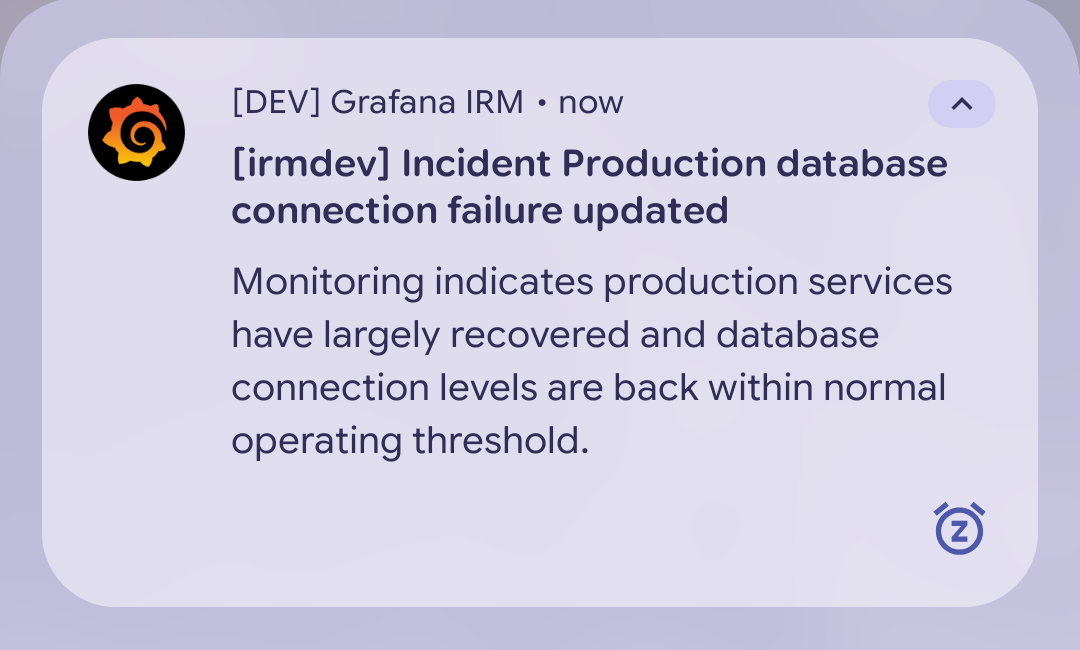
When an incident escalates, every minute matters, and you’re not always at your laptop. The Grafana IRM mobile app already keeps you on top of alerts, schedules, and shift swaps. Now it also notifies you the moment an incident you’re responding to changes.
When you have a role on an incident, you get a push notification when its severity changes (for example, Minor → Critical), its status changes (for example, Investigating → Resolved), or someone posts a status update. Tap the notification to open the incident in the IRM mobile app.
Diagnose slow queries faster with the new Grafana Assistant integration for Database Observability. Instead of manually correlating metrics, wait events, and execution plans, click a button to get a diagnosis grounded in your live Prometheus and Loki data — including specific fix recommendations like index changes or query rewrites tailored to your actual schema and database engine.
New Grafana Cloud stacks now use Grafana-Managed Alerting (GMA) by default — Datasource-Managed Alerting (DMA) is no longer provisioned in new stacks.
Scope: New stacks only. Existing stacks and existing DMA rules are unaffected. This is a provisioning-time change, not a migration.
You can now explore usage and cost data at both the organization and individual stack levels directly within the Cost Management and Billing app!
Key features include:
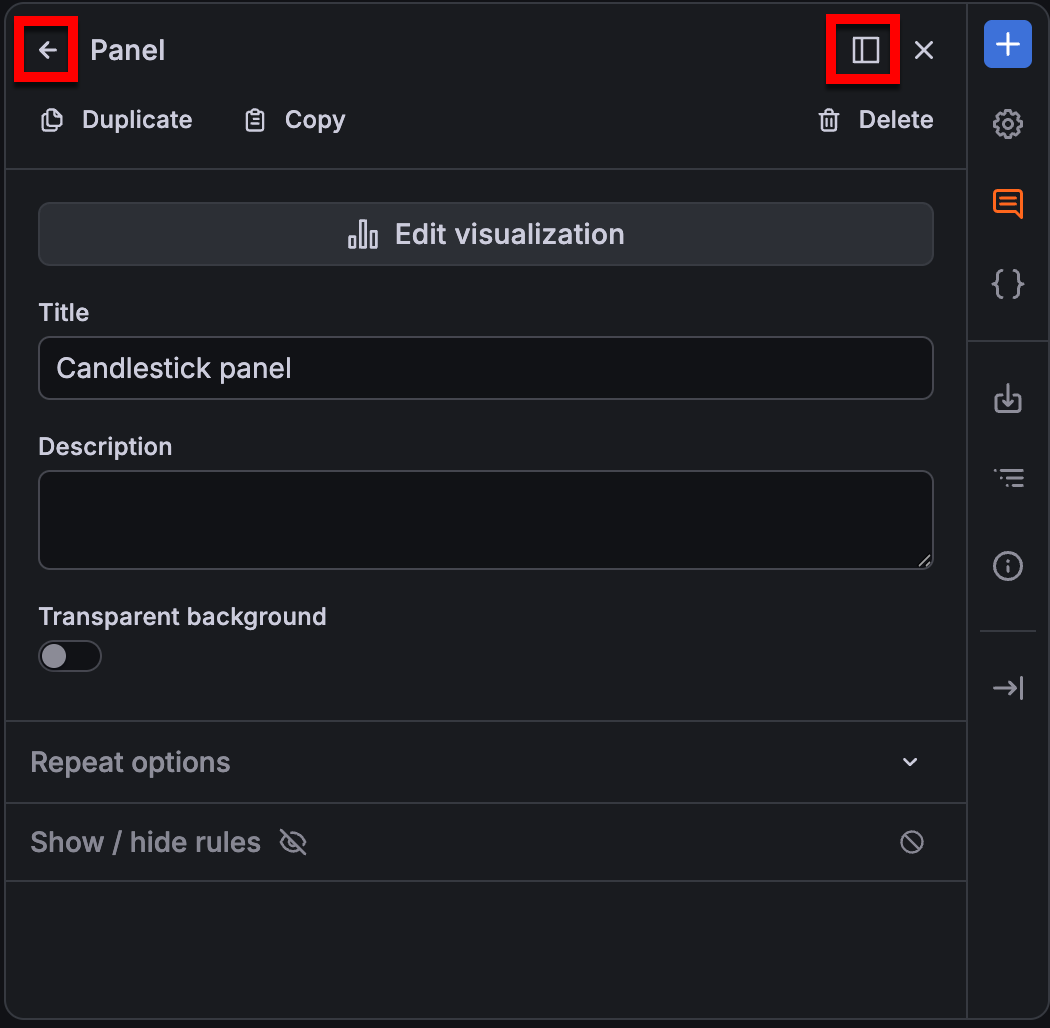
With the new dashboarding experience now generally available, we’ve introduced a series of UI enhancements that make dashboard creation and editing more discoverable, consistent, and easier to navigate.
Grafana 13 tightens RBAC enforcement for custom roles, Terraform-managed roles, and role provisioning. Most users aren’t affected. If you maintain custom RBAC roles, especially roles with data source permissions scoped to specific UIDs, or roles using legacy annotation scopes, review your role definitions now to prevent errors.