
Release date:
What's new in Grafana Cloud
Grafana Cloud
RSS
What’s new in Grafana Cloud
Grafana Labs products, projects, and features can go through multiple release stages before becoming generally available. These stages in the release life cycle can present varying degrees of stability and support. For more information, refer to release life cycle for Grafana Labs.
No results found. Please adjust your filters or search criteria.
Page:
Explore Logs plugin installed by default
Generally AvailableExplore LogsPlugins
Release date: 2024-10-10
Explore Logs is a plugin that lets you automatically visualize and explore your logs without having to write queries. It makes finding spikes in your log volume, filtering your logs and pinpointing problematic log lines a lot easier and more smooth.
While Explore Logs is GA in cloud and installed by default already, with Grafana v11.3.0 it will be automatically installed on your on-prem instance as well. This will let you use Explore Logs alongside Explore Metrics.
Series limit in the Prometheus metrics browser
Generally AvailableMetricsExplore Metrics
Release date: 2024-10-09
Introducing the Series limit in the Metrics browser.
On occasion, a Prometheus instance may contain a metric that has many, many series. When this happens the metrics browser can become slow or break when searching labels on a metric.

k6 scripted checks in Synthetic Monitoring are now generally available
Generally AvailableSynthetic Monitoring
Release date: 2024-10-09
We’re excited to announce that k6 scripted checks in Synthetic Monitoring are now generally available.
k6 scripted checks were released in May 2024 as a public preview, to give you the power and flexibility to define your workflow tests in JavaScript, using the k6 API to efficiently author tests.

k6 browser checks in Synthetic Monitoring are now in public preview
Available in public previewSynthetic Monitoring
Release date: 2024-10-09
We’re excited to announce that k6 browser checks in Synthetic Monitoring are now in public preview.
With k6 browser checks, you can control a headless Chrome browser using a k6 script. Powered by the k6 browser module, browser checks collect frontend Web Vitals metrics, capture custom performance metrics, and simulate user actions like clicking buttons or filling forms. Any scripts you create are also portable between Synthetic Monitoring and Grafana Cloud k6, as they are backed by the same engine, allowing you to reuse your monitoring scripts for performance testing and vice versa.
Role-based access control for notifications in Alerting
Available in public previewAlertingAuthentication and authorization
Release date: 2024-10-07
Manage contact points, mute timings, and notification templates through Role-Based Access Control (RBAC). Choose who can create, edit, and read contact points, mute timings, and notification templates using permissions or fixed roles.
For mute timings and notification templates, you can grant all users all permissions or no permissions. For contact points, you can extend or limit permissions to individual contact points.
Set up LDAP through the UI or API
Available in public previewAuthentication and authorization
Release date: 2024-10-04
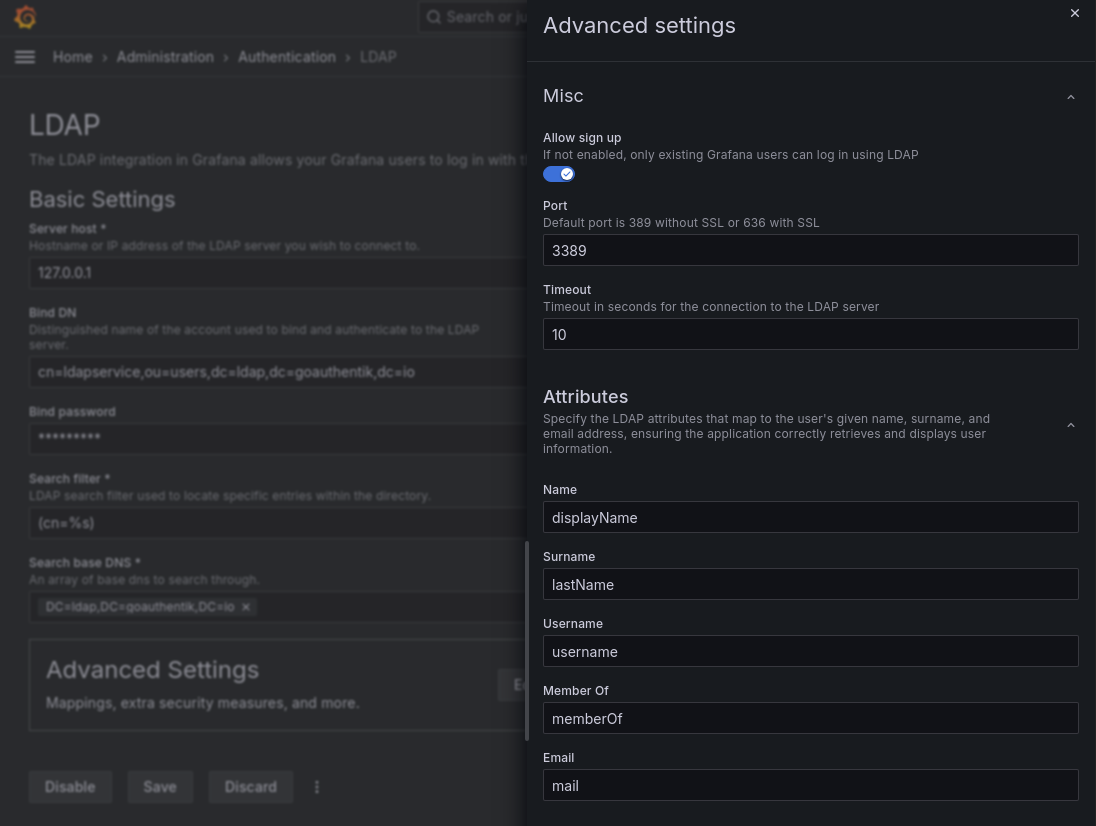
Set up your LDAP server as an Identity Provider from within the UI, or via API.
Managed Plugins
Available in public previewData sourcesPlugins
Release date: 2024-10-03
Grafana Cloud offers a fully managed experience for Grafana. However, for external plugins, customers must manage plugin version updates themselves. This creates extra maintenance overheard - and an unnecessary step in receiving important security patches, bug fixes or new features. This is why we are now introducing a new feature called Managed Plugins.
Managed Plugins replaces the manual update process, and instead automatically updates plugin versions for Grafana Cloud customers, as a more natural SaaS experience. This is available for a growing set of Grafana Labs created data source plugins which can be installed from the Catalog. Plugins built into Grafana already update as part of the Grafana server upgrades.

Recording rules for Grafana-managed alerts
Generally AvailableAlerting
Release date: 2024-09-30
Create recording rules for Grafana-managed alert rules to calculate frequently needed expressions or computationally expensive expressions in advance and save the result as a new set of time series. Querying this new time series is faster, especially for dashboards since they query the same expression every time the dashboards refresh. Previously, this was only available for data-source managed alert rules.
In Grafana OSS and Enterprise, you can create both Grafana-managed and data source-managed recording rules if you enable the grafanaManagedRecordingRules feature flag.
GitHub App authentication for the GitHub data source
Generally AvailableData sourcesPlugins
Release date: 2024-09-30
You can now authenticate the GitHub data source using a GitHub App, providing an alternative to personal access tokens (PATs). GitHub App authentication offers enhanced security by granting more granular permissions, reducing the risk of over-permissioning.
For more information, refer to the GitHub data source documentation for detailed instructions on setting up GitHub App authentication.
Actions for visualizations
ExperimentalDashboards and visualizations
Release date: 2024-09-27
We’ve updated several visualizations so that now you can add actions to them. The panel configuration now includes a Data links and actions section where you can add actions that can each be configured to call an API endpoint.
Also, we’ve also added the ability to control the order in which actions are displayed in the tooltip by dragging and dropping them.
Simplified query section for alert rule creation
Generally AvailableAlerting
Release date: 2024-09-27
Introduces a simplified version of the query and alert conditions step for creating Grafana-managed alert rules. The default options streamline rule creation with a cleaner header and a single query and condition. For more complex rules, switch to advanced options to add multiple queries and expressions.
This feature is rolling out to Grafana Cloud over the next couple of weeks.

k6 browser checks in Synthetic Monitoring are now in private preview
Available in private previewSynthetic Monitoring
Release date: 2024-09-26
We’re excited to announce that k6 browser checks in Synthetic Monitoring are now in private preview.
With k6 browser checks, you can control a headless Chrome browser using a k6 script. Powered by the k6 browser module, browser checks collect frontend Web Vitals metrics, capture custom performance metrics, and simulate user actions like clicking buttons or filling forms. Any scripts you create are also portable between Synthetic Monitoring and Grafana Cloud k6, as they are backed by the same engine, allowing you to reuse your monitoring scripts for performance testing and vice versa.

Redesigned sharing experience in Dashboards
Generally AvailableDashboards and visualizations
Release date: 2024-09-25
Introducing a redesigned sharing experience in Dashboards! The redesigned sharing model is leaner, easier to navigate, and more focused on what you want to do.
Previously, the way you shared dashboards could be confusing, with various options like Link, Snapshot, Export, PDF, Report, and Public Dashboard all in one dialog box. The redesigned experience features a more visible and accessible Share button, options grouped based on common user needs, and a new Export option.

Generally Available
Release date: 2024-09-25
We’ve renamed the Public dashboards feature, Shared dashboards. This renaming is part of our overall redesign of dashboard sharing and aims to better align externally shared dashboards with other dashboard sharing options.
The feature still functions the same way, but the configuration options that were previously part of public dashboards are now found in the Share externally option in the Share drop-down list.
OpenID Connect Discovery URL for Generic OAuth
Generally AvailableAuthentication and authorization
Release date: 2024-09-24
The OpenID Connect Discovery URL is available in the Generic OAuth form. The info extracted from this URL will be used to populate the Auth URL, Token URL and API URL fields.
Was this page helpful?
Related resources from Grafana Labs
60 min

Getting started with managing your metrics, logs, and traces using Grafana
In this webinar, we’ll demo how to get started using the LGTM Stack: Loki for logs, Grafana for visualization, Tempo for traces, and Mimir for metrics.
60 min

Intro to Kubernetes monitoring in Grafana Cloud
In this webinar you’ll learn how Grafana offers developers and SREs a simple and quick-to-value solution for monitoring their Kubernetes infrastructure.
60 min

Building advanced Grafana dashboards
In this webinar, we’ll demo how to build and format Grafana dashboards.