
Release date:
What's new in Grafana Cloud
Grafana Cloud
RSS
What’s new in Grafana Cloud
Grafana Labs products, projects, and features can go through multiple release stages before becoming generally available. These stages in the release life cycle can present varying degrees of stability and support. For more information, refer to release life cycle for Grafana Labs.
No results found. Please adjust your filters or search criteria.
Page:
AWS scrape jobs as code: Streamlined management with Terraform
Generally AvailableInfrastructure Observability
Release date: 2024-11-22
With the AWS CloudWatch integration, you can scrape your CloudWatch metrics and logs and forward them to Grafana Cloud for a centralized place to monitor and alert on your infrastructure and large scale applications. However, handling AWS scrape jobs at scale can be tedious. Now, manage them as code with Terraform in Grafana Cloud! Scale smarter—quickly create, update, or delete scrape jobs with ease and precision.
Query acceleration for Grafana Cloud Logs
Available in public previewLogs
Release date: 2024-11-22
Have you ever had a Grafana Cloud Logs query time out because it tried to process too much data? Query acceleration leverages bloom filters to quickly filter on structured metadata, showing you results faster and making timeouts less likely.
Example use cases where query acceleration are helpful include support-type queries, where you may be looking for an order id, phone number, or similar higher cardinality key value pair. Query acceleration also works well out-of-the-box with OpenTelemetry logs. If you’re not using OpenTelemetry, you can still send structured metadata using Grafana Alloy’s native Loki pipelines.
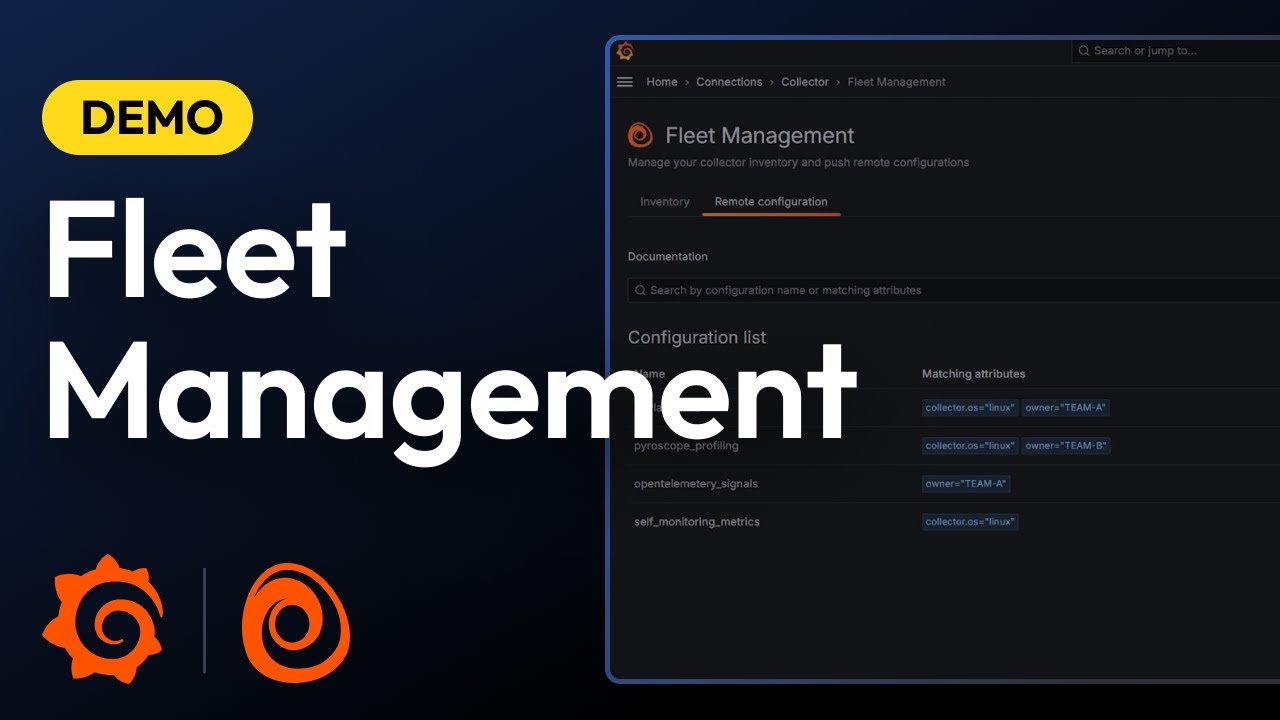
Fleet Management
Available in public previewAlloy
Release date: 2024-11-21
Introducing Fleet Management in Grafana Cloud
Managing observability workloads can quickly overwhelm even the most experienced admin. Whether you’re dealing with complex configurations, rising costs, or just trying to keep tabs on every collector, you need everything in one place to make sense of it all. That’s why we’re excited to announce the Public Preview of Fleet Management in Grafana Cloud—a powerful new way to monitor and manage observability collectors efficiently, regardless of scale. With Fleet Management, you can roll out configurations remotely, monitor collector health across all deployments, and control cost simply by activating or deactivating pipelines as needed. Get started today!
New regular expression option for Extract fields transformation
Generally AvailableDashboards and visualizations
Release date: 2024-11-19
We’ve updated the Extract fields transformation with an additional RegExp format option you can use to perform more advanced parsing of the selected field, such as extracting parts of strings or splitting content into multiple fields using named capturing groups like /(?<NewField>.*)/.

Simplified alert rule creation: alert rule organization
Generally AvailableAlerting
Release date: 2024-11-18
This new feature groups labels and folders in one step so that you can more easily organize your Grafana-managed alert rules.

Private Data Source Connect (PDC) Support for AWS Data Sources
Generally AvailableData sources
Release date: 2024-11-15
Private Data Source Connect (PDC) is now supported across more AWS data source plugins - including:
- AWS Athena (Version 2.19.0)
- AWS Aurora (Version 0.4.0)
- OpenSearch (Version 2.21.0)
- AWS Redshift (Version 1.20.0)
- AWS X-Ray (Version 2.13.0)
With PDC, you can establish a private, secured connection between a Grafana Cloud instance, or stack, and data sources secured within a private network. Take advantage of the convenience and power of Grafana Cloud - even if your cluster is hosted in a Virtual Private Cloud (VPC) or another private network.
Find the full list of supported data source plugins here.
Reporting theme options
Generally AvailableDashboards and visualizations
Release date: 2024-11-14
Choose the light or dark theme for PDF attachments and embedded dashboard images in Reports. The selected theme options are applied to PDFs and embedded images for all reports within your organization.
The Report branding section of the settings page is now called Attachment settings for clarity.

Time series macro support in visual query builder for SQL data sources
Generally AvailableData sources
Release date: 2024-11-08
It is now possible to create time series queries from the query builder in the following data sources. MySQL, PostgreSQL, MS SQL. Use the Data operations drop-down to select a macro like $__timeGroup or $__timeGroupAlias.
Select a time column from the Column drop-down and a time interval from the Interval drop-down to create a time-series query.

Introducing Enhanced Push Notification Settings in v2.2.0 [Android]
Generally AvailableOnCallIRM
Release date: 2024-11-08
We’ve introduced a new section under Settings > Push Notifications to ensure reliable delivery of notifications by actively prompting users to disable battery optimization and inactivity restrictions on Android devices.
Here’s what’s new:
![Introducing Enhanced Push Notification Settings in v2.2.0 [Android]](/static/img/oncall/push0_s.png?w=1500)
Eight synthetics probe locations being replaced in February 2025
Generally AvailableSynthetic Monitoring
Release date: 2024-11-07
Starting in early 2025 we will roll out eight new public probe locations running in AWS: Stockholm, Zurich, Spain, UAE, Montreal, Calgary, Hyderabad, and Indonesia.
These eight new regions will replace the remaining eight locations running out of Linode and Digital Ocean: Atlanta, Dallas, Newark, Toronto, New York, San Francisco, Amsterdam, and Bangalore. These regions are deprecated and will be removed between January 27 and February 14, 2025. Exact dates and times will be posted as maintenance notices on our status page.
Why are we doing this?
Redesigned filters for dashboards
Generally AvailableDashboards and visualizations
Release date: 2024-10-28
We’ve redesigned dashboard filters for an improved filter creation experience!
The redesigned filters are more prominent in the dashboard and filters based on the same ad hoc filter variable are more clearly related. In the new design, you can click anywhere in the filter field to begin creating a one and Grafana automatically detects which part of the filter you’re setting up. It takes fewer clicks to create a filter and the creation process using keyboard strokes is smoother than previously.

The Grafana IRM app: A new era for mobile Incident Response Management
Generally AvailableOnCallIncidentIRM
Release date: 2024-10-24
We’re excited to announce the release of Grafana IRM Mobile, the next evolution of our mobile app which was previously known as Grafana OnCall. This rebrand marks a major step forward in providing teams with a seamless, comprehensive way to manage incidents—all from your mobile device.
Beyond Alerts: Embracing Incidents
While the Grafana OnCall mobile app enabled on-call engineers to never miss an alert and stay on top of their on-call schedules, we heard that you wanted even more power when on the move.
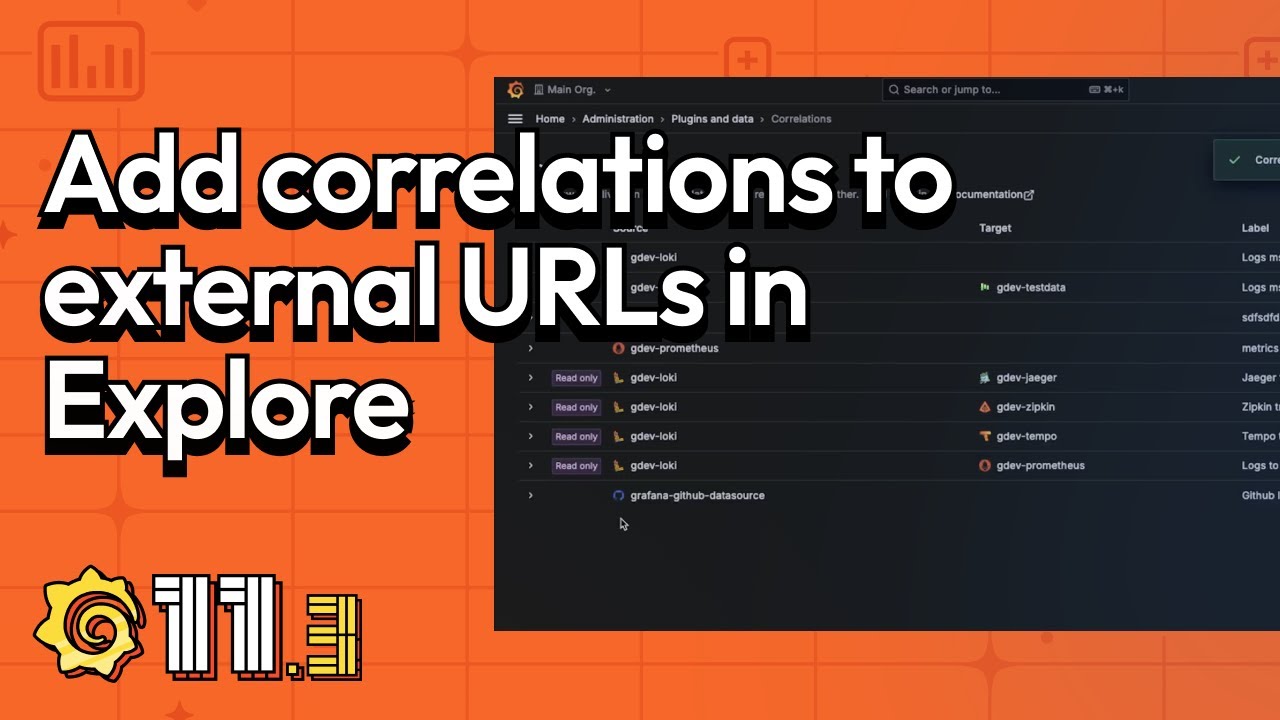
Add correlations to external URLs in Explore
Generally AvailableDashboards and visualizations
Release date: 2024-10-22
Correlations is a feature that allows Grafana users to set up links between their data sources. Previously, the link generated would only be from one query to another—meaning results from a query could only generate links to open a second Explore pane with other query results.
With this feature, users can now link to third party web-based software based on their search results. The format follows the standard Grafana format for using variables.
RBAC for Plugins
Generally AvailableAuthentication and authorizationPlugins
Release date: 2024-10-21
We’re excited to announce that plugins can now leverage Grafana’s role based access control to define their own roles and permissions in order to control access to their routes.
To define roles and their default assignments, plugin developers need to add a roles section to their plugin.json file. Grafana will automatically register these roles and assign them to the corresponding basic roles: Viewer, Editor, Admin, and Grafana Admin.
New escalation step: Declare an incident automatically
Generally AvailableOnCallIncidentIRM
Release date: 2024-10-11
A new escalation step is now available in Grafana OnCall. You can configure your escalation chains to automatically create an incident in Grafana Incident with a specified severity.
If a critical alert group is identified (outside of the default route), and earlier steps in the escalation chain don’t resolve the issue, the chain will now declare an incident as part of the response process.
Was this page helpful?
Related resources from Grafana Labs
60 min

Getting started with managing your metrics, logs, and traces using Grafana
In this webinar, we’ll demo how to get started using the LGTM Stack: Loki for logs, Grafana for visualization, Tempo for traces, and Mimir for metrics.
60 min

Intro to Kubernetes monitoring in Grafana Cloud
In this webinar you’ll learn how Grafana offers developers and SREs a simple and quick-to-value solution for monitoring their Kubernetes infrastructure.
60 min

Building advanced Grafana dashboards
In this webinar, we’ll demo how to build and format Grafana dashboards.