
Release date:
What's new in Grafana Cloud
Grafana Cloud
RSS
What’s new in Grafana Cloud
Grafana Labs products, projects, and features can go through multiple release stages before becoming generally available. These stages in the release life cycle can present varying degrees of stability and support. For more information, refer to release life cycle for Grafana Labs.
No results found. Please adjust your filters or search criteria.
Page:
Improved TraceQL query editor
Generally AvailableTracesDashboards and visualizations
Release date: 2023-10-03
The TraceQL query editor has been improved to facilitate the creation of TraceQL queries. In particular, it now features improved autocompletion, syntax highlighting, and error reporting.
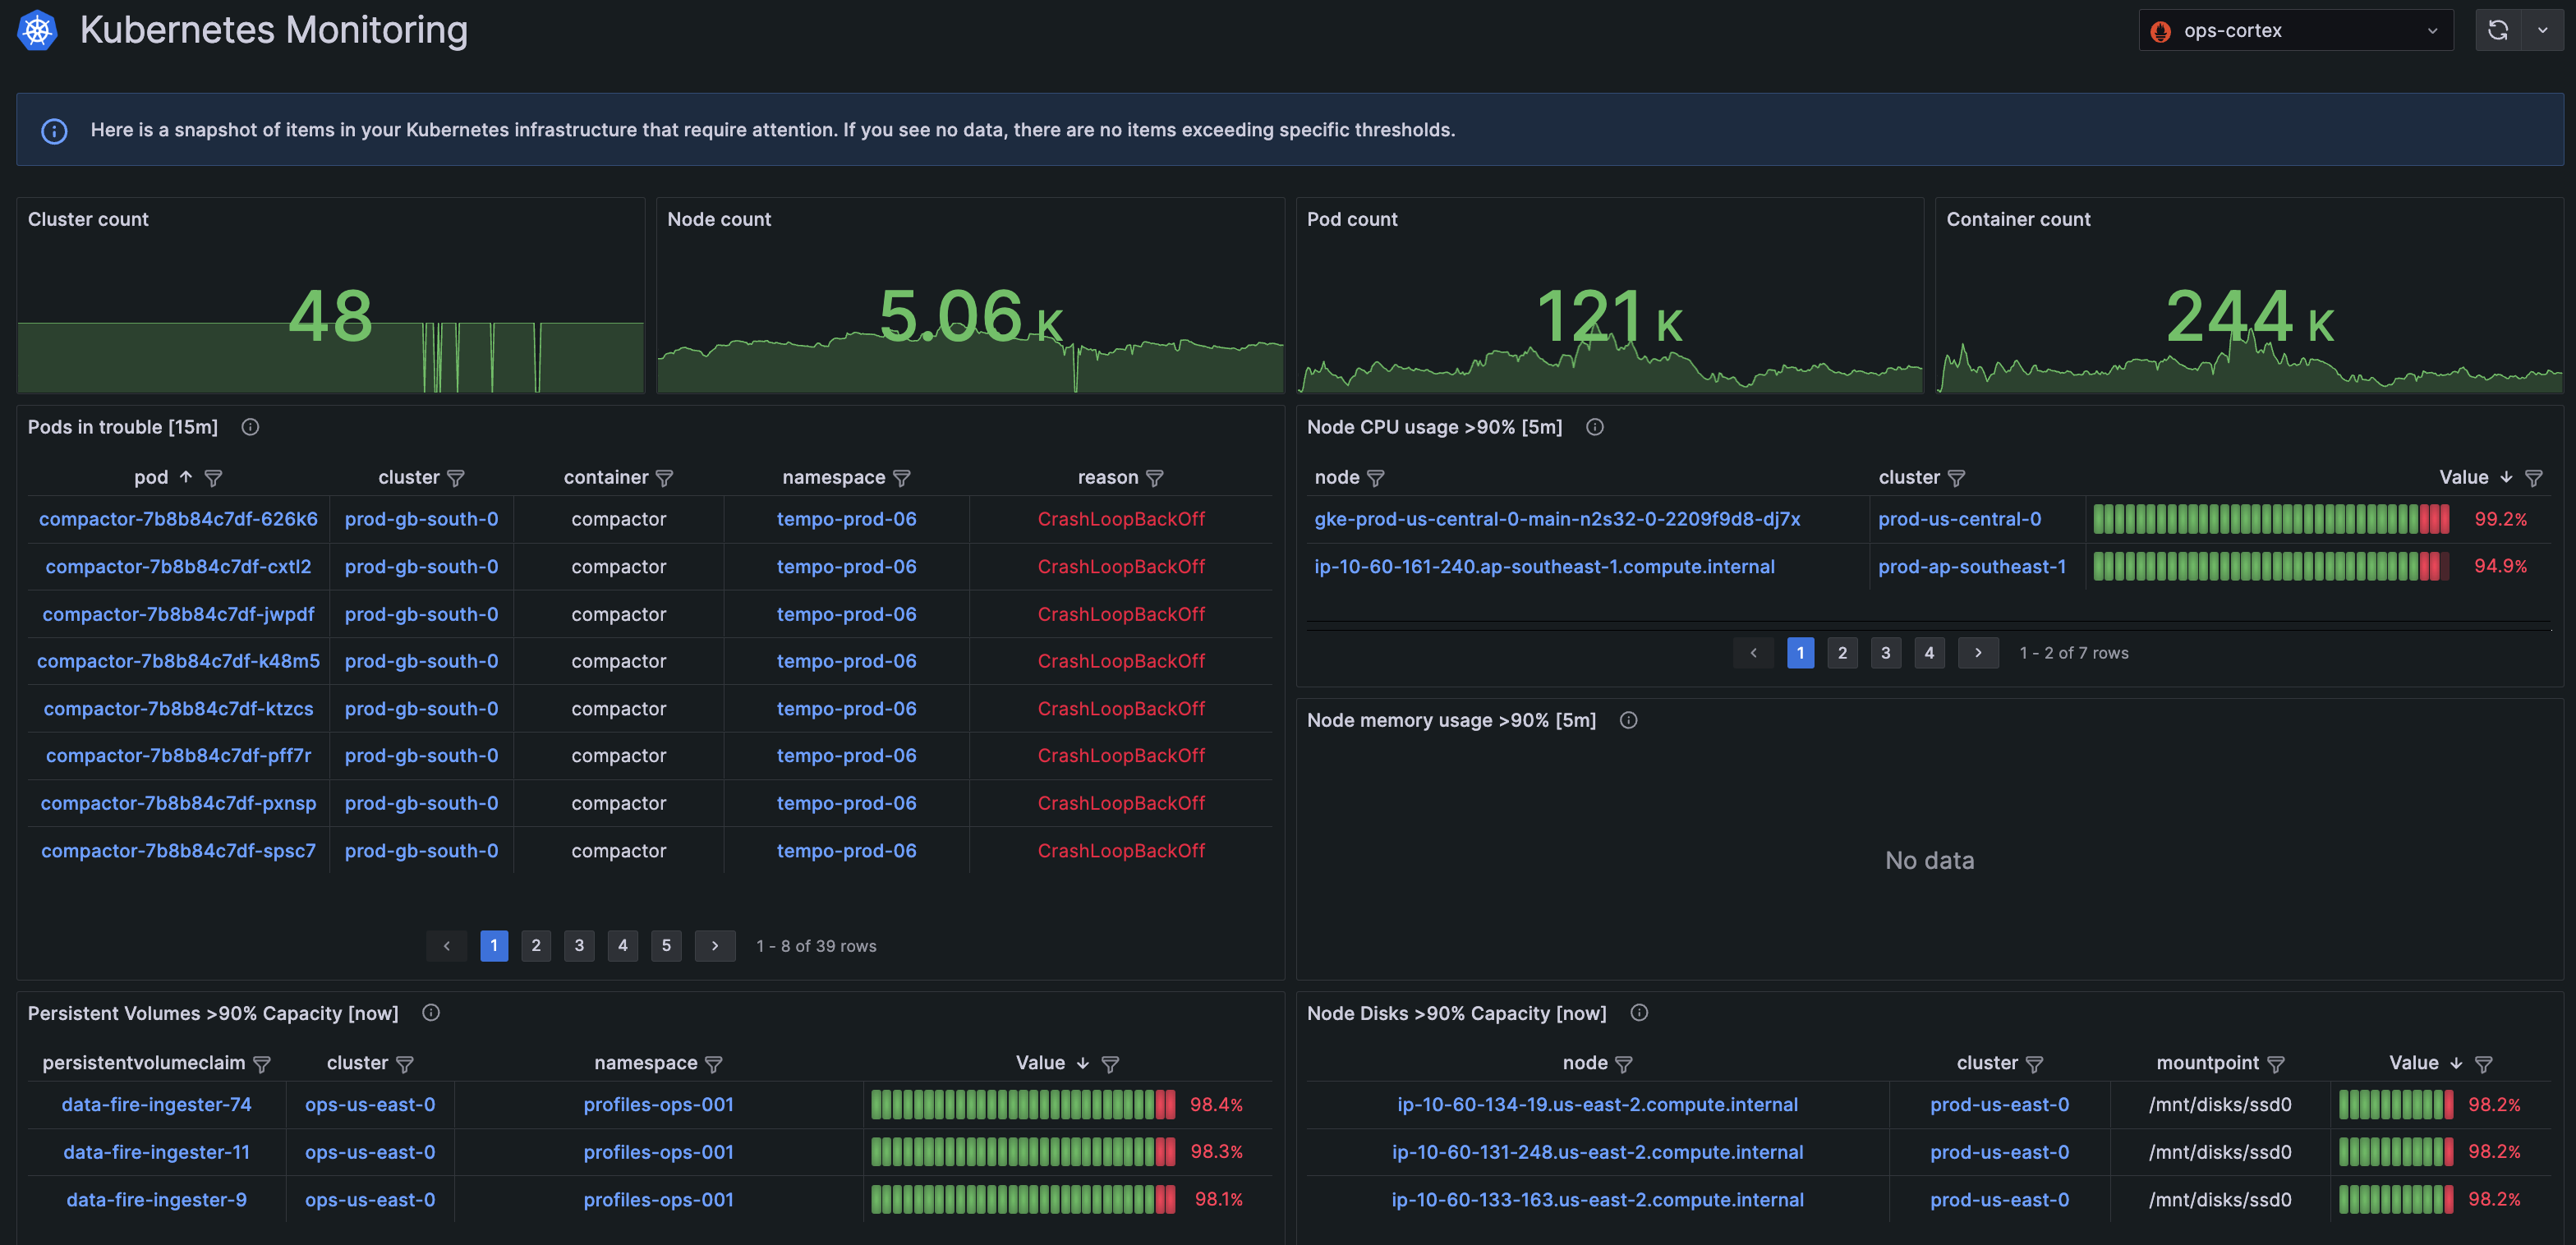
Issues snapshot in Kubernetes Monitoring
Generally AvailableKubernetes Monitoring
Release date: 2023-09-29
To provide quicker identification and troubleshooting, the home page contains a snapshot of issues that reach the following thresholds:
- Pods that have been in a non-running state for more than 15 minutes
- Nodes with CPU usage above 90% for more than five minutes
- Nodes using more than 90% of memory for more than five minutes
- Persistent Volumes with capacity above 90%
- Node disks with capacity above 90%
(Release 1.3.1)
Recorded queries: Record multiple metrics from a single query
Generally AvailableDashboards and visualizations
Release date: 2023-09-29
With recorded queries, a single recorded query can now record multiple metrics.
Tenant database instance name and number for SAP HANA® data source
Generally AvailableData sources
Release date: 2023-09-25
The SAP HANA® data source now supports tenant databases connections by using the database name and/or instance number. For more information, refer to SAP HANA® configuration.
Distributed tracing in Grafana Cloud k6
Generally AvailableK6
Release date: 2023-09-19
You can now use the Grafana Cloud Traces integration with Grafana Cloud k6 to quickly debug failed performance tests and proactively improve application reliability.
Distributed tracing in Grafana Cloud k6 only requires two things:
- An application instrumented for tracing with Grafana Cloud Traces.
- Adding a few lines of code to your existing k6 scripts.
New browse dashboards
Generally AvailableDashboards and visualizations
Release date: 2023-09-19
The new browse dashboards interface features a more compact design, making it easier to navigate, search for, and manage for your folders and dashboards. The new interface also has many performance improvements, especially for instances with a large number of folders and dashboards.
To make using folders easier and more consistent, there is no longer a special General folder. Dashboards without a folder, or dashboards previously in General, are now shown at the root level.
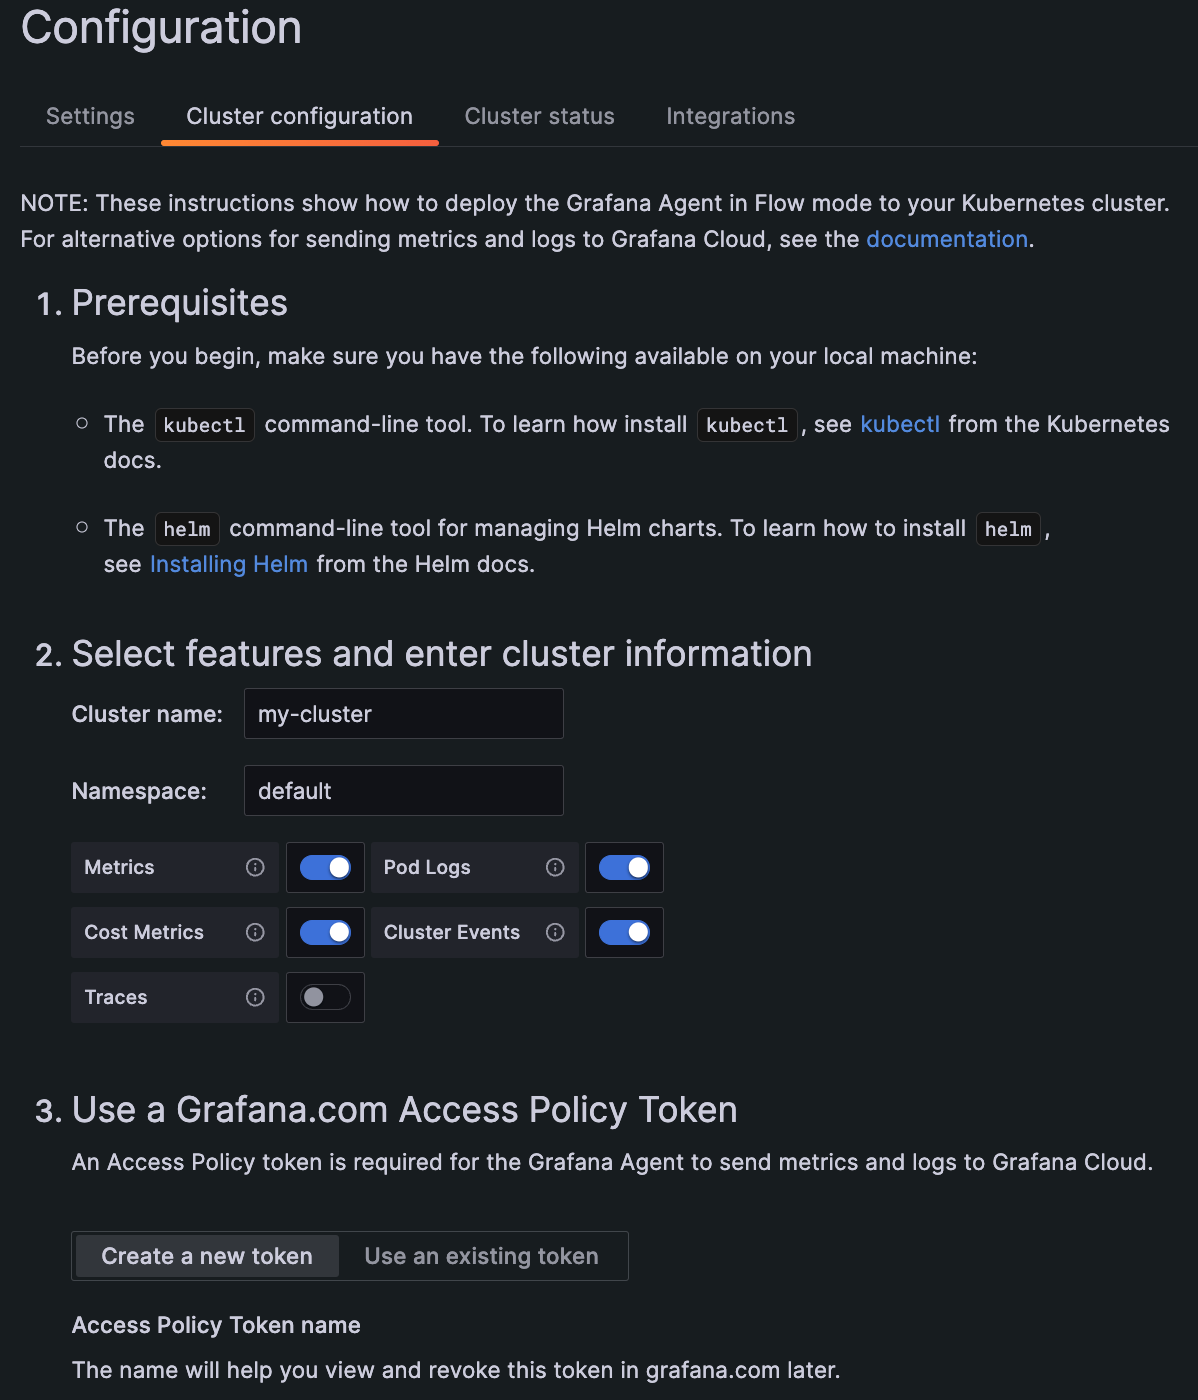
Streamlined configuration of Kubernetes Monitoring
Generally AvailableKubernetes Monitoring
Release date: 2023-09-15
Configure with Grafana Kubernetes Monitoring Helm chart using a streamlined process. With this method, you can set on/off switches to gather metrics, logs, events, traces, and cost metrics. (Release 1.2.0)
Generally AvailableKubernetes Monitoring
Release date: 2023-09-14
You can change the data source you are viewing on the Cost and Efficiency views. (Release 1.2.1)
Kafka integration in Kubernetes Monitoring
Generally AvailableKubernetes Monitoring
Release date: 2023-09-14
The Kafka integration is available for use in Kubernetes Monitoring. (Release 1.3.6)
Predict namespace memory usage in Kubernetes Monitoring
Generally AvailableKubernetes Monitoring
Release date: 2023-09-14
Click Predict Memory usage to predict namespace memory usage on the namespace detail page. (Release 1.2.1)

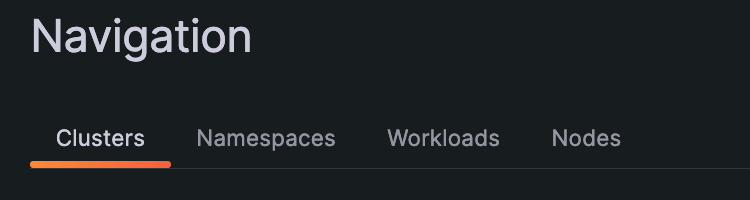
Generally AvailableKubernetes Monitoring
Release date: 2023-09-14
Quickly switch between the Cluster, namespace, workload, and Node views on the Cluster Navigation page using tabs. (Release 1.3.0)
Traces collection with Kubernetes Monitoring
Generally AvailableKubernetes Monitoring
Release date: 2023-09-14
Collect traces when you configure Kubernetes Monitoring, and then use Tempo to create search queries. Refer to Navigate to traces for more information. (Release 1.3.0)
Create correlations for provisioned data sources
Available in public previewDashboards and visualizations
Release date: 2023-09-13
You can now create correlations using either the Administration page or provisioning, regardless of whether a data source was provisioned or not. In previous versions of Grafana, if a data source was provisioned, the only way to add correlations to it was also with provisioning. Now, that’s no longer the case, and you can easily create new correlations mixing both methods—using the Administration page or provisioning.
To enable this feature, contact Grafana Support.
Grafana OnCall integration for Alerting
Generally AvailableAlerting
Release date: 2023-09-13
Use the Grafana Alerting - Grafana OnCall integration to effortlessly connect alerts generated by Grafana Alerting with Grafana OnCall. From there, you can route them according to defined escalation chains and schedules.
To learn more, refer to the Grafana OnCall integration for Alerting documentation.
Query-type template variables for Tempo data source
Generally AvailableData sourcesTraces
Release date: 2023-09-06
The Tempo data source now supports query-type template variables. With this update, you can create variables for which the values are a list of attribute names or attribute values seen on spans received by Tempo.
To learn more, refer to the following video demo, as well as the Grafana Variables documentation.
Was this page helpful?
Related resources from Grafana Labs
60 min

Getting started with managing your metrics, logs, and traces using Grafana
In this webinar, we’ll demo how to get started using the LGTM Stack: Loki for logs, Grafana for visualization, Tempo for traces, and Mimir for metrics.
60 min

Intro to Kubernetes monitoring in Grafana Cloud
In this webinar you’ll learn how Grafana offers developers and SREs a simple and quick-to-value solution for monitoring their Kubernetes infrastructure.
60 min

Building advanced Grafana dashboards
In this webinar, we’ll demo how to build and format Grafana dashboards.