
Release date:
What's new in Grafana Cloud
Grafana Cloud
RSS
What’s new in Grafana Cloud
Grafana Labs products, projects, and features can go through multiple release stages before becoming generally available. These stages in the release life cycle can present varying degrees of stability and support. For more information, refer to release life cycle for Grafana Labs.
No results found. Please adjust your filters or search criteria.
Page:
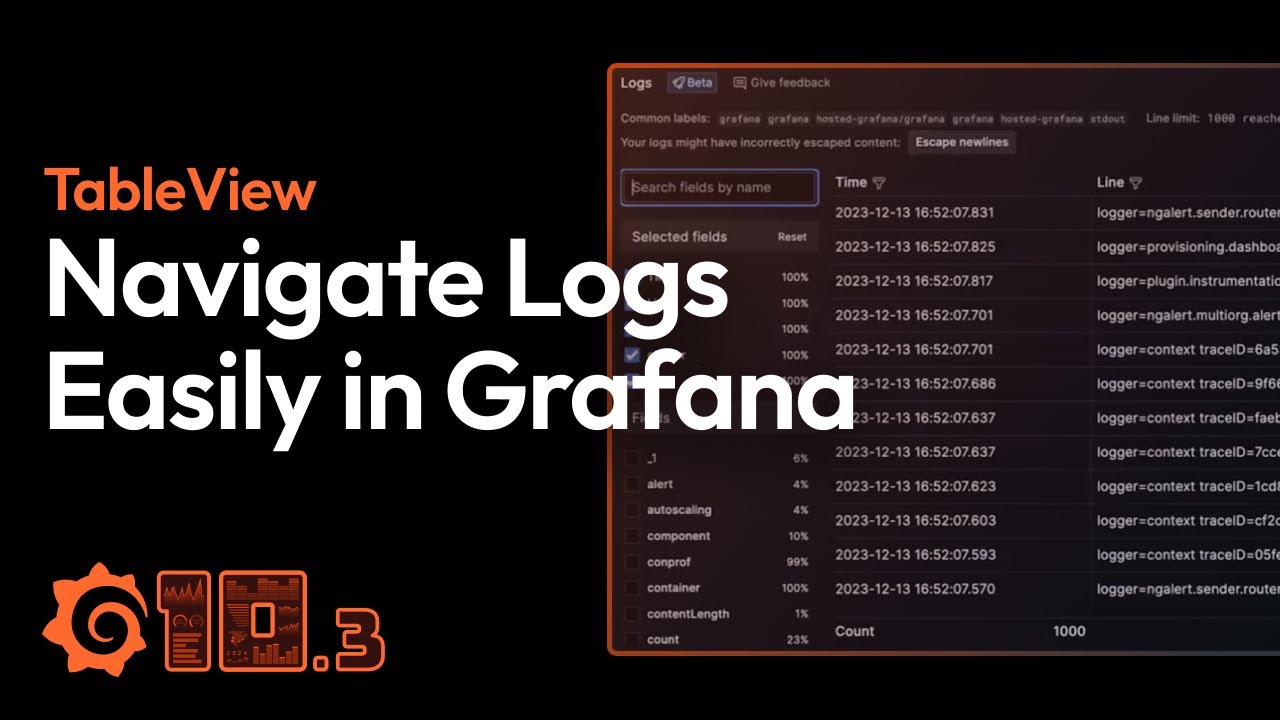
Logs Table UI
Available in public previewLogs
Release date: 2023-12-13
Table view was created to help facilitate ease of use in a point and click UI, as opposed to data source specific query language formatting options, like loki’s line_format.
Tables can be configured and shared with team members via explore URLs or by adding the table to a dashboard panel.
Command Palette extension point
Generally AvailablePlugins
Release date: 2023-12-13
Plugins can now add custom actions into Grafana’s command palette. Actions can link directly to a plugin page, or open a modal to allow users to interact with a plugin without losing their current page.
In Grafana Cloud you can use the new ‘Run investigation’ action to start a Sift investigation from anywhere in Grafana. Keep an eye out for new actions appearing in your command palette in the near future!
Monitor EC2 instances in AWS observability
Generally Available
Release date: 2023-12-13
Grafana AWS observability introduces monitoring for your EC2 instances, all within an embedded experience, and without the need for managing or configuring local agents or building dashboards.
From the list of scrape jobs, you can navigate to your list of EC2 instances shown on the Overview tab, and drill into instance details.
Cluster and Node detail pages in Kubernetes Monitoring
Generally AvailableKubernetes Monitoring
Release date: 2023-12-12
Cost monitoring and investigation and troubleshooting of CPU and memory usage are now easier for both Clusters and Nodes. Go to the optimization panels for the Cluster and Node detail pages to view the CPU and memory utilization, as well as cost information.
These graphs show a history based on the time range you select.

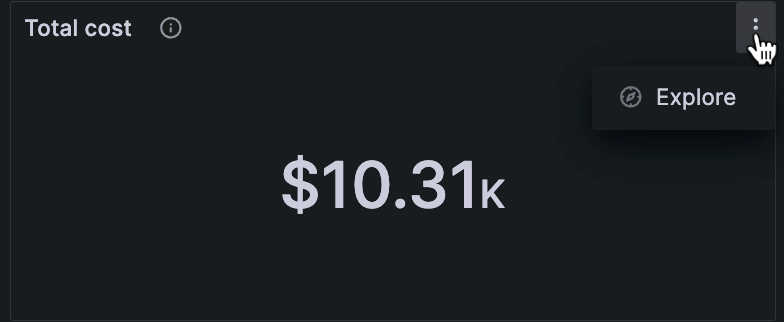
Explore cost queries in Kubernetes Monitoring
Generally AvailableKubernetes Monitoring
Release date: 2023-12-12
On any panel of the Cost page in Kubernetes Monitoring, click the Explore button.
Better user experience for configuration status in Kubernetes Monitoring
Generally AvailableKubernetes Monitoring
Release date: 2023-12-01
The Metrics status tab, which shows the configuration status of Kubernetes Monitoring components, is updated for better usability and quicker comprehension.

Configuration platform selector in Kubernetes Monitoring
Generally AvailableKubernetes Monitoring
Release date: 2023-12-01
When configuring Kubernetes Monitoring with the streamlined configuration wizard that uses Grafana Kubernetes Helm Chart, you can select the platform you are using.

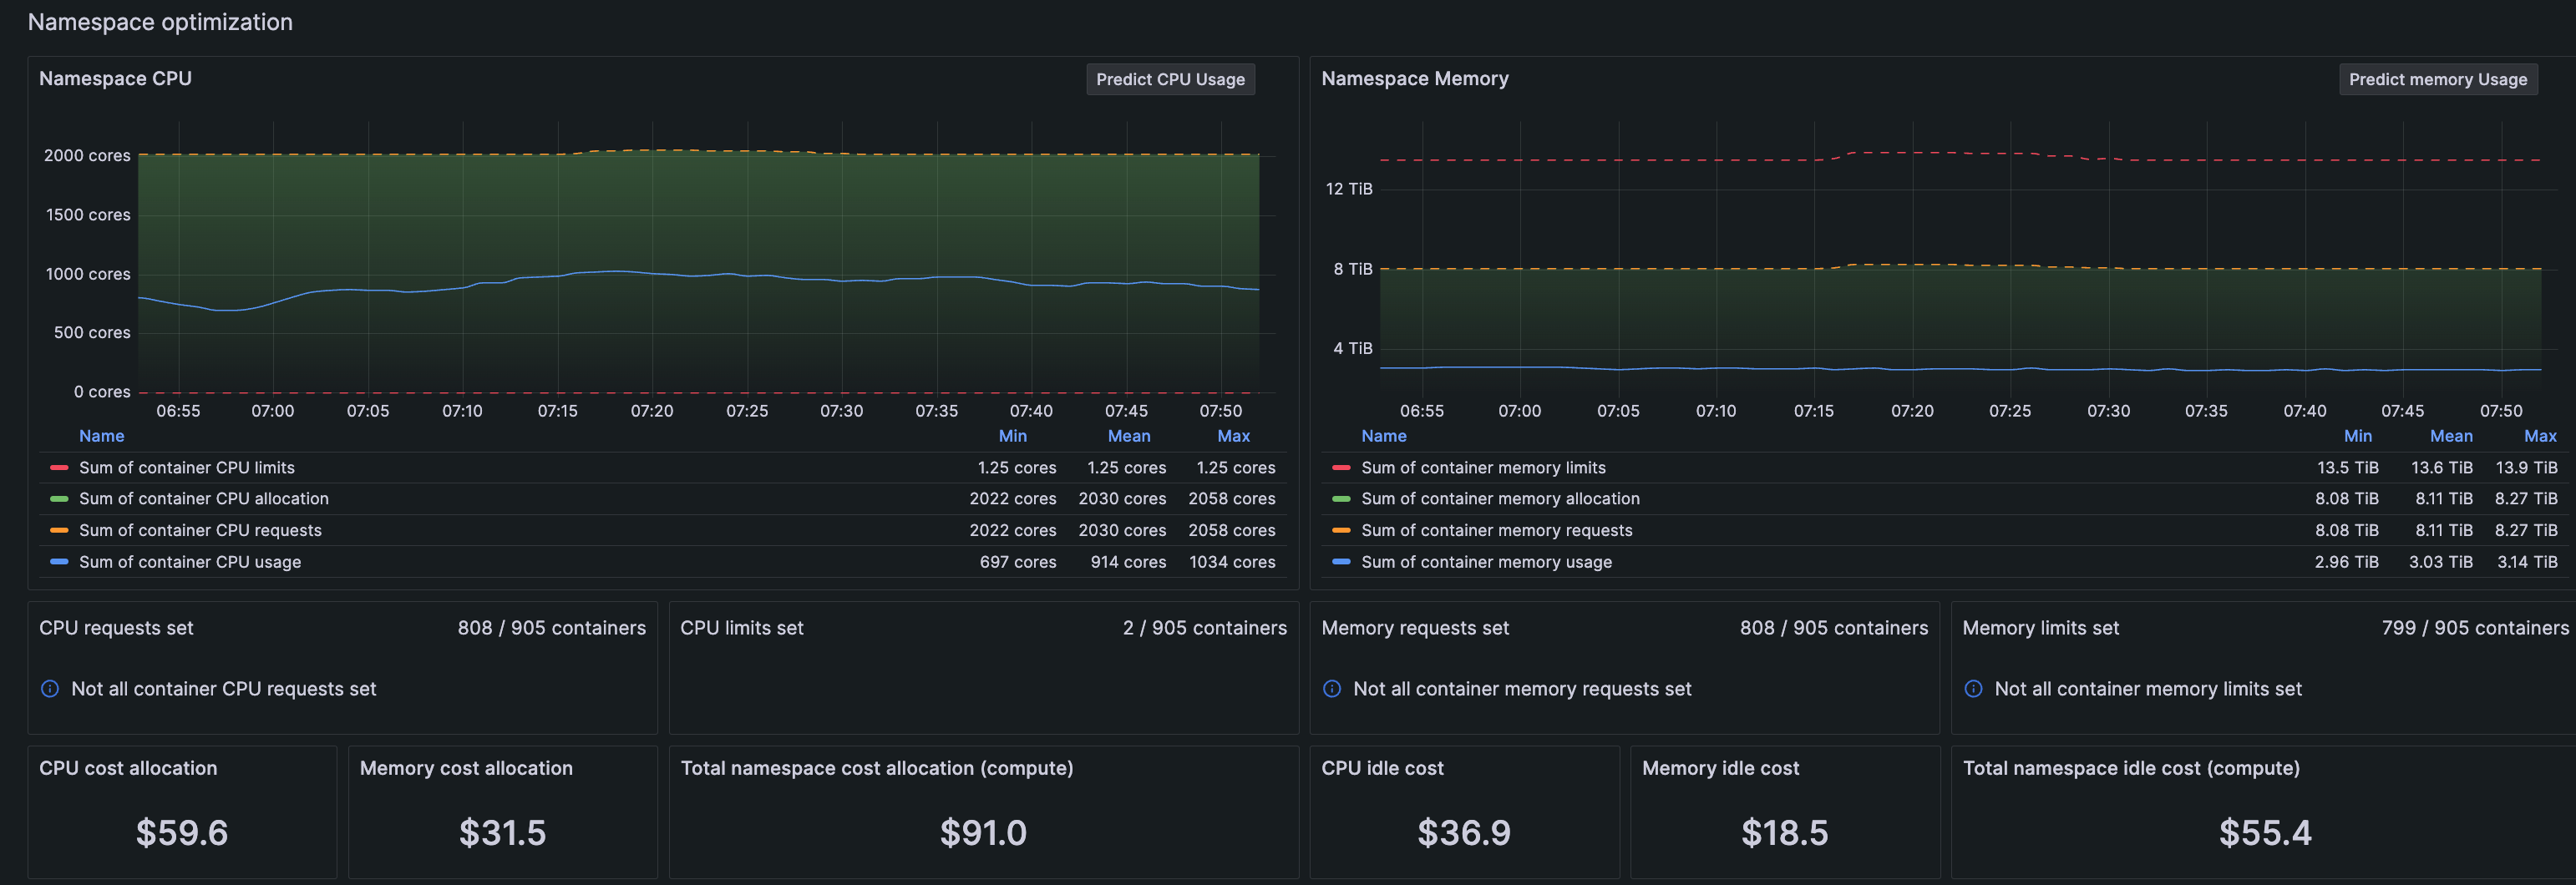
Usage and cost information available on detail pages in Kubernetes Monitoring
Generally AvailableKubernetes Monitoring
Release date: 2023-12-01
CPU and memory usage graphs and details, along with associated costs, are available on these pages in Kubernetes Monitoring:
- Namespace details page
![<Namespace detail page>]()
- Workload detail page
![<Workload detail page>]()
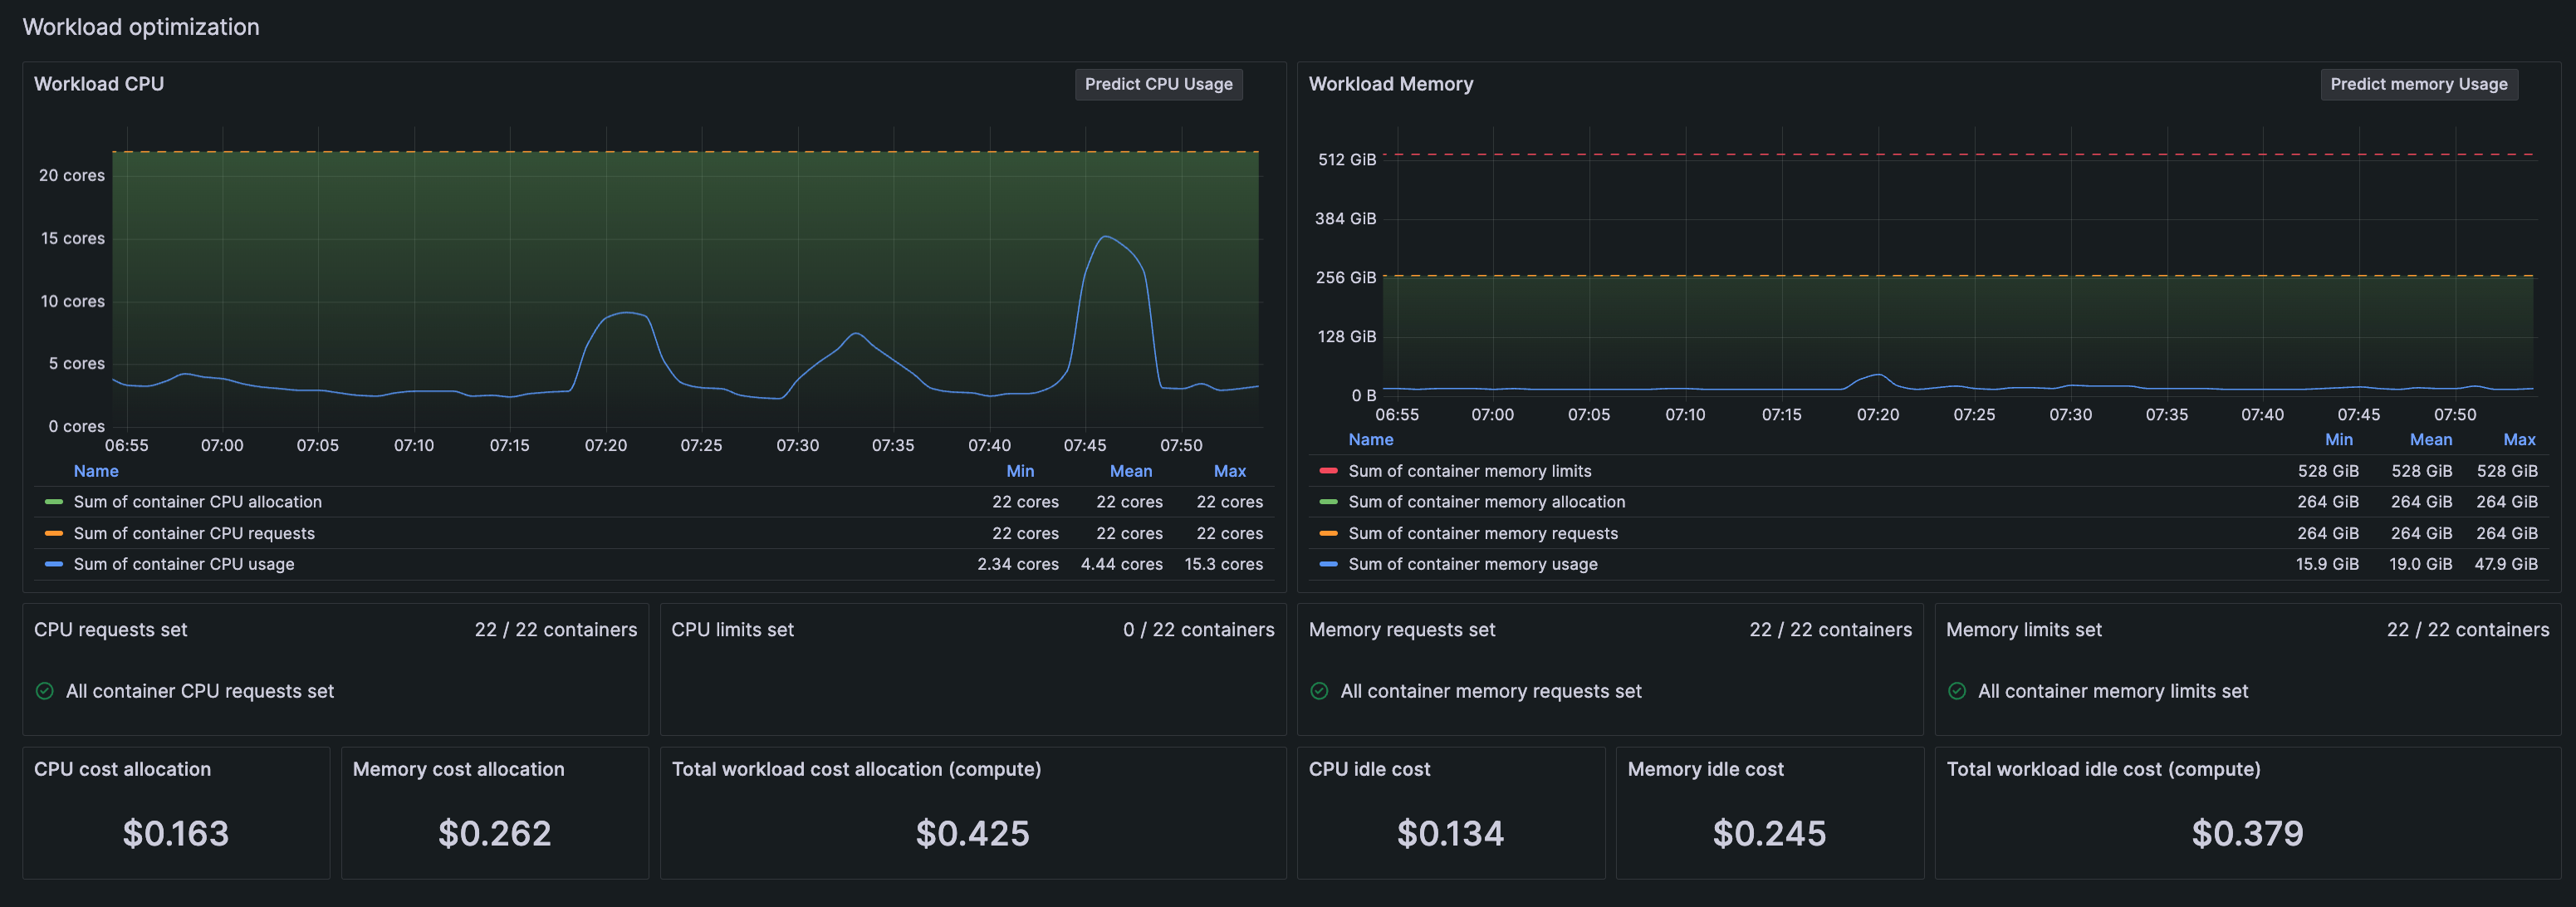
(Release 1.5.0)
New Container, pod, workload & namespace details pages in Kubernetes Monitoring
Generally AvailableKubernetes Monitoring
Release date: 2023-12-01
View the details of any container, pod, workload & namespace with these improved pages, which include CPU and memory utilization graphs and cost details.
The container page also shows adjacent restart and termination panels so you can visually correlate more quickly the restart and termination events, along with the reason for termination.
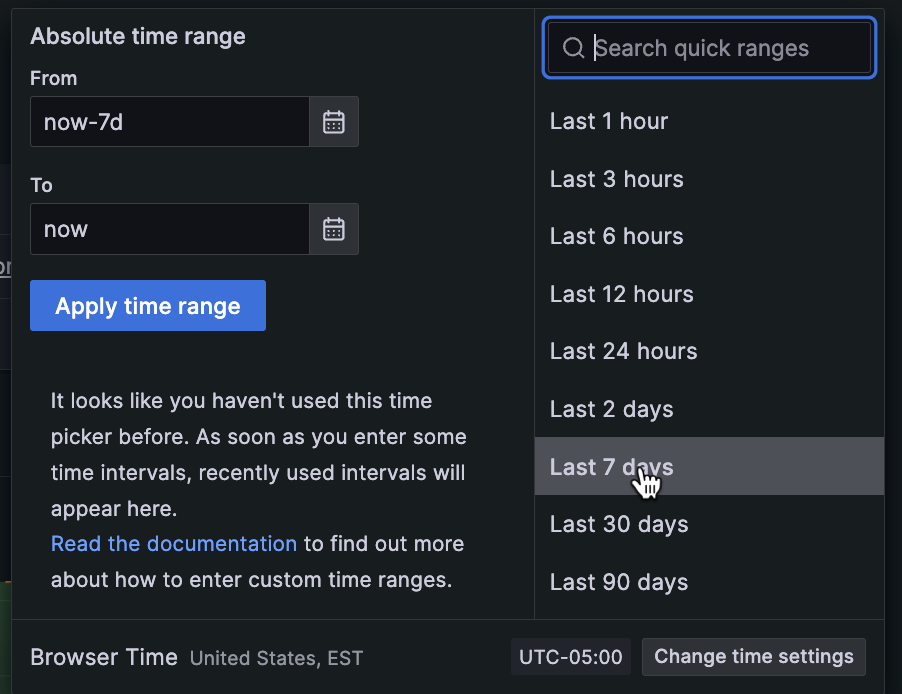
Time range selector on all pages and in outlier detection
Generally AvailableKubernetes Monitoring
Release date: 2023-12-01
To aid in understanding historical data, a time range selector is available on every page of Kubernetes Monitoring where this function is appropriate. This selector is also available on the Workloads detail page, for detecting outlier CPU usage in the Pods. (Release 1.4.0)
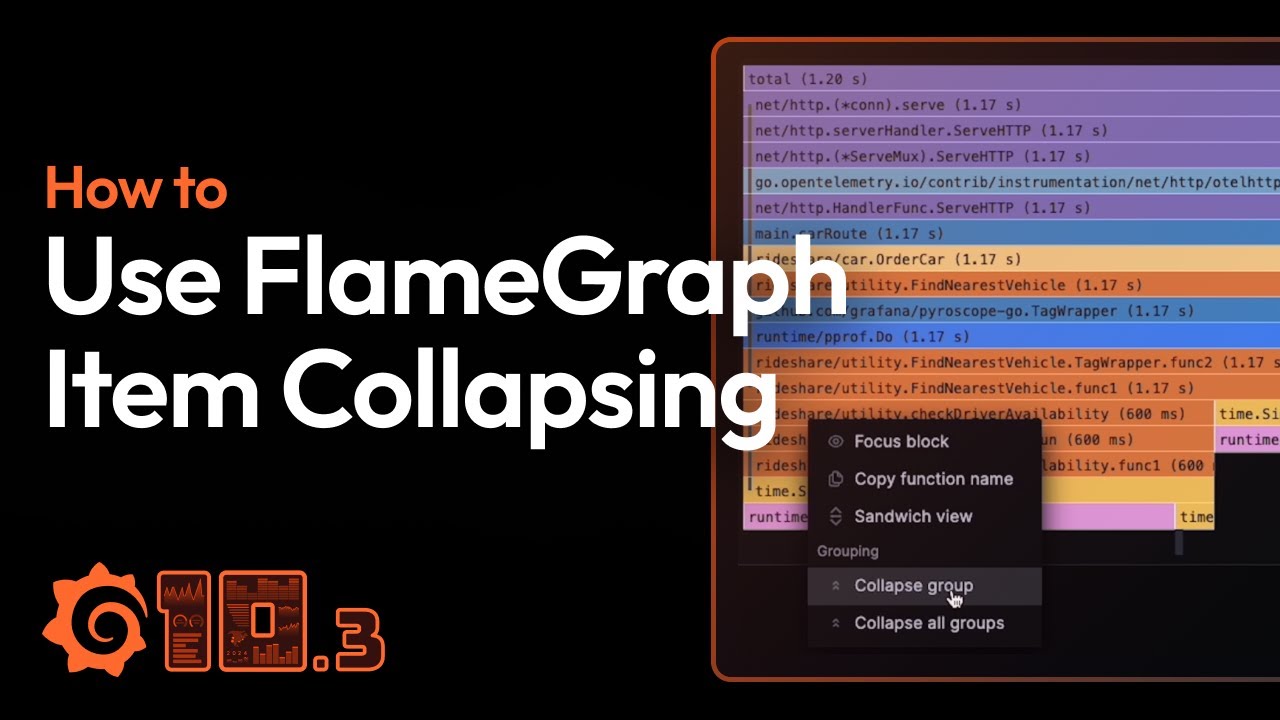
FlameGraph: Collapsing similar items in the graph
ExperimentalProfiles
Release date: 2023-11-09
Sometimes profile stacks contain lots of levels with similar repeating items, for example long stacks of framework code that usually isn’t of interest but takes up a lot of visual real estate. With this feature, instead of rendering all of the similar items we render only one and allow to expand those collapsed items on demand.
To try it out, enable the ‘traceToProfiles’ feature toggle. To enable it in your Grafana Cloud stack, contact Grafana Support.
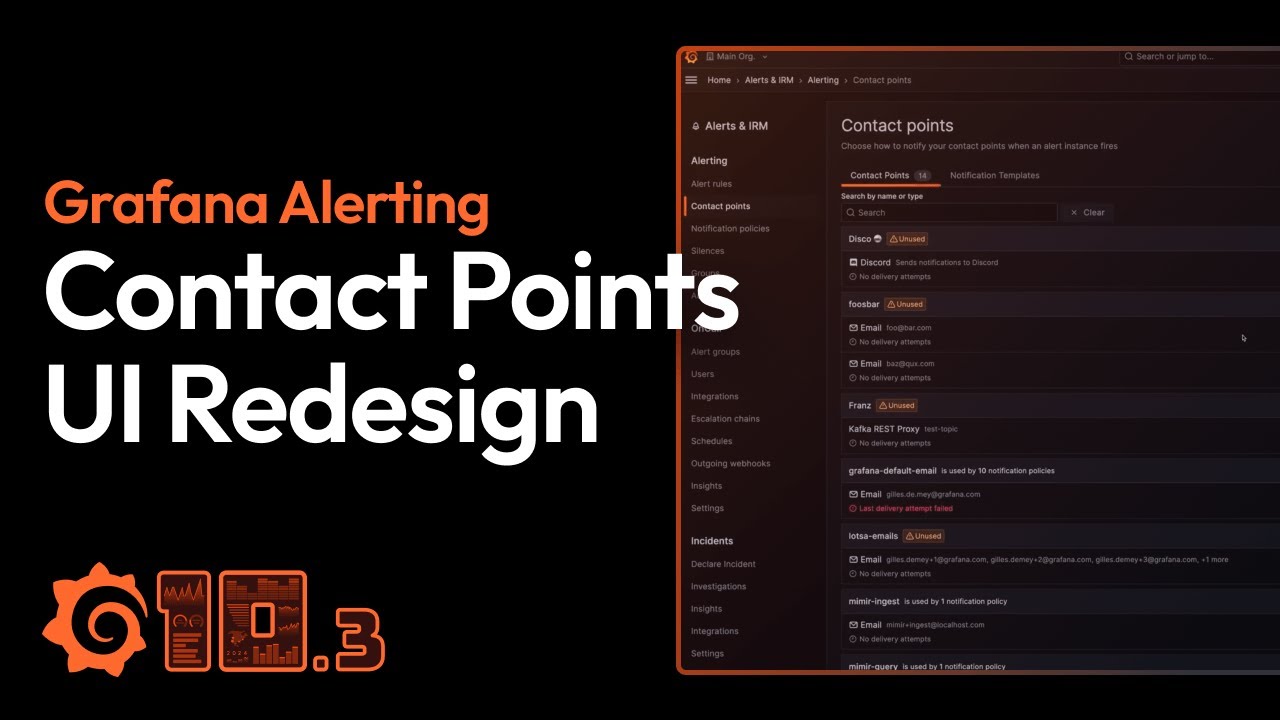
Contact points list view redesign
Generally AvailableAlerting
Release date: 2023-11-08
The Contact points list view has been redesigned and split into two tabs: Contact Points and Notification Templates, making it easier to view all contact point information at a glance. You can now search for name and type of contact points and integrations, view how many notification policies each contact point is being used for, and navigate directly to the linked notification policies.
Tempo data source: "Aggregate By" Search option to compute RED metrics over spans aggregated by attribute
ExperimentalTraces
Release date: 2023-11-02
We’ve added an Aggregate By option to the TraceQL query editor to leverage Grafana Cloud Traces’ metrics summary API. You can calculate RED metrics (total span count, percent erroring spans, and latency information) for spans of kind=server received in the last hour that match your filter criteria, grouped by whatever attributes you specify.
This feature is disabled by default. To enable it, file contact Grafana Support.

Alerting insights
Generally AvailableAlerting
Release date: 2023-10-30
Use Alerting insights to monitor your alerting data, discover key trends about your organization’s alert management performance, and find patterns in why things go wrong.
Export alerting resources to Terraform
Generally AvailableAlerting
Release date: 2023-10-30
Export your alerting resources, such as alert rules, contact points, and notification policies as Terraform resources. A new “Modify export” mode for alert rules enables you to edit provisioned alert rules and export a modified version.
Was this page helpful?
Related resources from Grafana Labs
60 min

Getting started with managing your metrics, logs, and traces using Grafana
In this webinar, we’ll demo how to get started using the LGTM Stack: Loki for logs, Grafana for visualization, Tempo for traces, and Mimir for metrics.
60 min

Intro to Kubernetes monitoring in Grafana Cloud
In this webinar you’ll learn how Grafana offers developers and SREs a simple and quick-to-value solution for monitoring their Kubernetes infrastructure.
60 min

Building advanced Grafana dashboards
In this webinar, we’ll demo how to build and format Grafana dashboards.