What's new from Grafana Labs
Grafana Labs products, projects, and features can go through multiple release stages before becoming generally available. These stages in the release life cycle can present varying degrees of stability and support. For more information, refer to release life cycle for Grafana Labs.
Loading...
Area of interest:
Cloud availability:
Cloud editions:
Self-managed availability:
Self-managed editions:
No results found. Please adjust your filters or search criteria.
There was an error with your request.
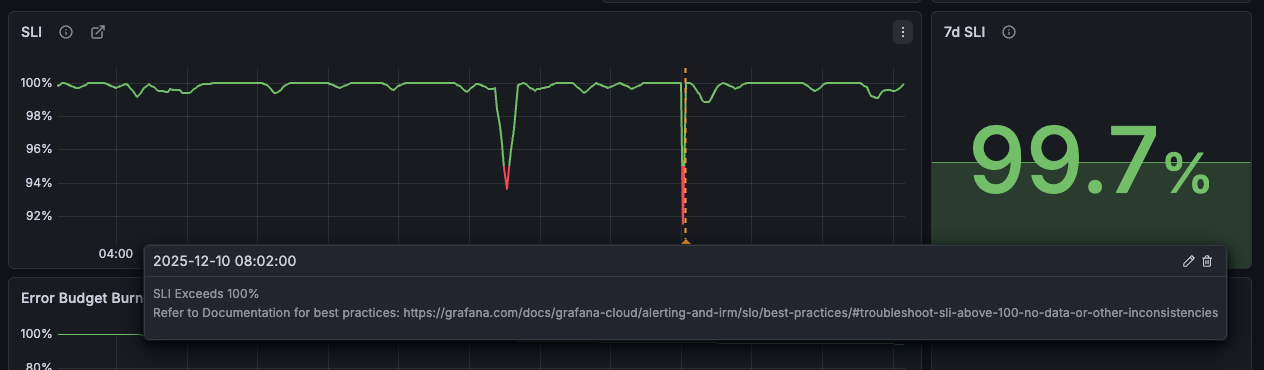
When users see SLI graphs spike above 100%, it can lead to confusion and concerns about whether the SLO or SLO plugin is functioning correctly.
You can now capture and attach screenshots to an incident from anywhere in Grafana. This helps you share visual evidence fast and keep your incident history complete.
Short URLs created when sharing an Explore link or a dashboard internally are now saved indefinitely by default.
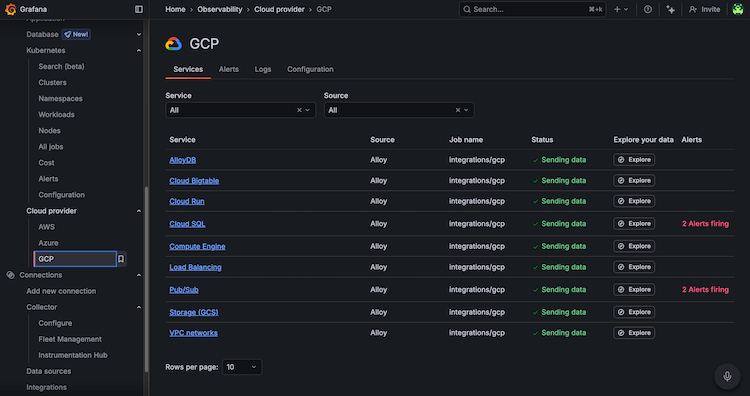
You can now view machine learning predictions for drilldown instances of preconfigured dashboards in Cloud Provider Observability using the Predict button. Predictions help you ensure resources are available during spikes in usage, as well as help you decrease the amount of resources due to over provisioning.
We’re changing how we roll out updates to Grafana Cloud by separating feature enablement from code delivery. As Grafana Cloud expands, we’re in the process of moving to a continuous delivery model so different parts of Grafana Cloud can be updated more frequently and reliably on their own schedule.
We’ve expanded our Cloud Provider Observability offering with new out-of-the-box dashboards designed to give you faster insights and reduce the operational overhead across your multi-cloud infrastructure. These dashboards are now available for key services across Google Cloud, Microsoft Azure, and AWS. Each dashboard is an actionable observability layer, helping your team move from reactive troubleshooting to proactive performance and cost management.
Recently, the Alert rule page received a total redesign. The new Alert rule page features a smoother, faster, and more flexible design to help make your alert rule management easier.
If you’d like to try it out in our private preview, you can sign up here. And we would love your feedback, you can share it here.
The alert rule page has received a total redesign. The new page features a smoother, faster, and more flexible design to help make your alert rule management easier.
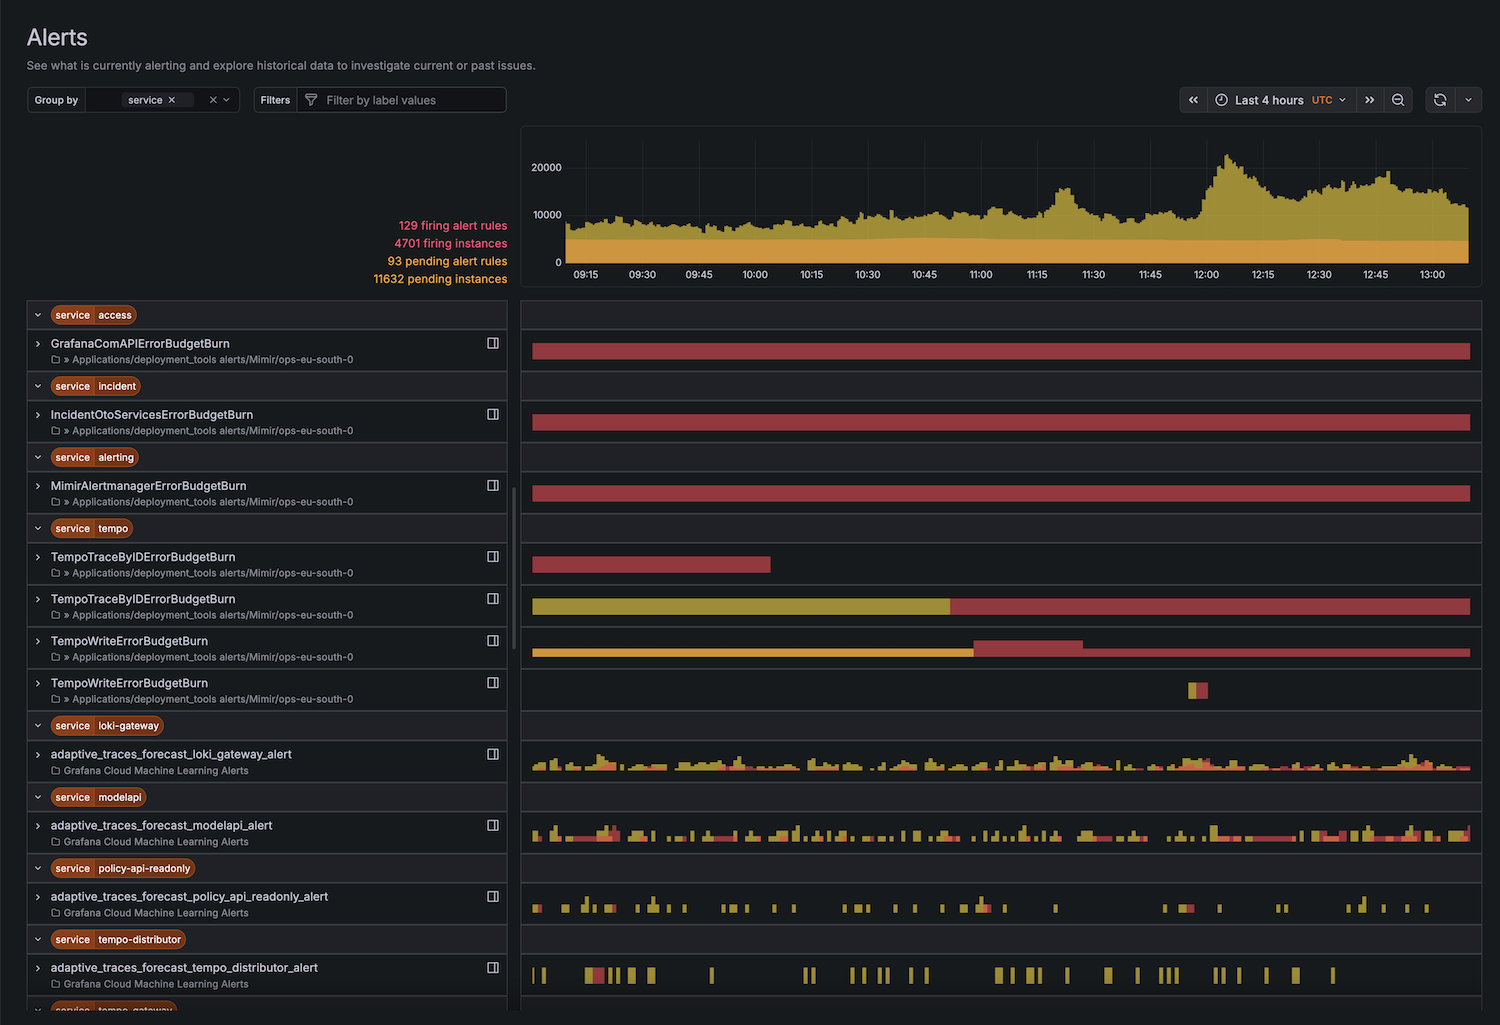
When monitoring complex systems, quickly identifying and prioritizing critical incidents among a large volume of firing or pending alerts can often slow down incident response.
You can now add labels to alert groups in Grafana IRM, giving teams more flexibility to organize, filter, and take action on alerts as they evolve.
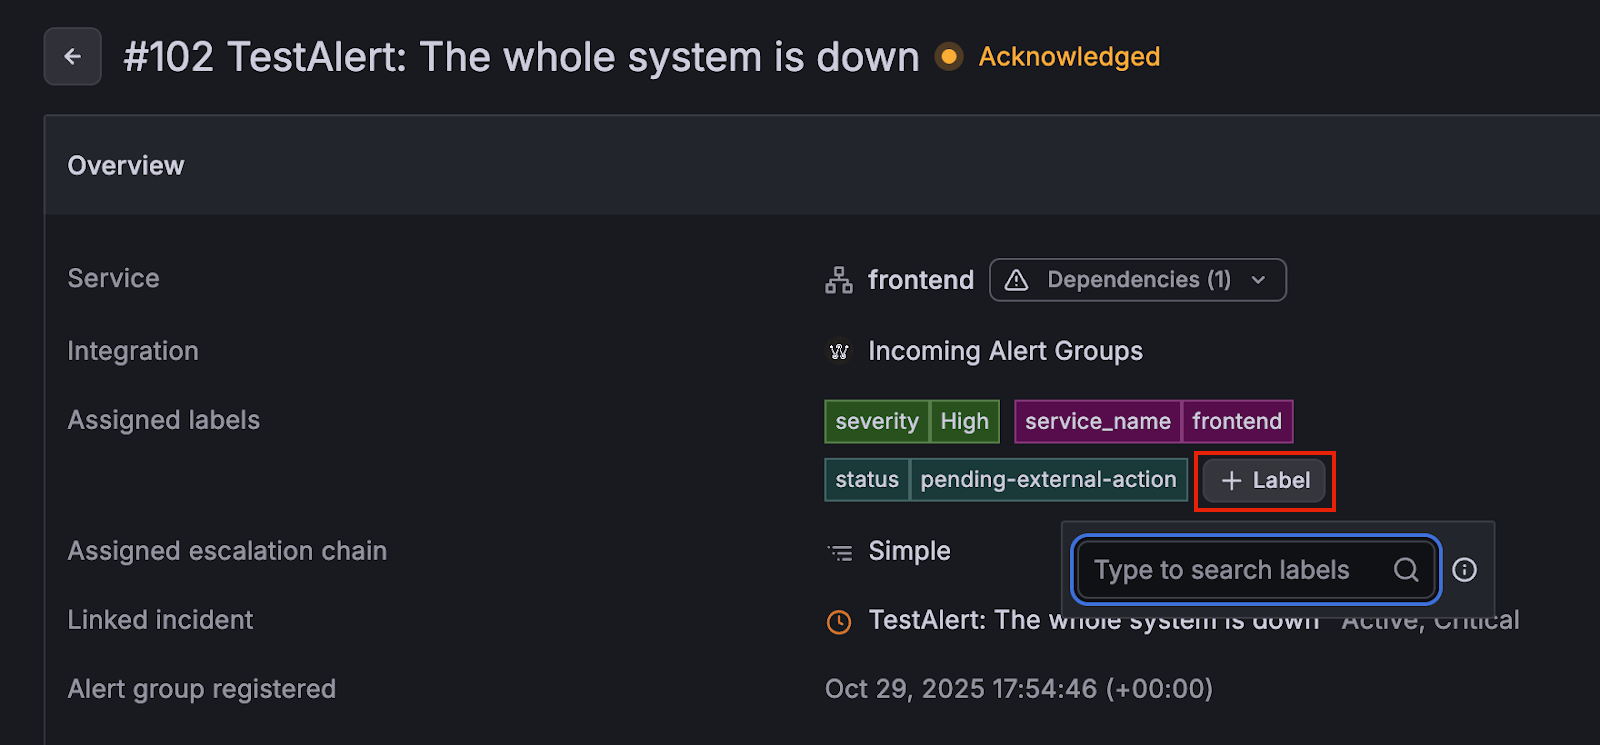
With the new + Label functionality, you can enrich an alert group with additional context at any point via the UI or API. This makes it easier to:
- Add triage context (for example:
triage:needs-follow-up, orstatus:investigating) - Support workflows that depend on labels
- Improve discoverability when many teams share the same IRM instance
- Standardize metadata across alerts coming from diverse systems
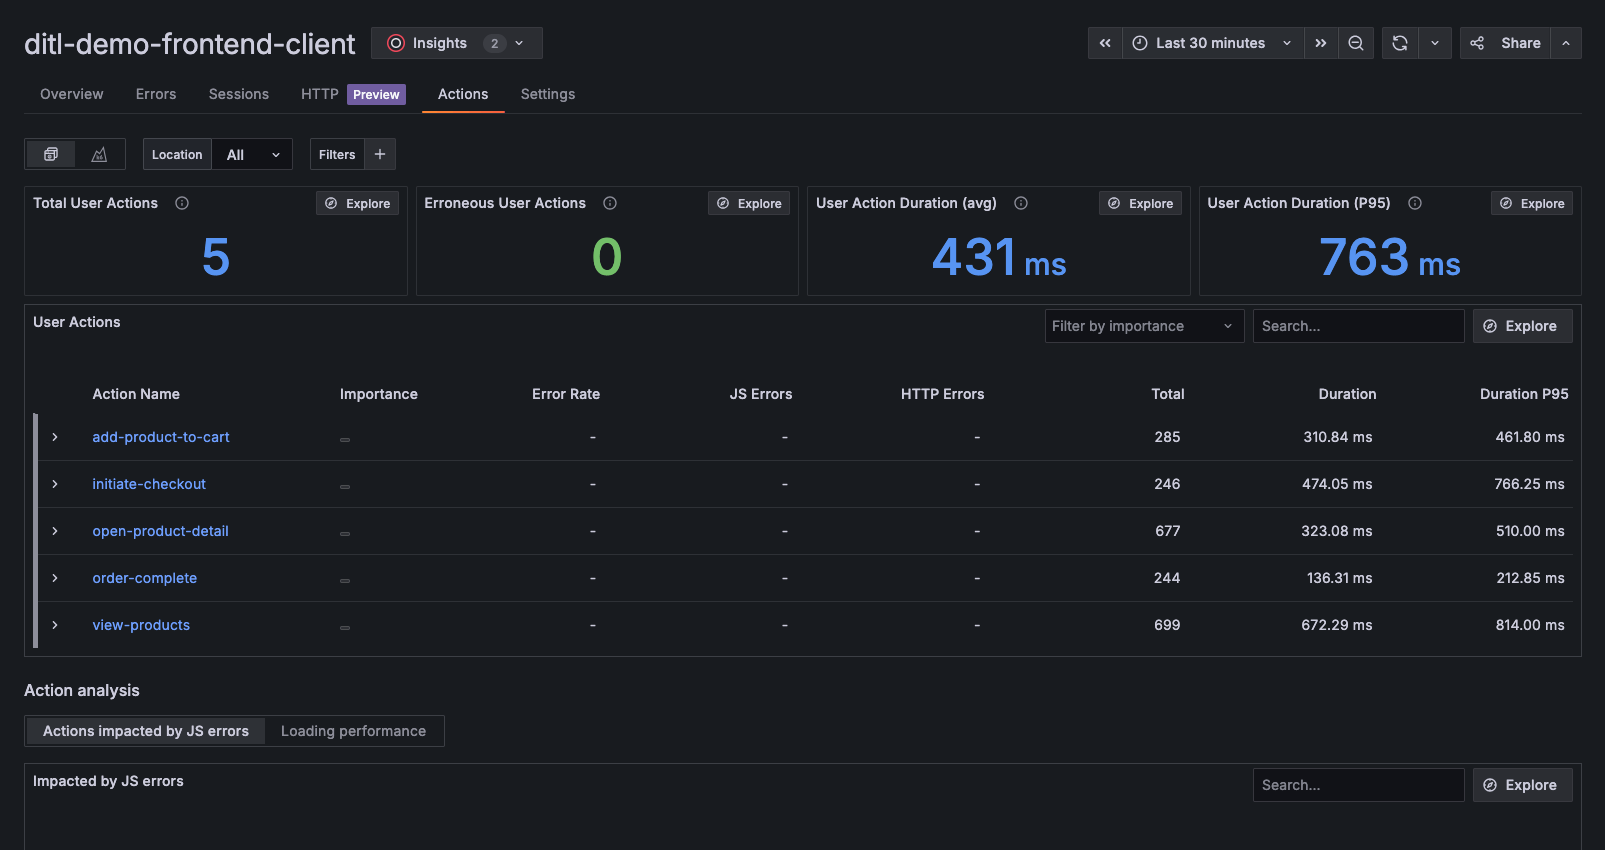
This major release brings new updates to User Actions for GA, introduces improvements to Web Vitals, simplifies configuration, cleans up deprecated internals, and adds experimental navigation instrumentation for soft navigations.
User Actions is a new capability in Grafana Frontend Observability that helps you track, analyze, and troubleshoot the most important interactions users perform in your web applications.
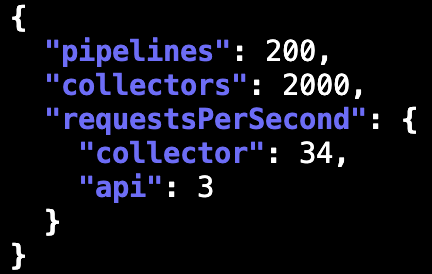
Fleet Management has a new API designed to help you understand the collector, configuration pipeline, and API rate limits that apply to your stack.
A request to the GetLimits endpoint returns the limits you need to know to keep your fleet running smoothly.
Grafana Fleet Management now supports private connections to all three major cloud providers. In addition to AWS PrivateLink, we have added support for Azure PrivateLink and Google Cloud Platform (GCP) Private Service Connect. Now you can securely connect to Fleet Management APIs without using the public internet, no matter where your services are hosted.