What's new from Grafana Labs
Grafana Labs products, projects, and features can go through multiple release stages before becoming generally available. These stages in the release life cycle can present varying degrees of stability and support. For more information, refer to release life cycle for Grafana Labs.
Loading...
Area of interest:
Cloud availability:
Cloud editions:
Self-managed availability:
Self-managed editions:
No results found. Please adjust your filters or search criteria.
There was an error with your request.
Kubernetes costs are notoriously hard to track and optimize. New Overview and Savings tabs in Kubernetes Monitoring show:
- Spending across the past 60 days
- Potential savings for the next 30 days
- How much you can save by optimizing resources
- Recommendations from Grafana Assistant about your data


Git Sync in Grafana lets you manage your dashboards as code as JSON files stored in GitHub. You and your team can use it to version control, collaborate, and automate deployments efficiently.
Using the Google Sheets data source in Grafana is all about speed and flexibility, but one recurring friction point was having to reselect the same spreadsheet every time the data source was used.
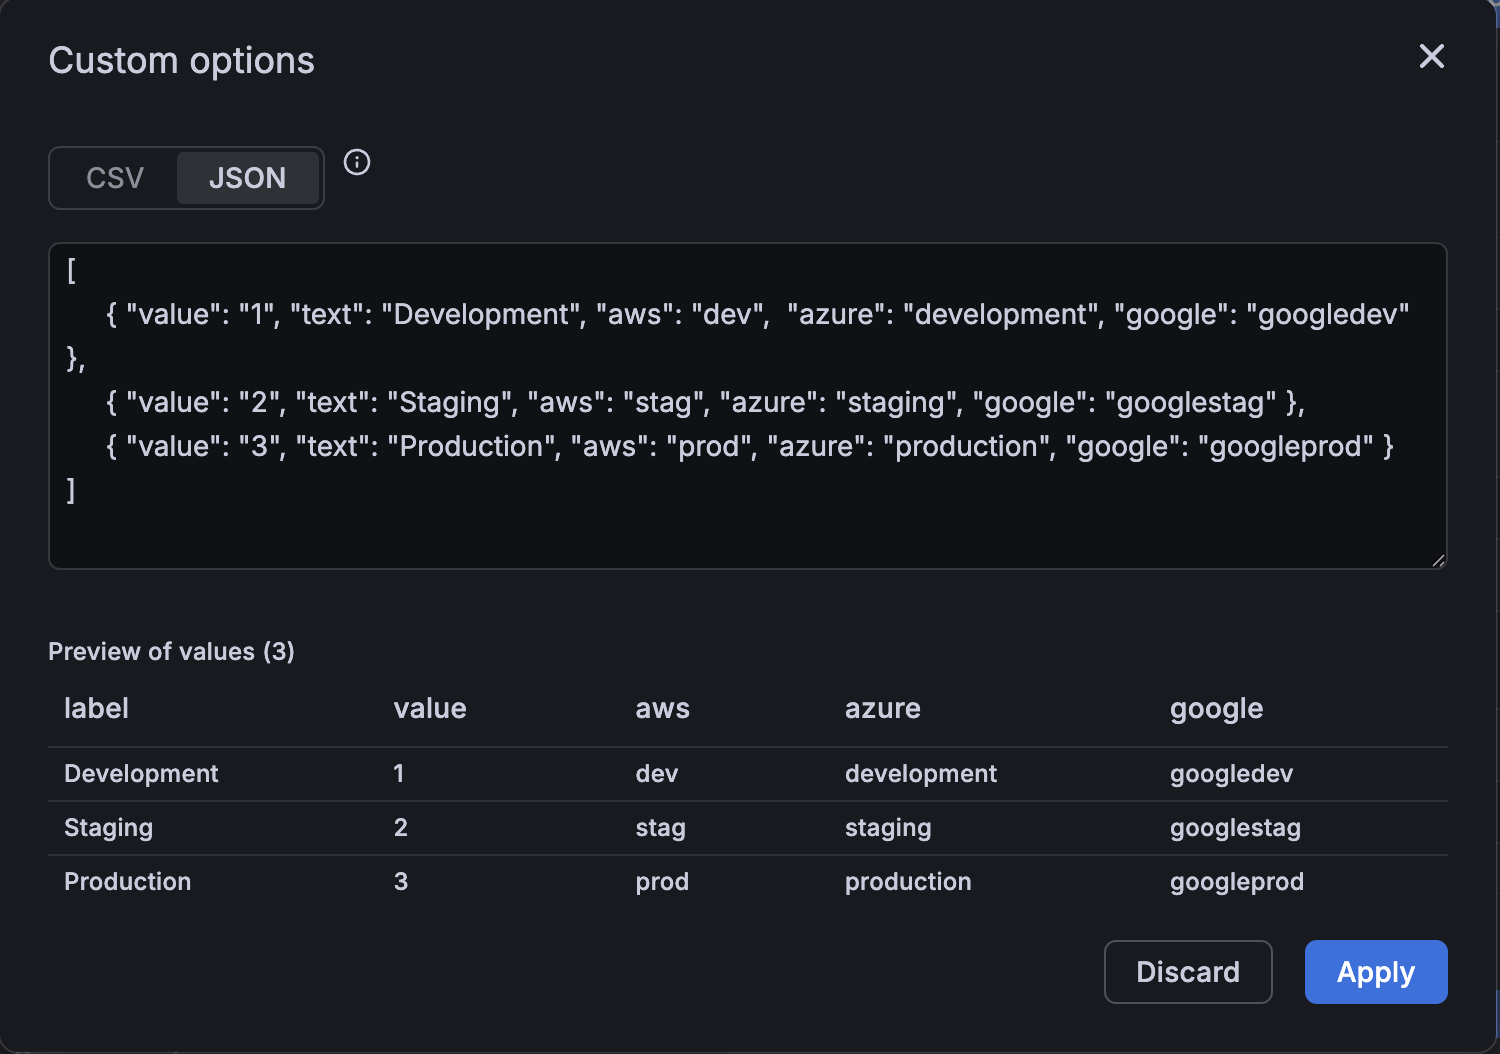
We’re excited to introduce multi-property variables—a simple, powerful way to let you map several identifiers to a single variable. Instead of creating and keeping multiple variables for the same logical concept in sync (for example, an environment identified as “dev” vs “development”), you can map all of those identifiers to one variable and then reference any property you need in panels and queries. This reduces dashboard clutter and makes multi-source dashboards much easier to author and maintain.
Security teams using CrowdStrike’s Falcon NextGen SIEM now have a direct path to visualize their security data in Grafana. With dedicated NGSIEM mode, connect via OAuth2 client credentials and bring your security investigations and incident data directly into your existing Grafana dashboards for unified observability and threat analysis. Get started by selecting NGSIEM mode in your data source configuration and learn more in the configuration documentation.
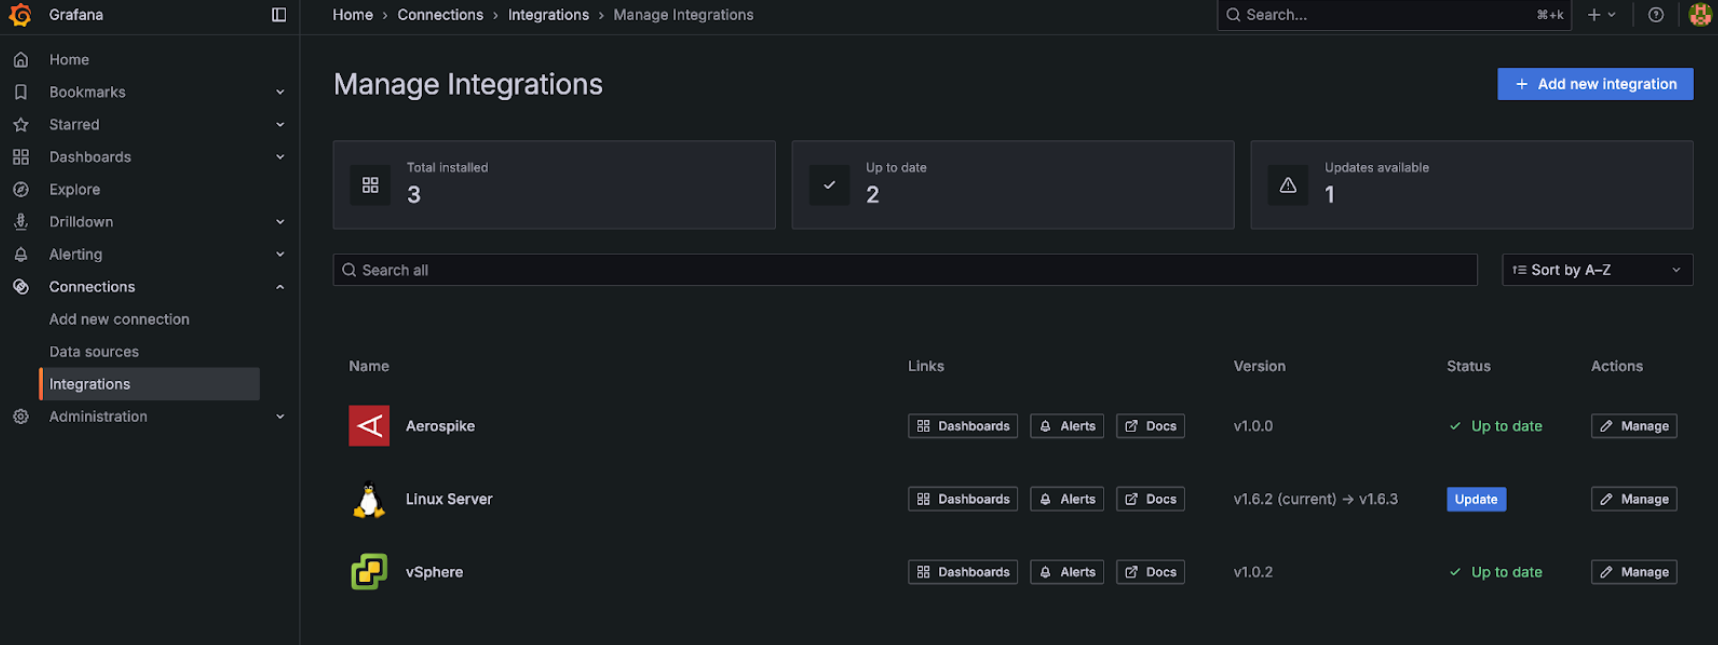
If you are using more than one integration in you observability fleet this new functionality will help you understand and manage their state.
Never wait for a login to secure your stack
You can now automate your entire user lifecycle and team structures directly from your identity provider (IdP). By moving SCIM from public preview to general availability, we’ve removed the “first login” bottleneck, allowing centralized operators to provision, configure, and secure users before they even open the app.
We’re excited to announce the General Availability release of secrets management for Synthetic Monitoring, available to all Grafana Cloud users.
Secrets management gives you a centralized place to securely store sensitive data like API keys, passwords, and tokens.
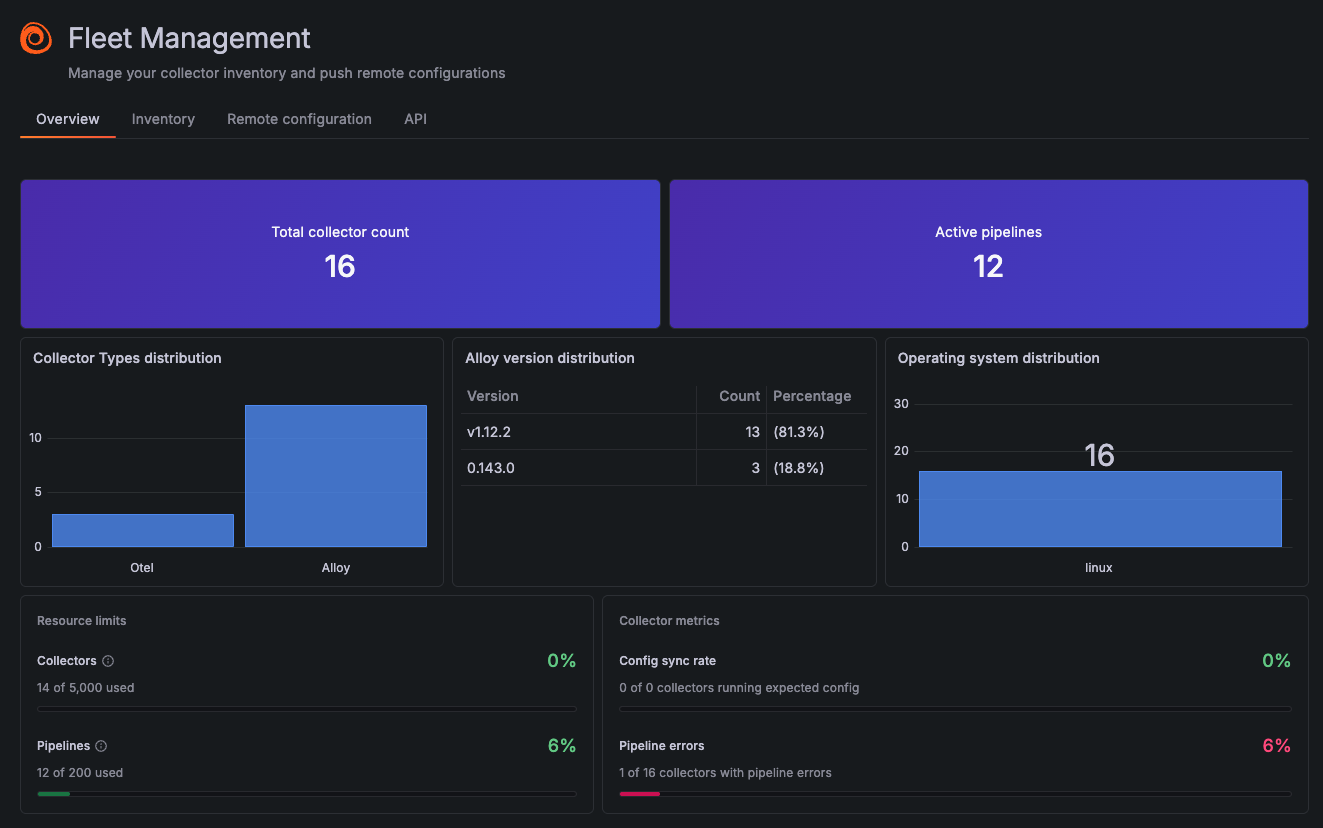
Managing hundreds or thousands of collectors just got easier. The new Overview tab in Grafana Fleet Management gives you instant visibility into your entire fleet’s health and composition. See what matters most in seconds:
- Fleet composition – Visualize your collector types, versions, and operating systems at scale
- Resource usage – Track your current collector and pipeline counts against stack limits
- Troubleshoot at a glance – Spot pipeline errors across your fleet instantly
- Active deployments – Monitor total collectors and active pipelines in real-time
We are excited to offer a new alert enrichment feature for Grafana Cloud. Alert enrichments significantly enhance your experience by providing richer context directly within the alert notification. This way you can start diagnosing the issue, plan remediation steps, or determine severity and escalation paths without the need to click through to Grafana or other tooling. This supplemental information helps reduce false positives and ensures that better context is given to critical issues.
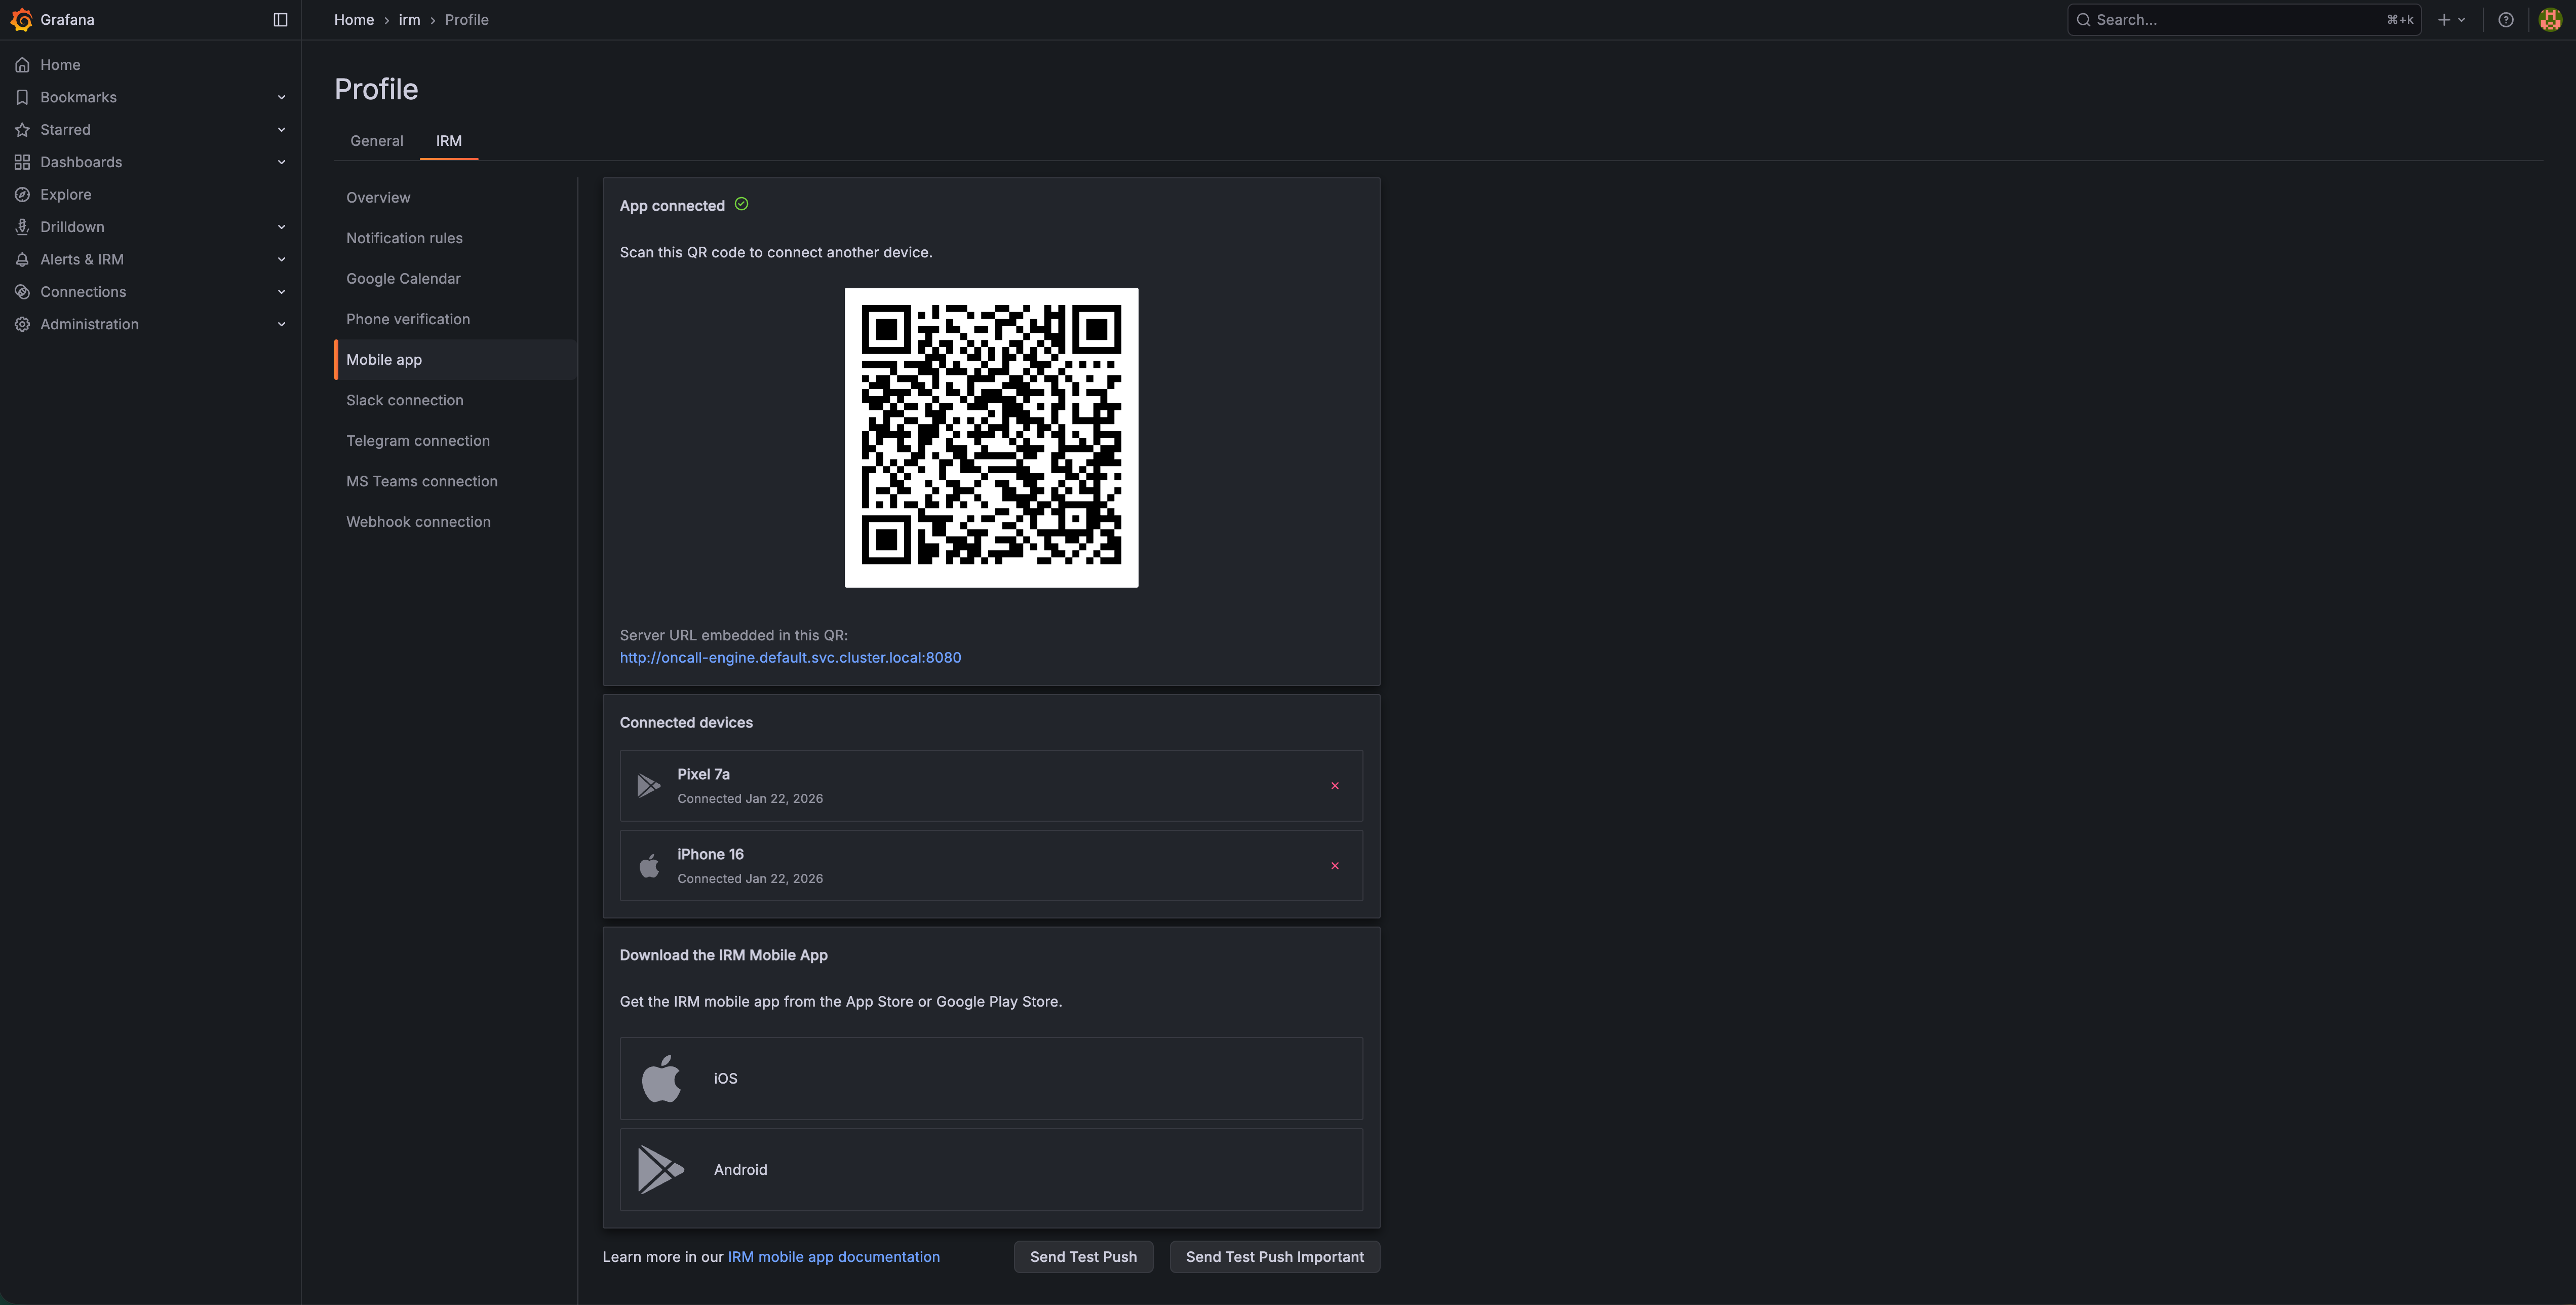
On-call engineers don’t always carry the same phone. You might have a work phone for the office and a personal phone for after hours. Until now, connecting a new device meant disconnecting the old one first.
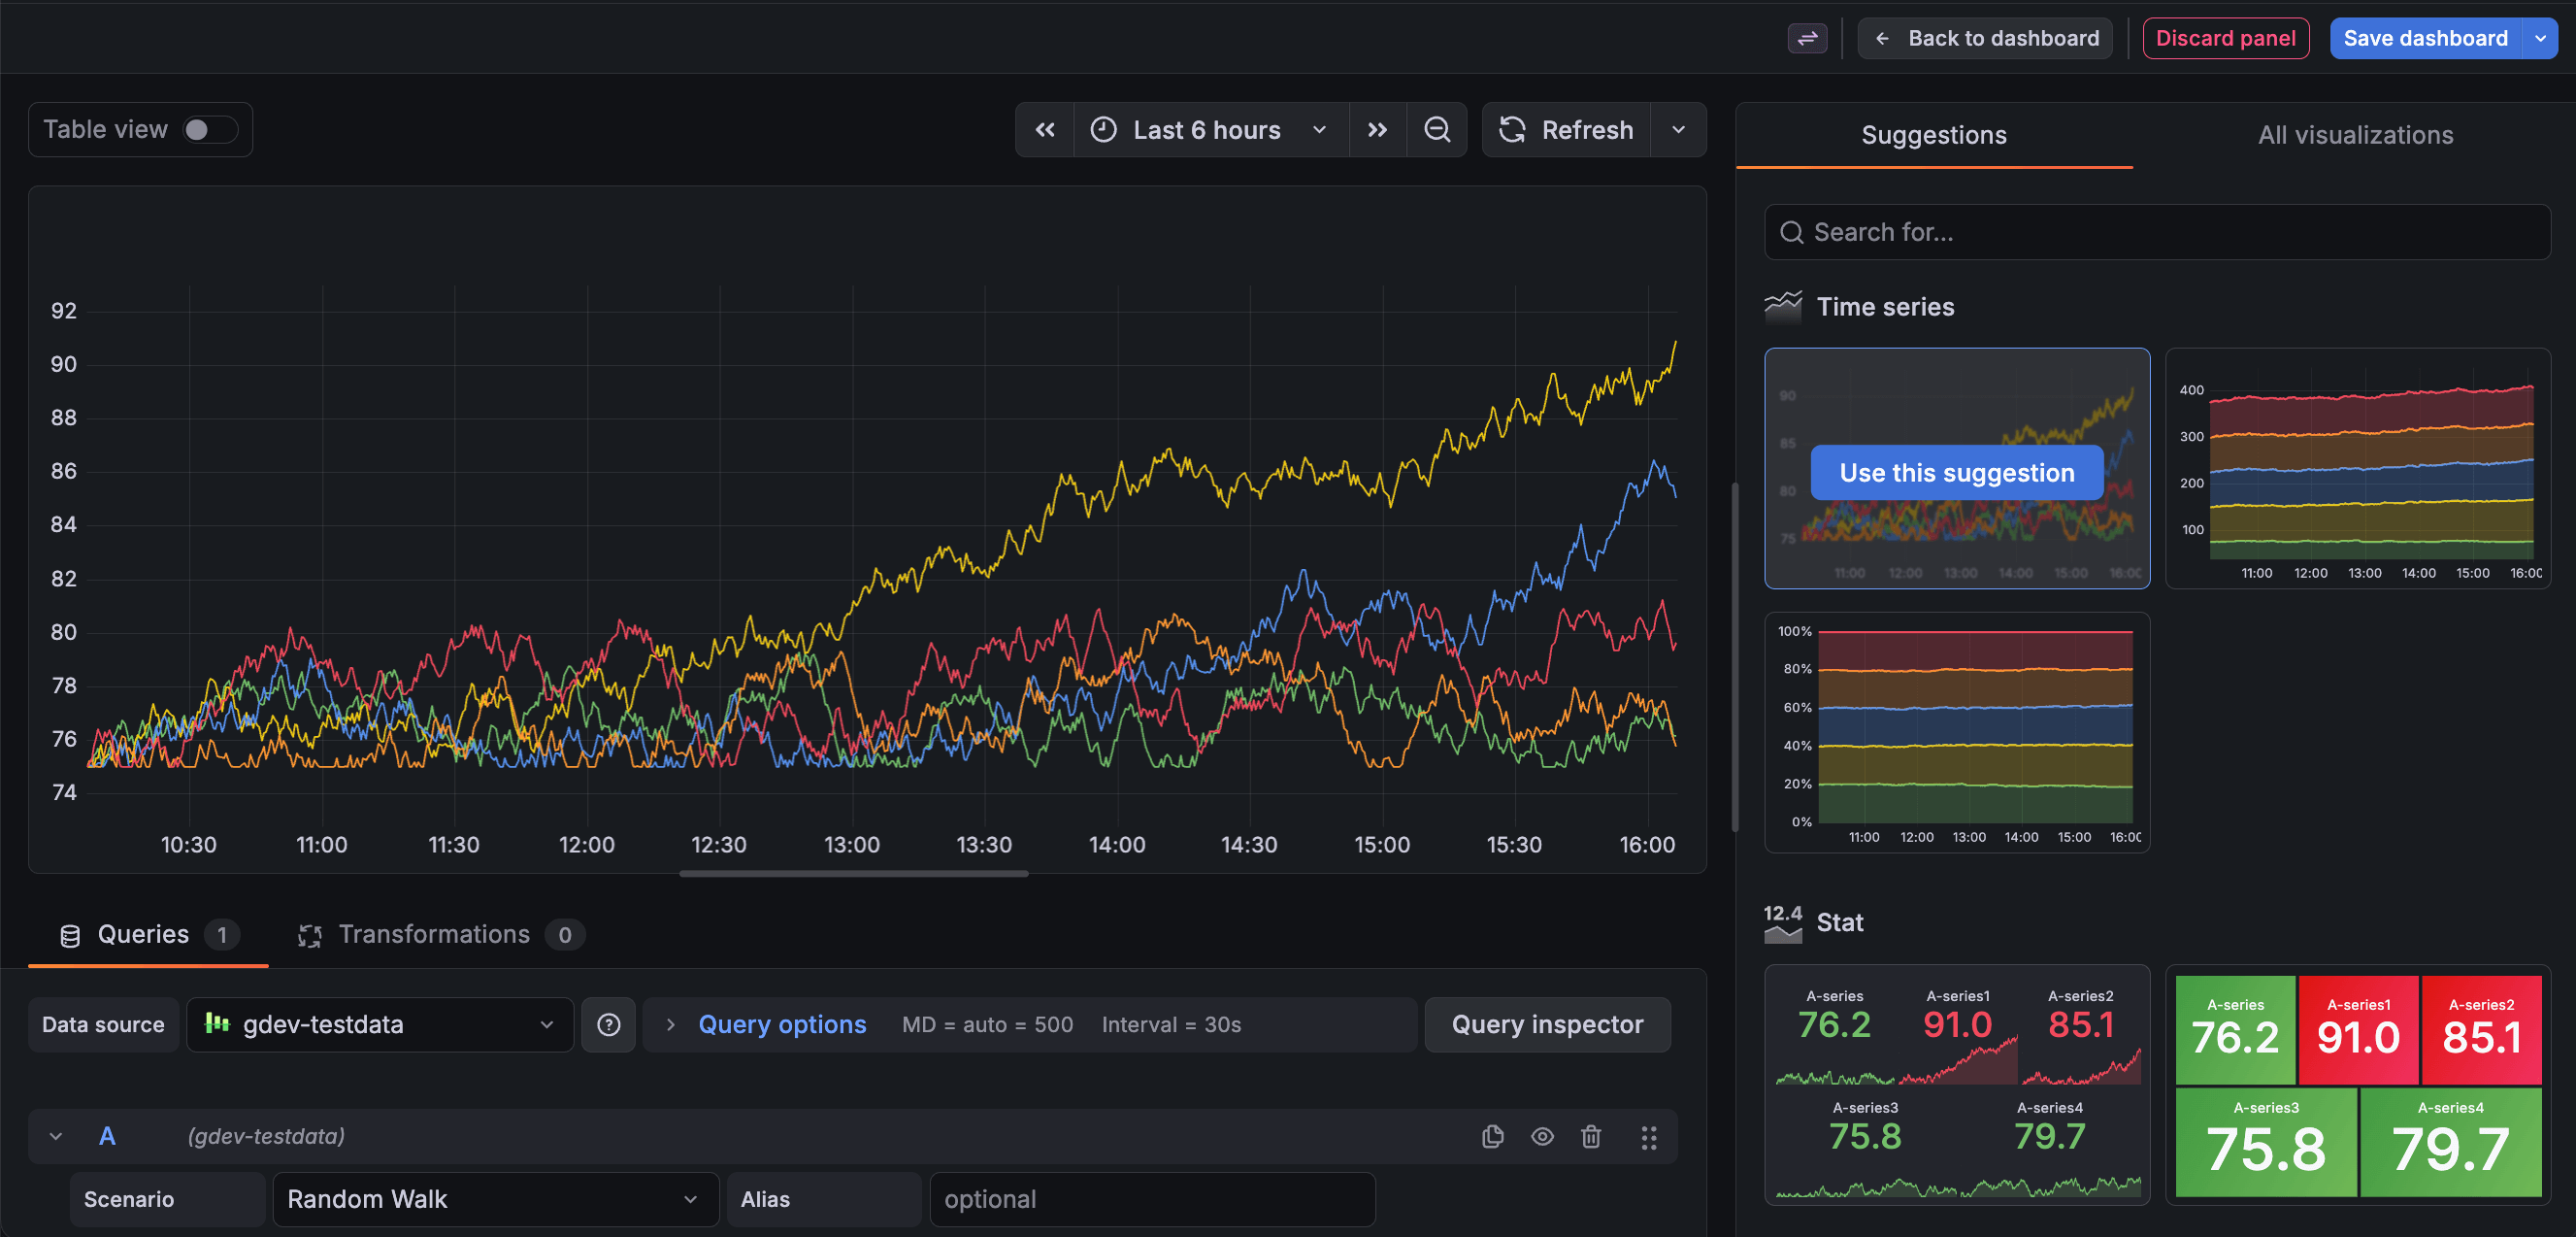
Visualization Suggestions, which were introduced in Grafana 8.3.0, have been updated to provide more applicable suggestions, and are now the default method to select a panel visualization.
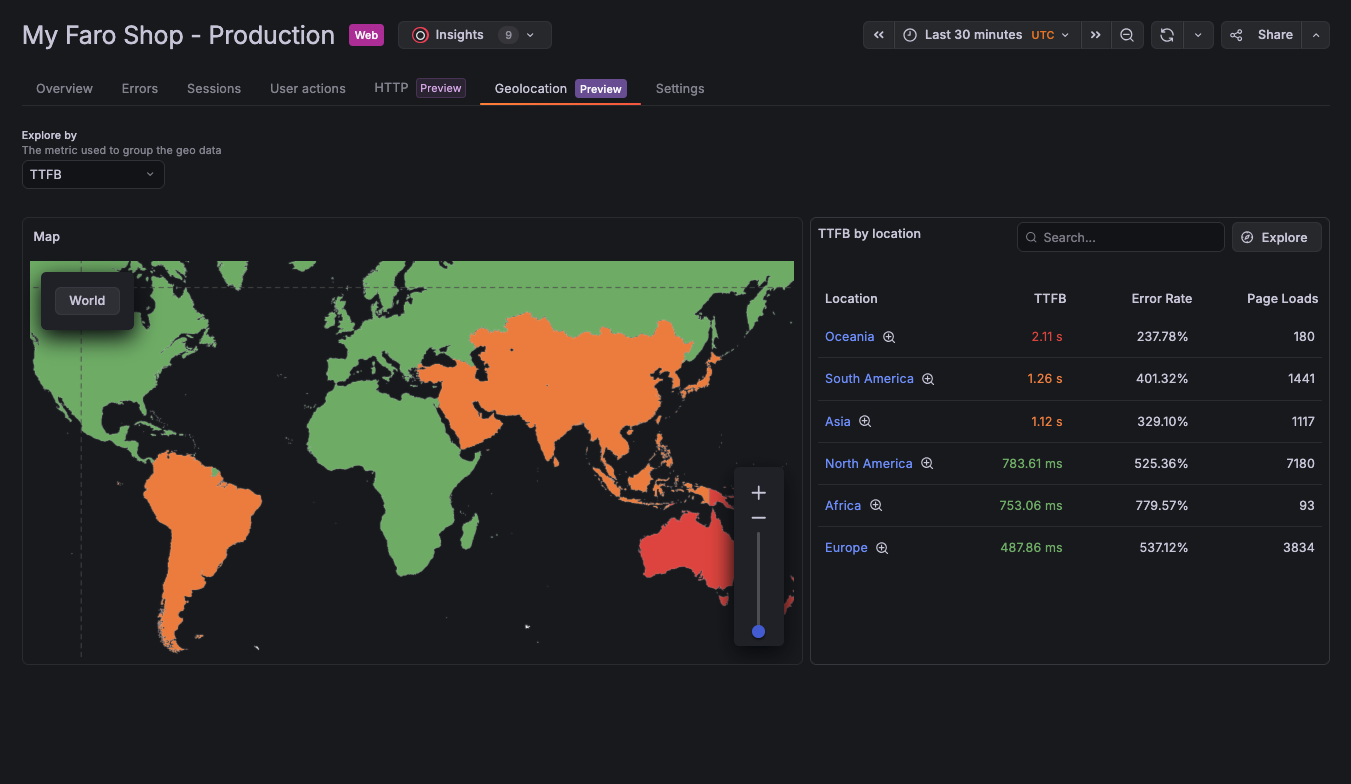
Teams can now quickly spot geographic patterns in performance and errors and drill into the regions driving issues. The new Geolocation tab turns location data into an interactive investigation experience, making it easy to identify hotspots, compare regions, and understand why users are impacted.
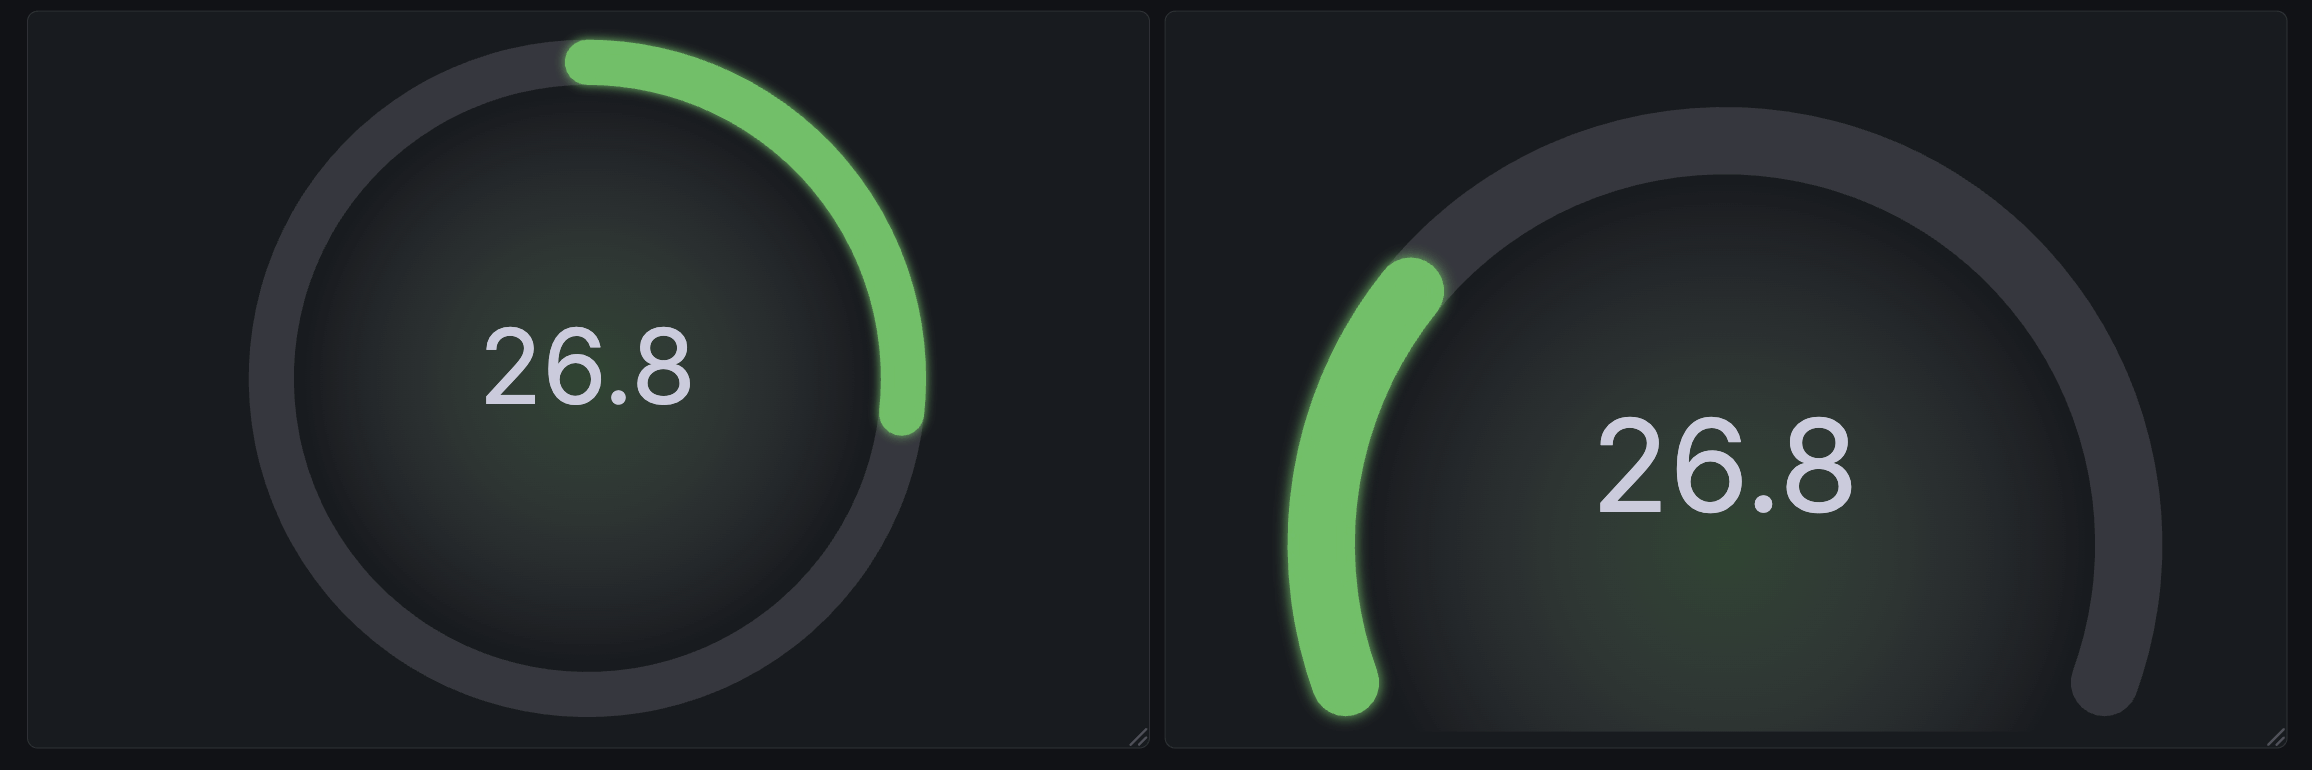
We’ve reimagined the gauge visualization to provide more options and several new variations to make your dashboards more informative and more appealing.
The Circular shape has been introduced as an alternative to the existing Arc gauge under the new Style option.
We’re excited to introduce time range pan and zoom in Grafana dashboards and panels!
We’ve added new ways to travel through time in dashboards and panels to make exploring your metrics and data more intuitive and efficient.