What's new from Grafana Labs
Grafana Labs products, projects, and features can go through multiple release stages before becoming generally available. These stages in the release life cycle can present varying degrees of stability and support. For more information, refer to release life cycle for Grafana Labs.
Loading...
Area of interest:
Cloud availability:
Cloud editions:
Self-managed availability:
Self-managed editions:
No results found. Please adjust your filters or search criteria.
There was an error with your request.
In January 2026, we released the revamped gauge visualization in public preview. This new experience is now generally available. For a full description of the changes, refer to the public preview announcement.
At Grafana, we believe all data deserves visibility. That’s the heart of our Big Tent philosophy. Whether your data comes from cloud-native systems, modern SaaS tools, or long-standing enterprise databases like IBM DB2, it should be easy to explore and visualize in one place. For many organizations, DB2 powers some of their most critical systems. Now, you can bring that data directly into Grafana and see it alongside the rest of your telemetry.
Grafana Alerting has added the ability to create multiple policy trees for Alertmanager, allowing for smaller, independently managed policy trees.
This enables individual provisioning and lifecycle management of policies instead of one single policy tree, resulting in clearer organization of routing logic by team, service, or domain.
Starting in Grafana v12.4, plugin processes no longer receive all host environment variables by default. This change improves security by limiting plugin access to environment variables from the Grafana host process.
We’re excited to introduce unified storage for playlists in self-managed Grafana!
When Grafana v12.4 starts, the migration system automatically transfers your playlists from the legacy SQL database to unified storage and validates data integrity after the migration completes.
If your instance is small, Grafana now automatically migrates your folders and dashboards to Unified Storage. While this migration won’t have any visible change in the system, it will prepare you for upcoming storage improvements with zero configuration required.
Easily manage Adaptive Logs on a per-team basis.
Seegmentation to granularly manage Adaptive Logs is now Generally Available. Viewing recommendations, bulk editing, and understand savings impact are now all streamlined into a single-segment specific view. SRE’s can feel more comfortable optimizing safely within team boundaries, and balancing the optimization load with their application teams.
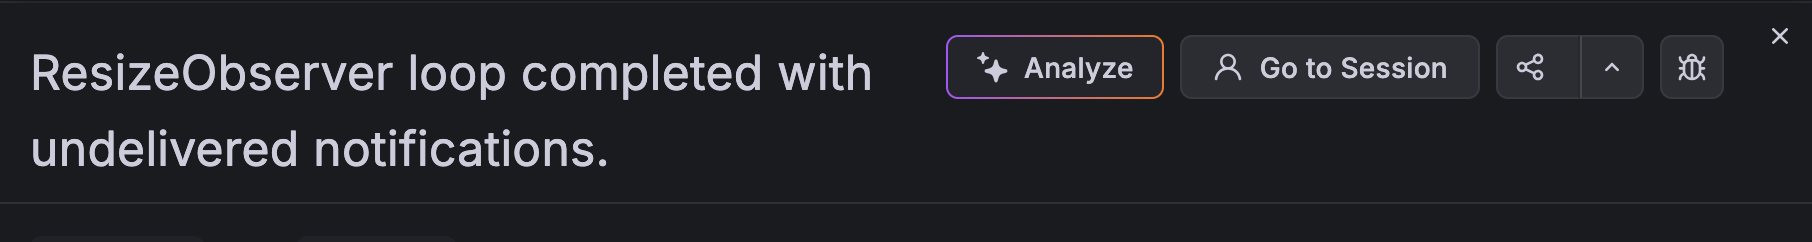
Debugging frontend errors just got easier. From the Errors drawer in Grafana Cloud Frontend Observability, click the Analyze button to kick off Grafana Assistant’s root cause analysis investigation.
Saved queries now supports role-based access control (RBAC), giving teams a clearer and safer way to share and manage queries.
Saved queries are now shared by default: all users with access can reuse them, while only users with the Writer role can create, edit, or delete them. This replaces the previous per-query sharing checkbox with consistent, role-based permissions.
You can now configure default columns for Logs Drilldown directly from the plugin configuration page.
This new capability allows administrators to define which fields (or columns) are displayed by default based on the selected set of labels. Instead of relying on a static column setup, the logs view can now support a pre-configured default state per service, or set of services, ensuring users immediately see the most relevant information for their use case.
You can now save a log exploration in Logs Drilldown and return to it later.
Saved explorations include your active filters, so you don’t have to recreate the same view each time you investigate an issue.
Pending periods have been added to NoData and Error alert states in Alerting to help reduce noise by preventing notifications triggering after first evaluation and giving you more granular control. Now, NoData and Error alerts honor the same pending period as regular alerts. Notifications are sent only after the pending period elapses.
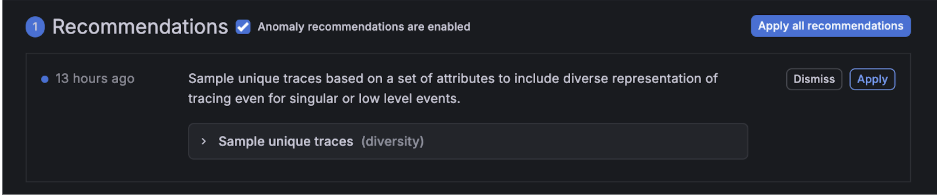
Easily and confidently optimize trace storage while ensuring even your smallest sets of traces are represented.
Diversity sampling captures at least one trace for each unique trace combination (fingerprint) within a fixed time window. These combinations are defined by attributes such as service, route, and status code. With this baseline coverage in place, you can reduce probabilistic sampling rates and avoid creating and managing additional policies just to make sure developers find the traces they need.
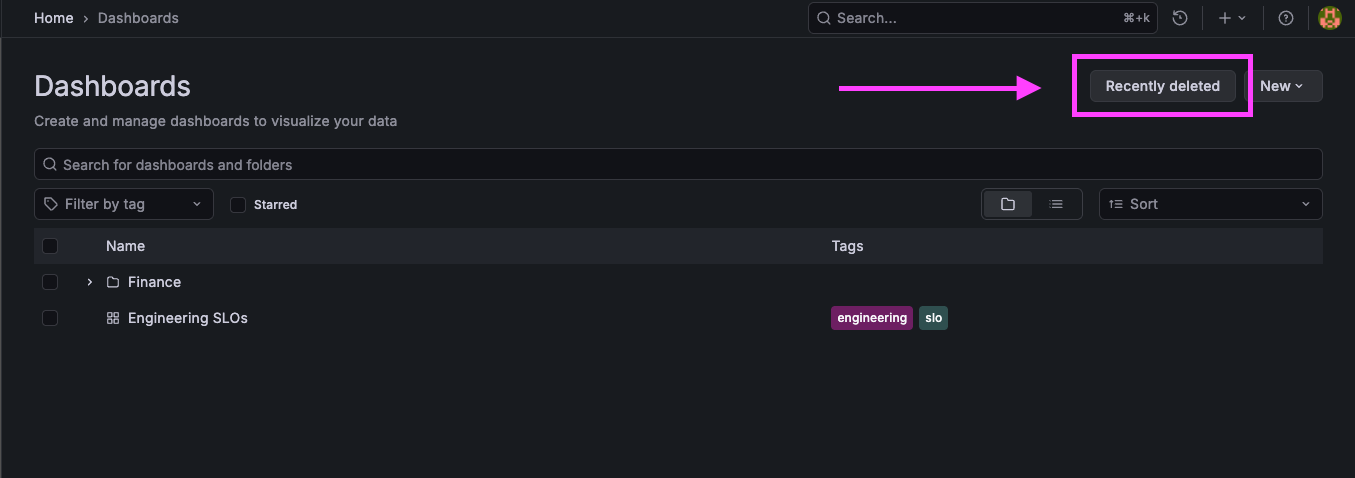
Restore Dashboards is in Public Preview! We would love your feedback, you can share it here.
You can restore dashboards you’ve deleted, no support ticket needed. With the new Recently deleted view, accidentally removing a dashboard no longer means lost work or rebuilding panels from scratch.