What's new from Grafana Labs
Grafana Labs products, projects, and features can go through multiple release stages before becoming generally available. These stages in the release life cycle can present varying degrees of stability and support. For more information, refer to release life cycle for Grafana Labs.
Loading...
Area of interest:
Cloud availability:
Cloud editions:
Self-managed availability:
Self-managed editions:
No results found. Please adjust your filters or search criteria.
There was an error with your request.
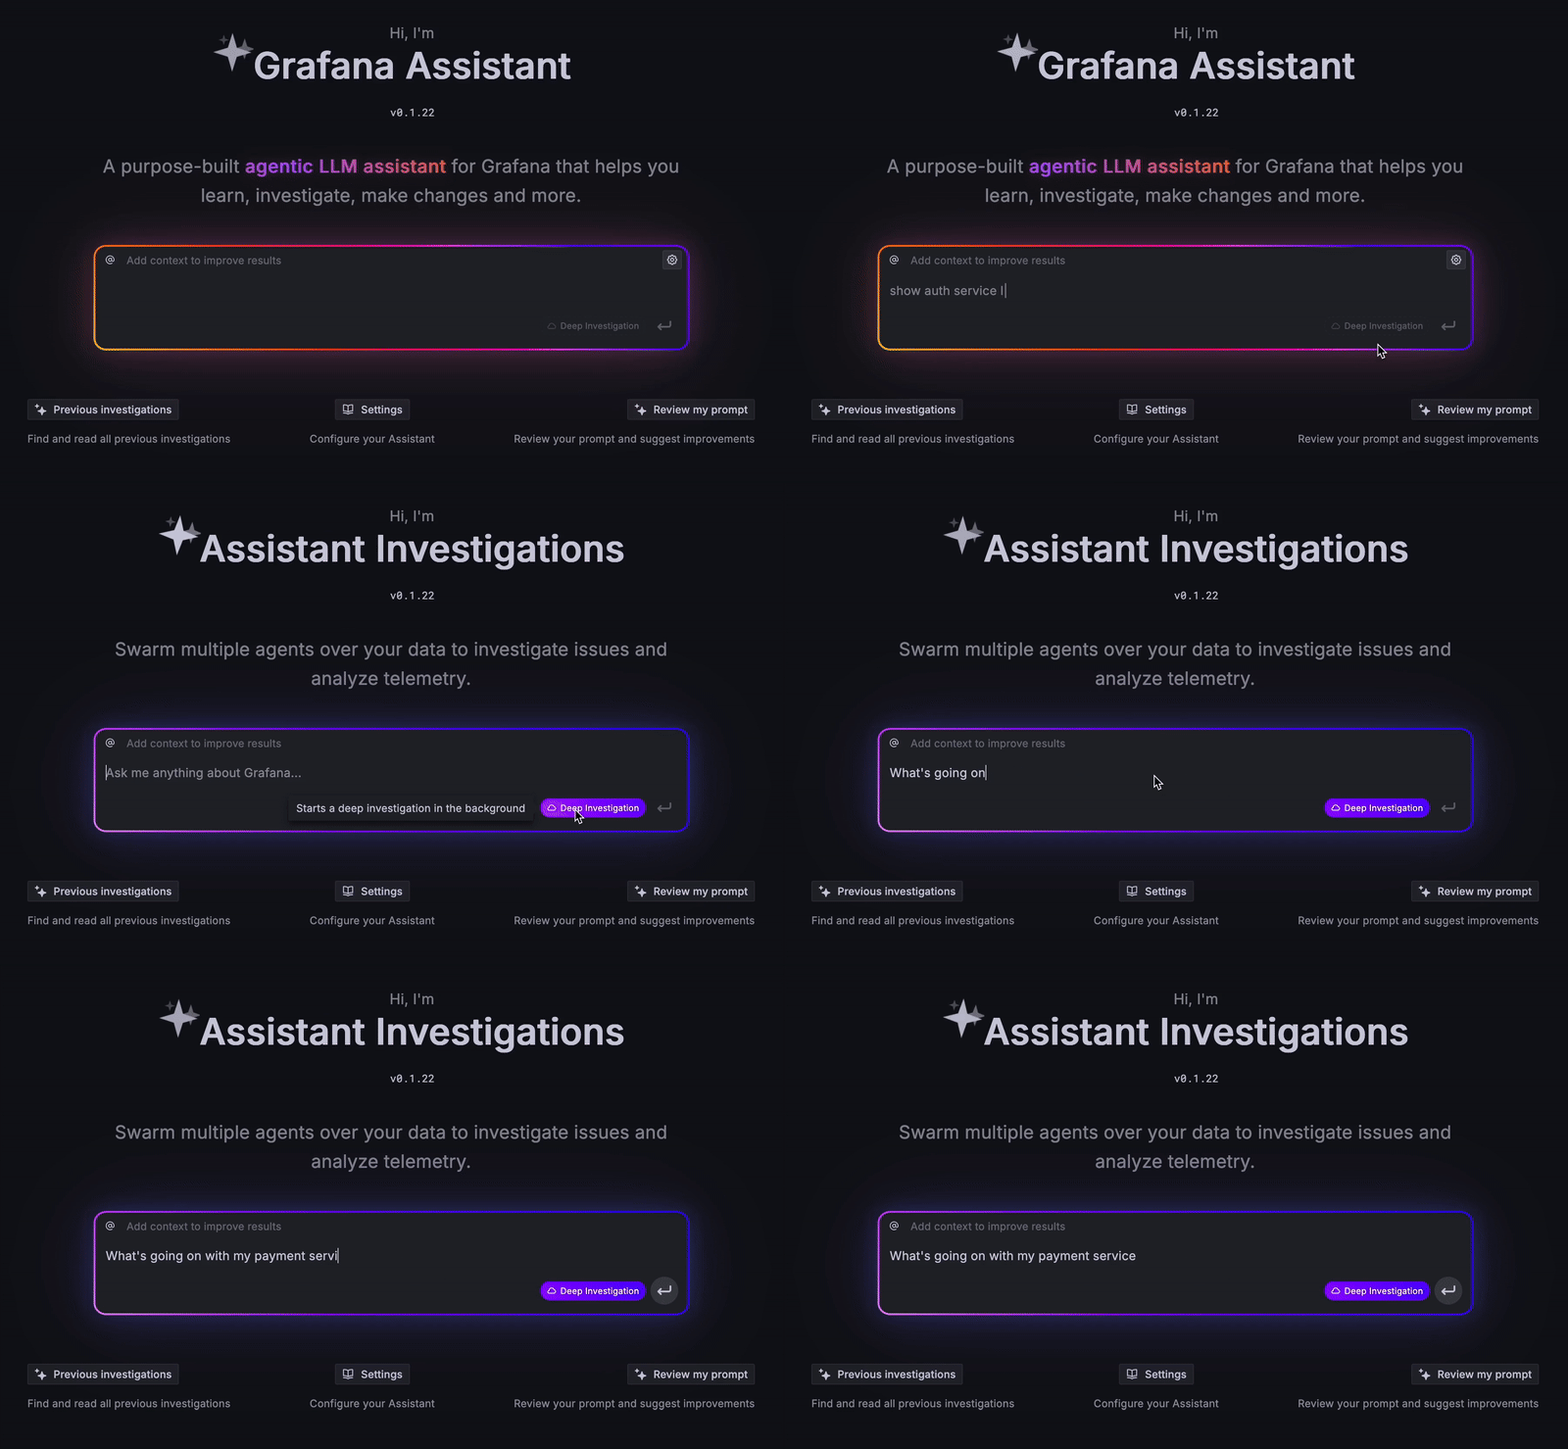
We are excited to announce the Public Preview of Grafana Assistant Investigations in Grafana Cloud.
Assistant Investigations gives you a faster path from “what is happening” to “what to do next.” When an incident spans services or signals, you switch the Assistant to Investigation mode, describe the problem, and let specialist agents explore metrics, logs, traces, profiles, and even SQL in parallel. The workflow runs inside Grafana Cloud, respects your permissions, and keeps findings grounded in your telemetry.
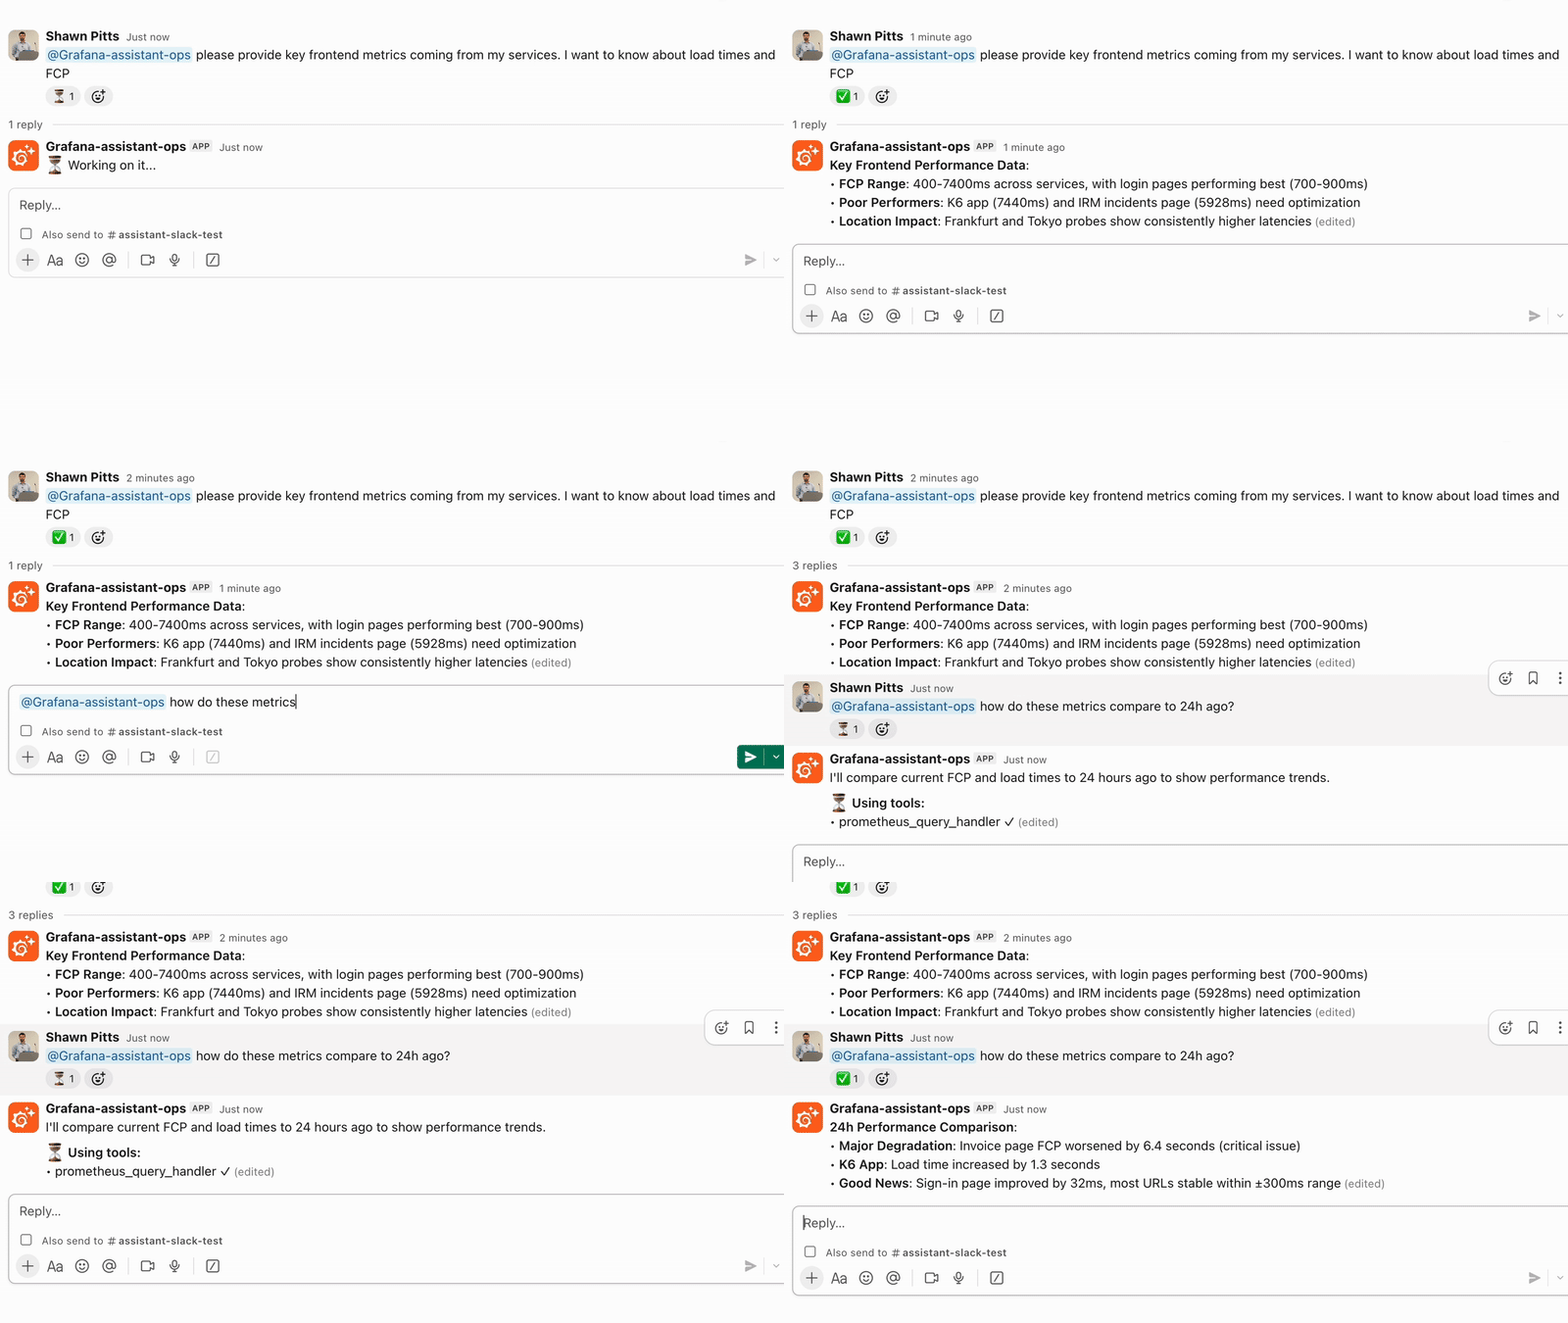
We are excited to announce the Private Preview of Grafana Assistant in Slack. It brings the Assistant experience to Slack and meets your team where they already work. Ask questions, generate or refine queries, and get guided next steps without context switching. When you need deeper context, follow the links back into Grafana and keep moving.
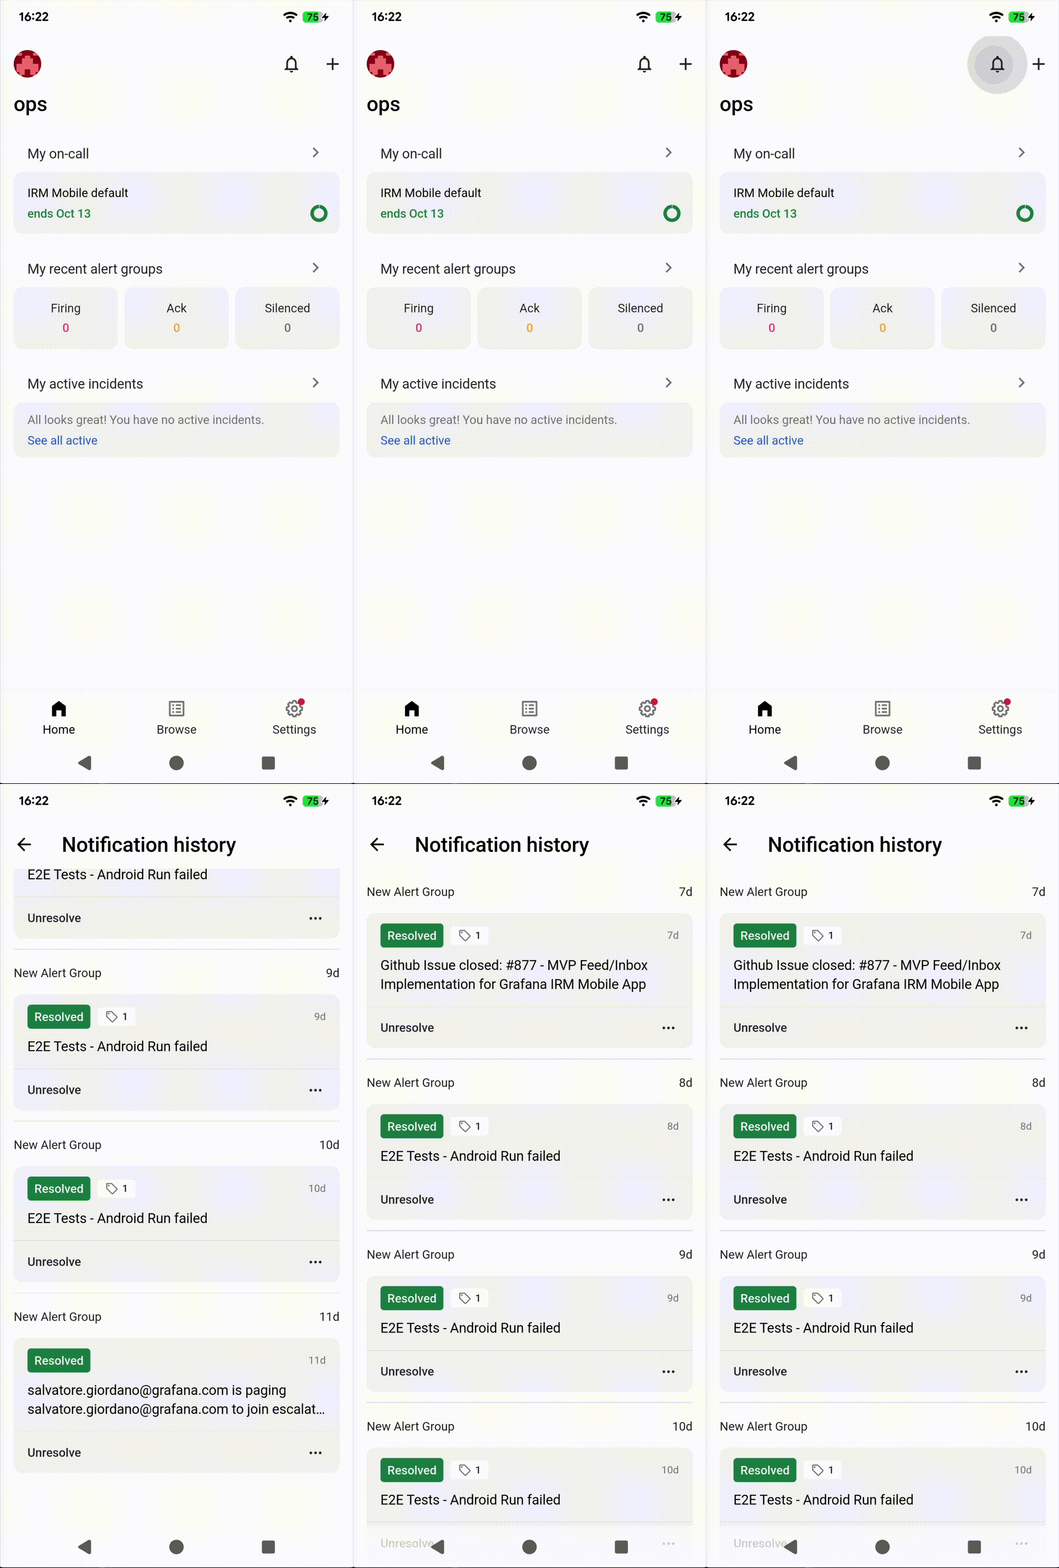
Keeping track of your notifications can be challenging. Smartphones are swarmed with notifications, and it’s easy to swipe away an important notification.
That’s why we’ve added a “Notification History” feature to the IRM Mobile App, so you can track down the notifications you’ve received and review important events in chronological order.
Manage and optimize your Grafana Cloud usage and spend with a new experience
We’re excited to announce the general availability of the Cost Management and Billing app for Grafana Cloud! This redesigned experience provides a central place to manage all your Grafana Cloud usage and spend.
The new private networks write role lets viewers and editors manage private datasource connections without needing to be upgraded to the Admin basic role. This is especially useful in Cloud Stacks with lots of teams, where you want people to collaborate without stepping on each other’s work by assigning them as viewers and then selectively granting back capabilities.
The following actions have been removed from Grafana following the deprecation and removal of API Keys:
apikeys:readapikeys:createapikeys:delete
The following roles were also removed:
fixed:apikeys:writerfixed:apikeys:reader
These actions and roles no longer had any effect in Grafana, so this change does not have any user impact.
We’re excited to announce a powerful new feature for our Honeycomb data source: Raw Query support! This enhancement empowers you to leverage the complete capabilities of the Honeycomb API directly within Grafana, unlocking advanced querying. This feature includes full support for variable substitution and automatic handling of array filters (e.g. with IN and NOT IN operators), making it easier to work with multi-value variables.
Translate your plugin
Internationalization of plugins is here! You can now make your plugin more user-friendly by translating it into multiple languages. You can find the list of available languages in GitHub, and how to translate plugins in our docs page. For Microsoft users, we’ve added translations to MS SQL and Azure Monitor data sources.
We are excited to announce the v1.0 release of the Grafana k6 Operator, a major milestone that brings more predictability and stability to running distributed performance tests on your Kubernetes clusters. The k6 Operator simplifies performance testing at scale, allowing you to test services inside private clusters and coordinate tests across multiple nodes without adding operational complexity.
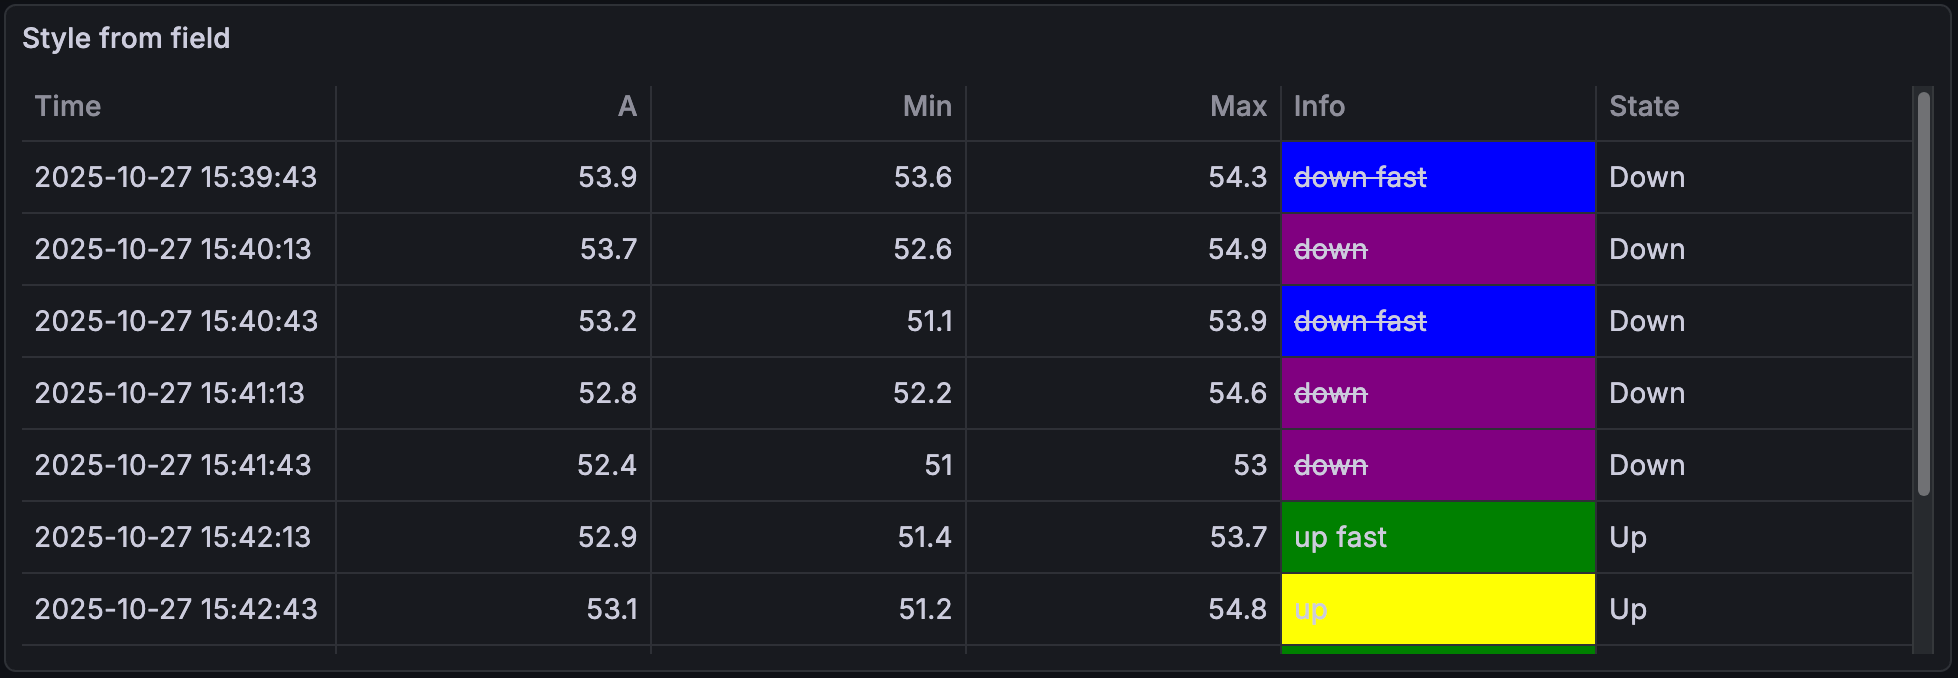
Style table cells with CSS properties with the Styling from field cell option. Using JSON object syntax with CSS properties, you can apply that styling to your table cells.
You can now put guardrails in place by enforcing a maximum expiration date for all newly created Cloud Access Policy tokens. This gives you stronger control over credentials and helps ensure your security and compliance standards are met.
Introducing the SCIM Configuration UI in Grafana.
We recently announced SCIM for user and group provisioning in Grafana, and now we’re excited to announce that SCIM configuration is easy with the SCIM Configuration UI. Here you can easily toggle SCIM configuration options without restarting your instance, find information like your Tenant URL, Domain, and Stack ID for configuring SCIM in your IdP, and learn how to create a service account and token with the correct permissions.
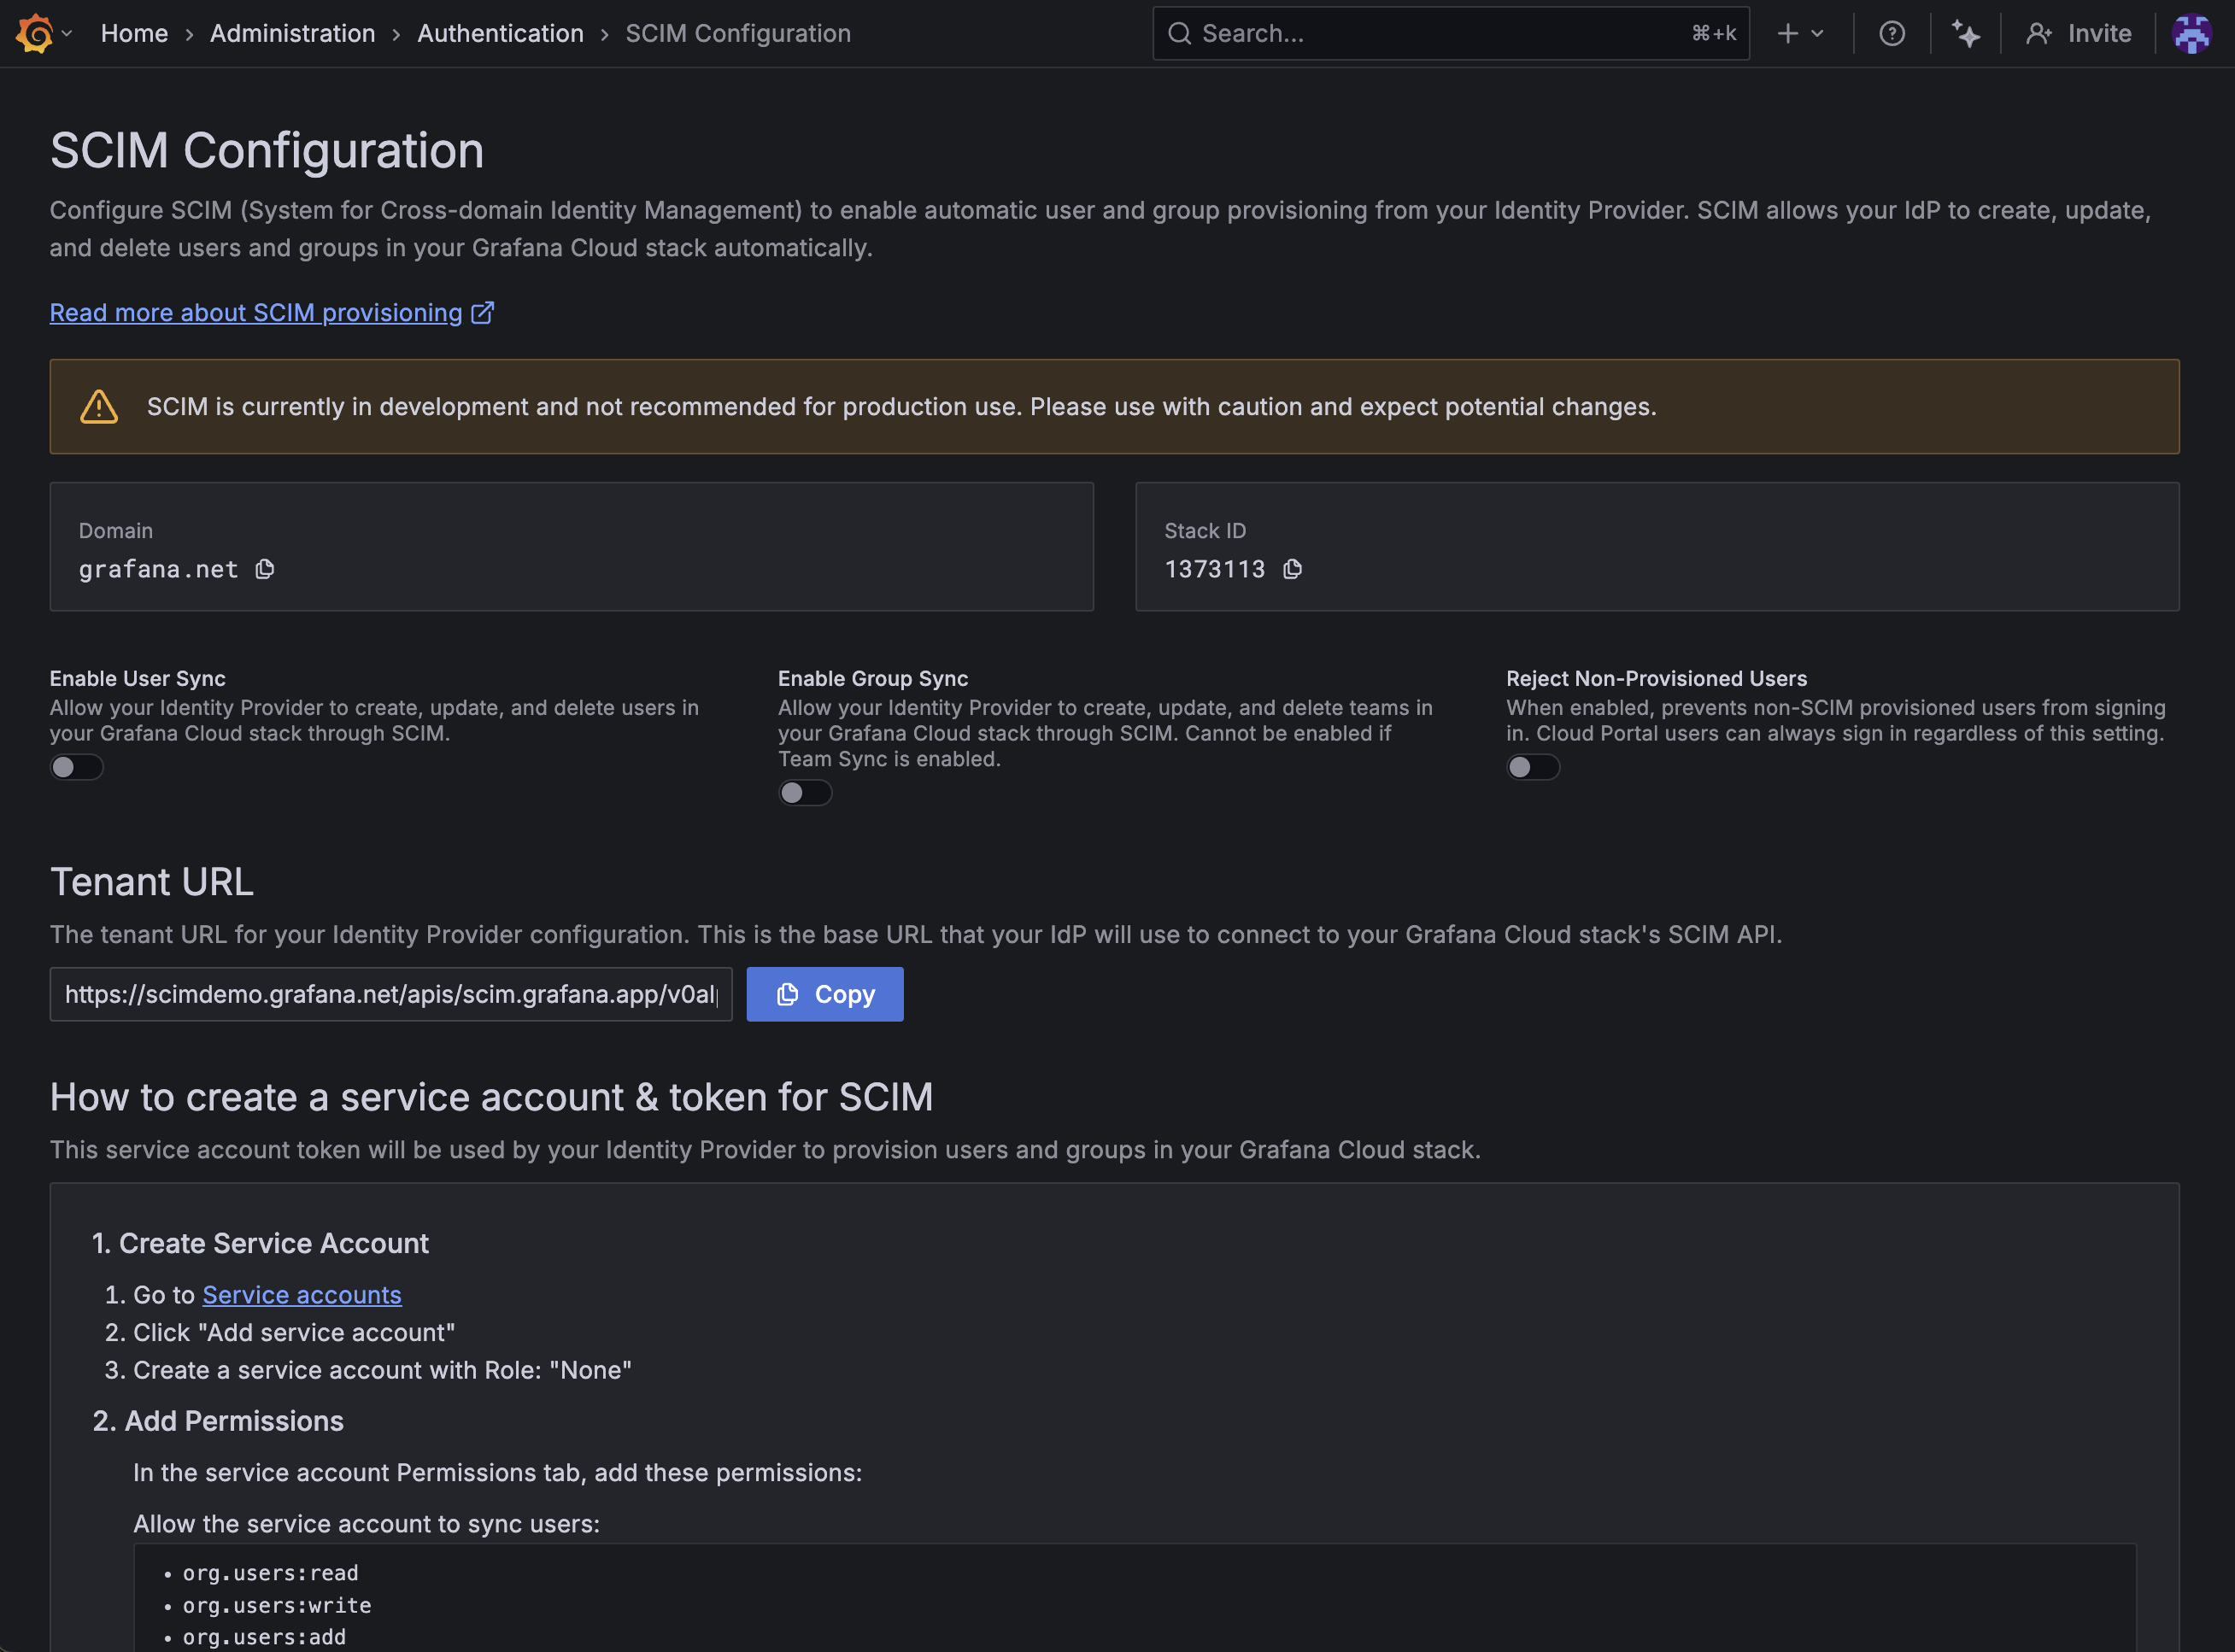
Effective starting in Grafana 12.2, the auth.scim configuration option allow_non_provisioned_users is removed, and replaced with reject_non_provisioned_users.
The reject_non_provisioned_users setting in Grafana defaults to false. When enabled, non-SCIM provisioned users are prevented from signing in. Cloud Portal users can always sign in regardless of this setting.
We’ve introduced the ability to save queries in Dashboards and Explore! With this addition, you can save and reuse queries, as well as share them with others in your organization.

We’ve updated our source map functionality for Grafana Cloud’s Frontend Observability. It’s now easier to find and delete your uploaded source maps right from the UI. This gives you more control over your data and makes it easier to keep your environment organized.