What’s new in Grafana Cloud
Grafana Labs products, projects, and features can go through multiple release stages before becoming generally available. These stages in the release life cycle can present varying degrees of stability and support. For more information, refer to release life cycle for Grafana Labs.
No results found. Please adjust your filters or search criteria.
Service account token authentication in OnCall API
We’re excited to introduce service account token authentication for the OnCall API. With this change, you can now generate tokens to interact with the API so that they:
- Aren’t tied to any specific user.
- Can be enabled or disabled as needed.
- Can be set to optionally expire at a given time.
- Can be scoped to a specific set of permissions for more granular control.
In addition, this update allows us to extend the Terraform provider to support this authentication method in the OnCall client. This lets you to configure and manage your Grafana stack, including OnCall resources, all without needing to create an OnCall-specific API token, which simplifies automation and enhances security.
Recommendations in Grafana Cloud k6
The Grafana Cloud platform and Grafana Cloud k6 application include a broad range of features that can help you maximize the value you get for your testing strategy. But, with several features to learn, sometimes it can take time to figure out where to start.
The new Recommendations tab in the test run View of Grafana Cloud k6 is an intelligent tool that analyzes telemetry data, such as metrics, logs, and traces, to provide tailored best practices for your team. For example, it might suggest:
- Using other Grafana Cloud products such as Synthetic Monitoring
- Exploring Grafana Cloud k6 features such as Private Load Zones
- Correlating Results with Grafana Cloud Traces
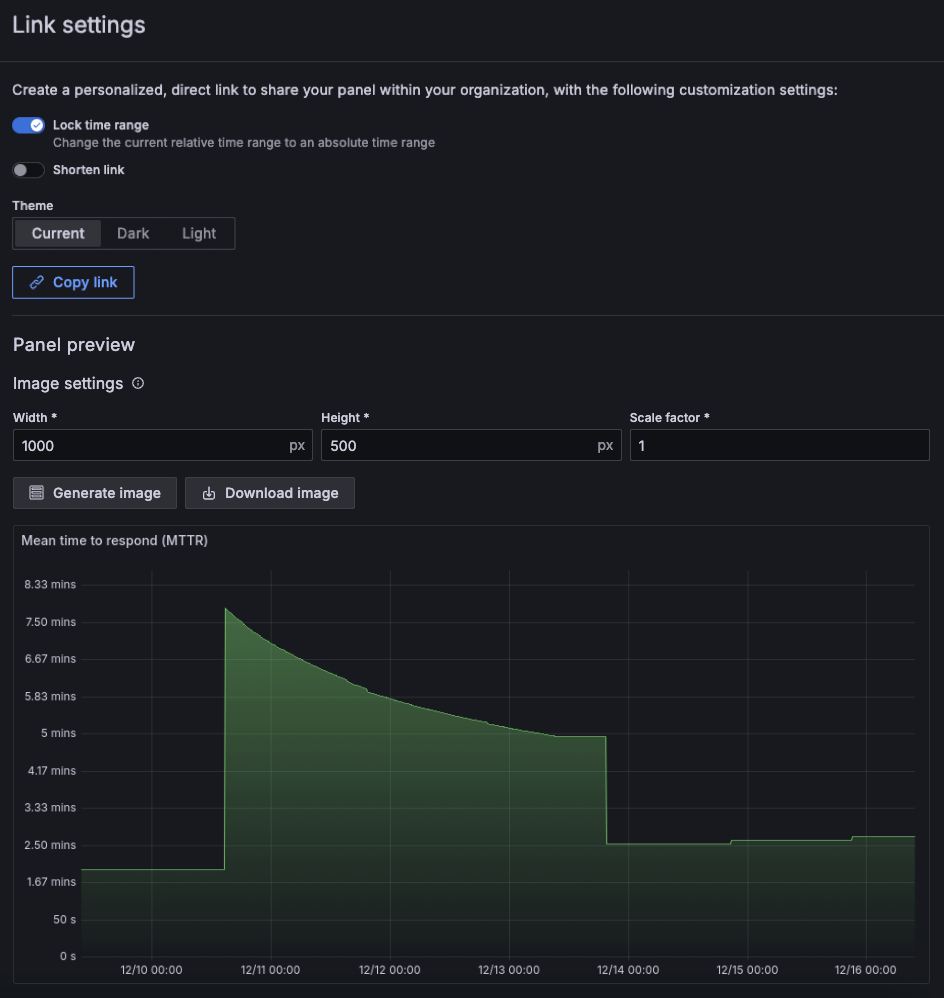
We’ve made some big changes to the panel image sharing experience. When you share a panel link, there’s a new Panel preview section where you can:
- Customize a panel image.
- See a preview of the panel image.
- Download and share the image without a URL.
You can customize the image by updating the width, height, and scale of it:

New Grafana Cloud k6 HTTP API is generally available
We’re excited to announce that a new version of the Grafana Cloud k6 API is now available!
The new Grafana Cloud k6 API includes endpoints that make it easier for teams to integrate k6 with their CI/CD processes. You can:
- Start and stop test runs
- Start a test run with a test ID
- Upload and download scripts
- Manage project limits
- Save and unsave test results
- Get cost estimates and execution cost for test runs
- Inspect the test run lifecycle
Grafana SLO now supports Grafana-managed alert rules
Grafana-managed alert rules are now supported in Grafana SLO!
Grafana-managed alerting rules gives you access to features like alerting annotations on SLO dashboard panels, SLO alert state history, and images in SLO alert notifications.
Your alerting system can be managed via plugin preferences, and can be set to generate either datasource-managed alert rules, or Grafana-managed alert rules. Check out the documentation for more information.
Redesigned filters for dashboards is GA
In October 2024, we announced our redesigned dashboard filters. Now we’re promoting this redesign from public preview to GA.
The redesigned filters are more prominent in the dashboard and filters based on the same ad hoc filter variable are more clearly related. Also, labels can have more than one value using the new multi-select operators. For more information about these changes, refer to the original What’s new entry.
Faster TraceQL queries with anchored regular expressions in Grafana Cloud Traces
TraceQL queries now use regular expressions that are anchored at both ends. This change makes the queries faster and matches the behavior of PromQL, where regular expressions are also fully anchored.
This is a breaking change, where the query:
{ span.foo =~ "bar" }
is now treated as:
{ span.foo =~ "^bar$" }.
Datadog percentile aggregation and new query variable syntax
The Grafana Datadog plugin now includes two new features:
- Percentile Aggregation Function for distribution-type metrics.
- New Query Variable Syntax – now supports all tags associated with a metric.
For more details, check out Grafana Datadog data source documentation.
Query CloudWatch Logs Insights with PPL and SQL
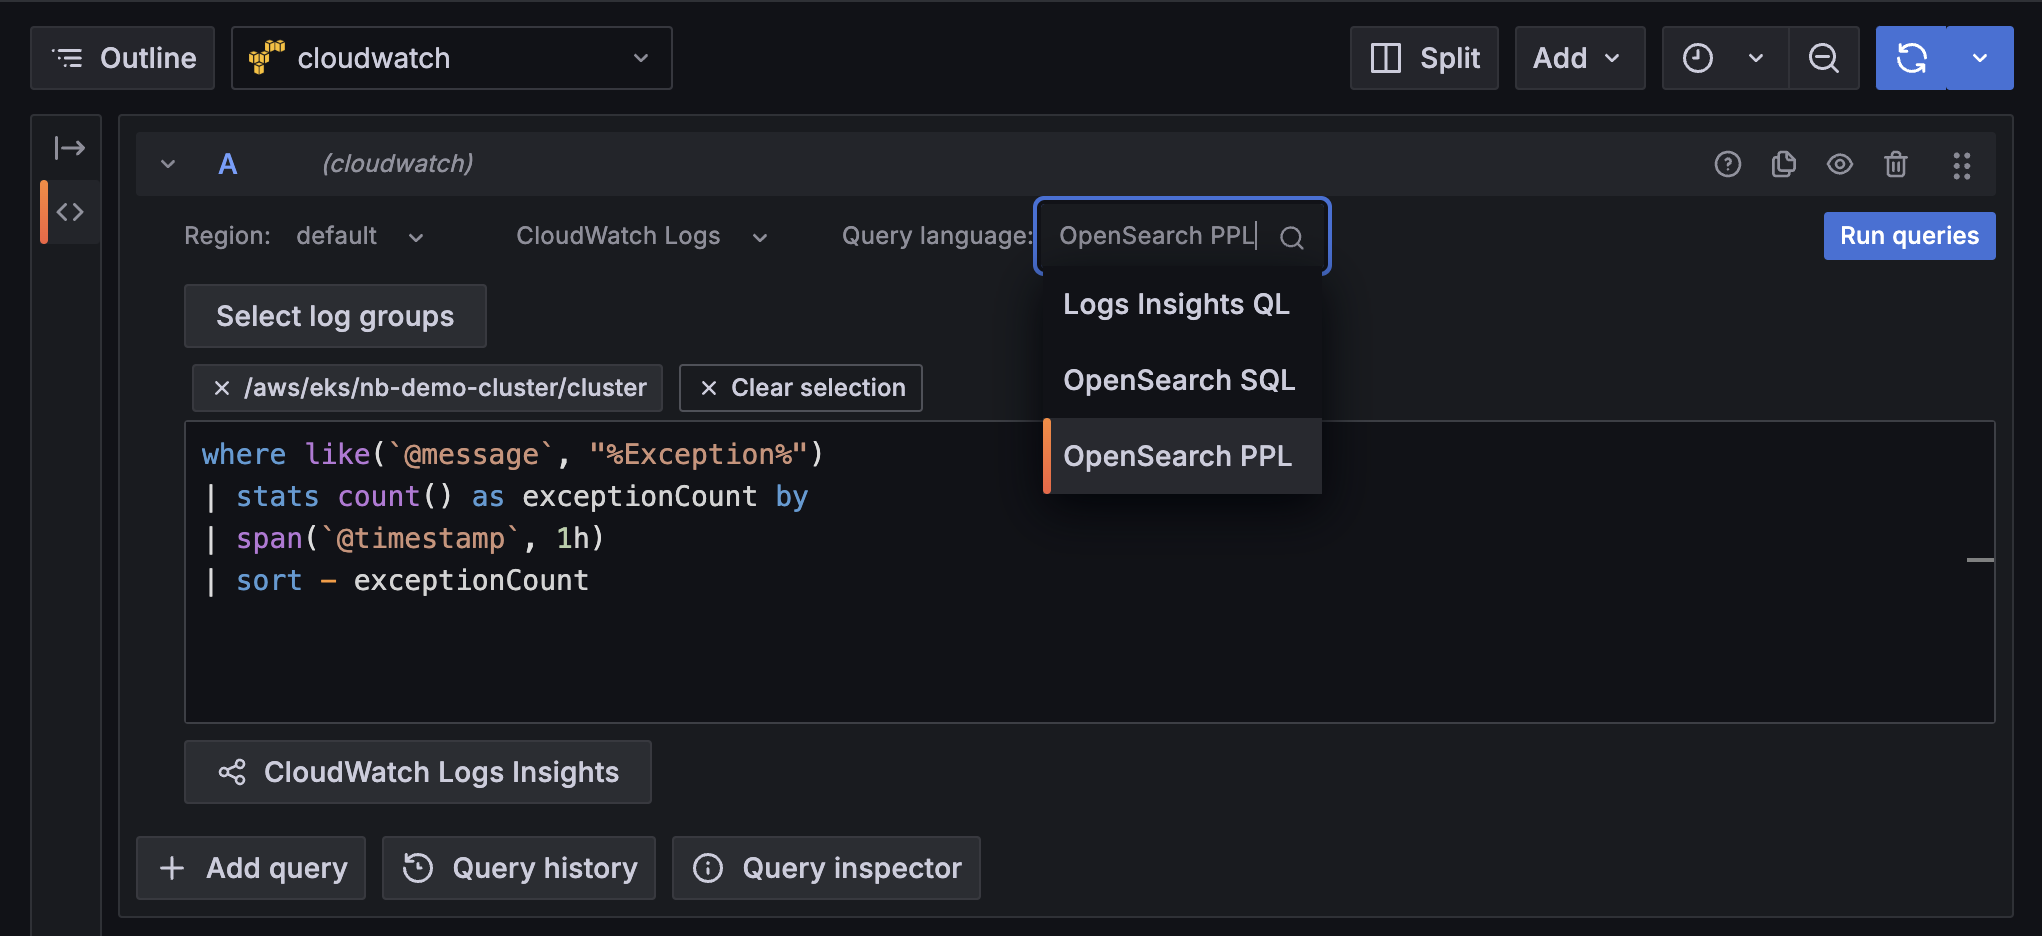
The AWS CloudWatch data source plugin now offers two new query languages for searching through logs: OpenSearch PPL and OpenSearch SQL. You now have increased flexibility to choose a more familiar query language and to take advantage of their unique features (like the SQL JOIN command) when querying AWS CloudWatch Logs Insights. In addition to the already supported Logs Insights QL option, you can find the added query language options in the new Query language drop-down list.

PDF export improvements in GA
In May 2024, we announced a new way of generating PDFs that introduced a major performance improvement for the PDF export feature. It also fixed all caveats related to rendering a report with panels or rows set to repeat by a variable, like rendering repeating panels inside collapsed rows.
This new PDF generation method now replaces the old one and is generally available for everyone.
ML-enhanced guidance on SLO target selection
Many teams struggle with picking SLO targets, particularly for new SLOs. The target percentage drives the sensitivity of the burn rate calculations, the error budget remaining, and it can tune alert volume. If you assume you want to create an SLO to ensure “99.5% of HTTP requests return successfully in under 500 ms”, how do you know that 99.5% is a realistic target for your service? People often guess or take a number from management.
Grafana SLO in collaboration with the Machine Learning team is proud to announce a major enhancement to our SLO creation wizard. After defining an SLO, the “step 2” target selection page now shows ML-enhanced guidance to help you assess the risk of breaching a given target. We query 90 days of history from the metrics used in the SLO definition, and run simulations to predict the likelihood of meeting a given target given the history of the metrics. The user can slide the target percentage and see an updated prediction of the likelihood of meeting that target.
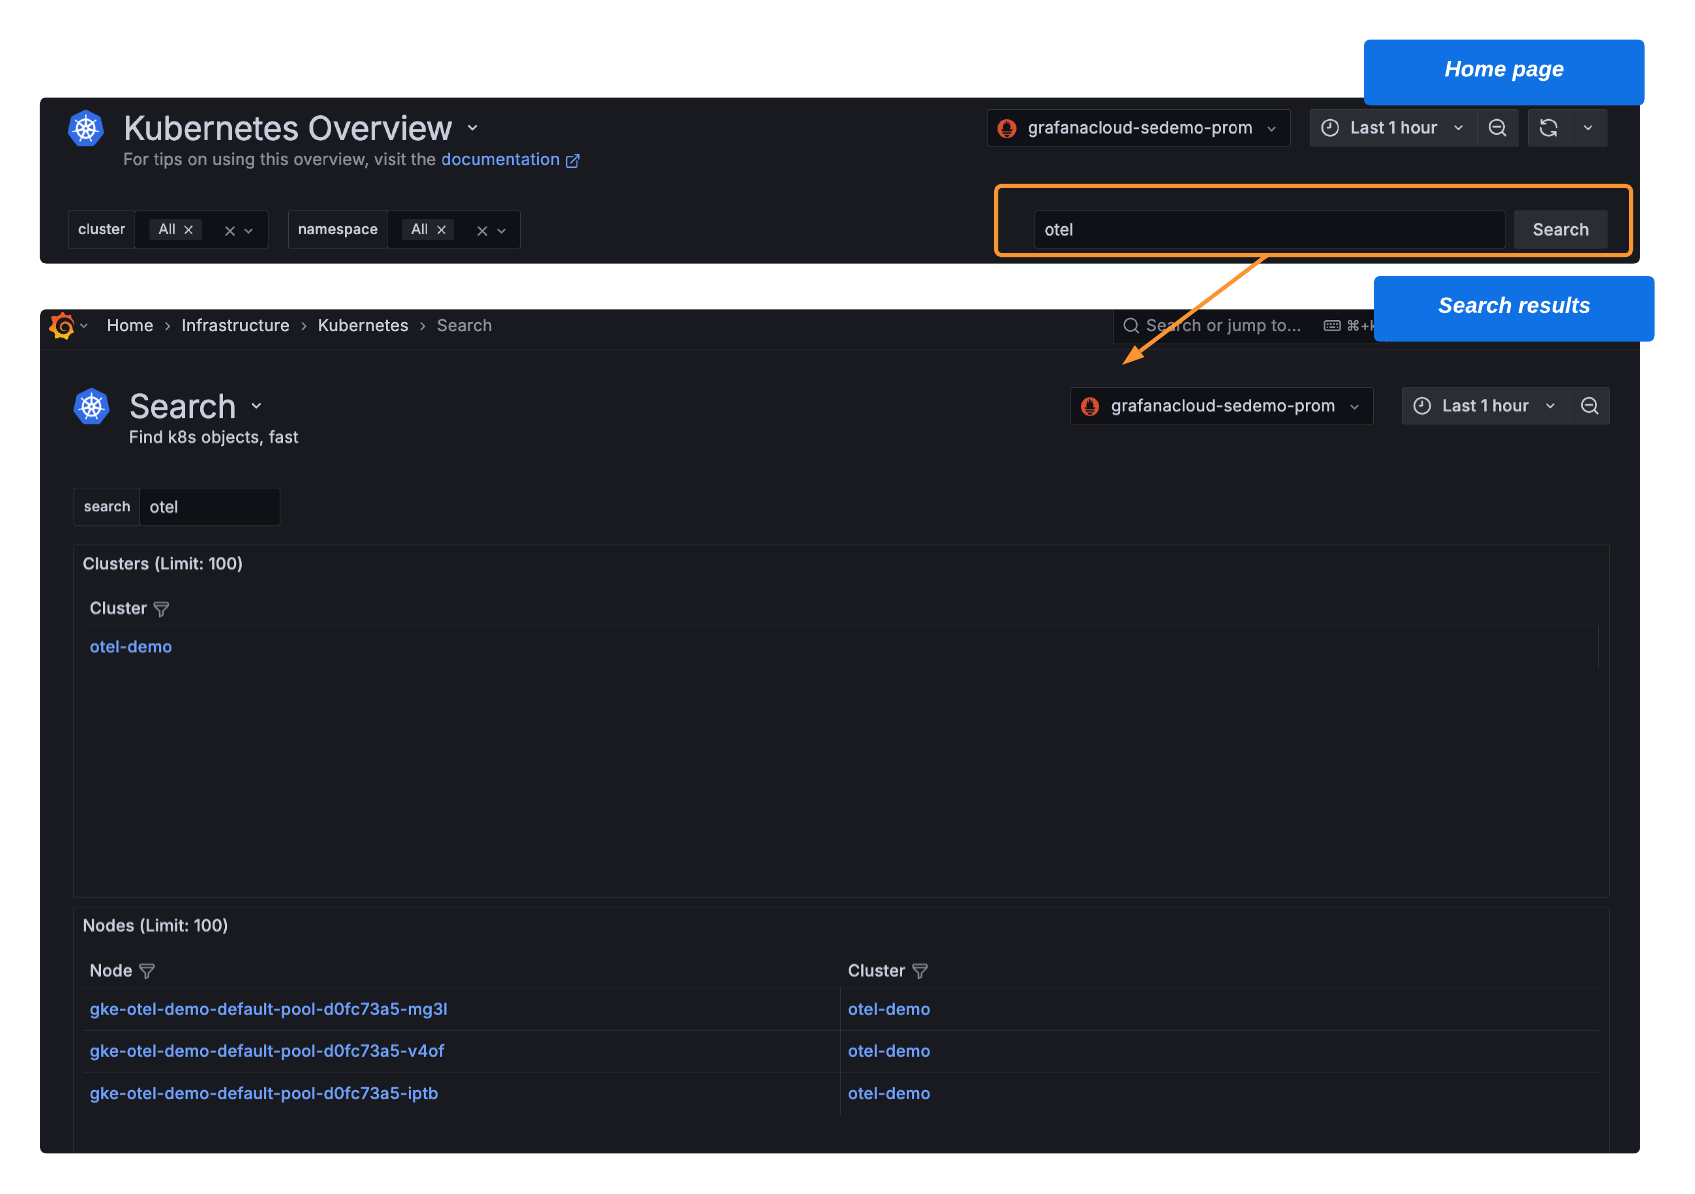
Search in Kubernetes Monitoring
Use Search to find any Kubernetes object in your fleet.

Export a new alert rule definition in Terraform (HCL) format
Create a new alert rule definition as part of a provisioned rule group and export it into Terraform (HCL) format. Copy and paste the code into your Terraform pipeline to create your new alert rule. Previously, you had to add the rule definition to the code manually. Now, you can get that code from the UI, enabling you to quickly deploy and manage alert rules as part of your infrastructure as code.

AWS scrape jobs as code: Streamlined management with Terraform
With the AWS CloudWatch integration, you can scrape your CloudWatch metrics and logs and forward them to Grafana Cloud for a centralized place to monitor and alert on your infrastructure and large scale applications. However, handling AWS scrape jobs at scale can be tedious. Now, manage them as code with Terraform in Grafana Cloud! Scale smarter—quickly create, update, or delete scrape jobs with ease and precision.
Query acceleration for Grafana Cloud Logs
Have you ever had a Grafana Cloud Logs query time out because it tried to process too much data? Query acceleration leverages bloom filters to quickly filter on structured metadata, showing you results faster and making timeouts less likely.
Example use cases where query acceleration are helpful include support-type queries, where you may be looking for an order id, phone number, or similar higher cardinality key value pair. Query acceleration also works well out-of-the-box with OpenTelemetry logs. If you’re not using OpenTelemetry, you can still send structured metadata using Grafana Alloy’s native Loki pipelines.


