What's new from Grafana Labs
Grafana Labs products, projects, and features can go through multiple release stages before becoming generally available. These stages in the release life cycle can present varying degrees of stability and support. For more information, refer to release life cycle for Grafana Labs.
Loading...
Area of interest:
Cloud availability:
Cloud editions:
Self-managed availability:
Self-managed editions:
No results found. Please adjust your filters or search criteria.
There was an error with your request.
Grafana Fleet Management now supports OpenTelemetry Collectors, so you can monitor and remotely configure Grafana Alloy instances and upstream OpenTelemetry Collectors from a single control plane.
You can now select which k6 major version your script targets when you create a test in the script editor. New tests default to v1.x (default). Select v2.x when your script uses the k6 v2.x runtime. Grafana Cloud k6 stores the version on the load test and uses it for future runs, including scheduled runs.
Troubleshoot your entity setup with Knowledge Graph mode
Knowledge Graph mode is a new specialist mode in Grafana Assistant that understands how your entity graph is built, end to end, and helps you work with it: ask why it looks the way it does, fix what doesn’t look right, and add what doesn’t ship by default.
Storing a service account JSON key file to connect Grafana Cloud to Google Cloud is a persistent security liability. Keys get embedded in config files, shared across teams, or quietly forgotten — all while remaining valid for years. When one leaks, there’s no automatic expiry and no limited blast radius.
The BigQuery and Google Cloud Monitoring data source plugins support Google Cloud Workload Identity Federation (WIF) as an authentication method on Grafana Cloud. Instead of uploading a key file, Grafana Cloud exchanges the signed-in user’s OIDC token for a short-lived Google Cloud access token via the Security Token Service. Credentials are scoped to the active session and expire automatically — no keys to store, rotate, or accidentally expose.
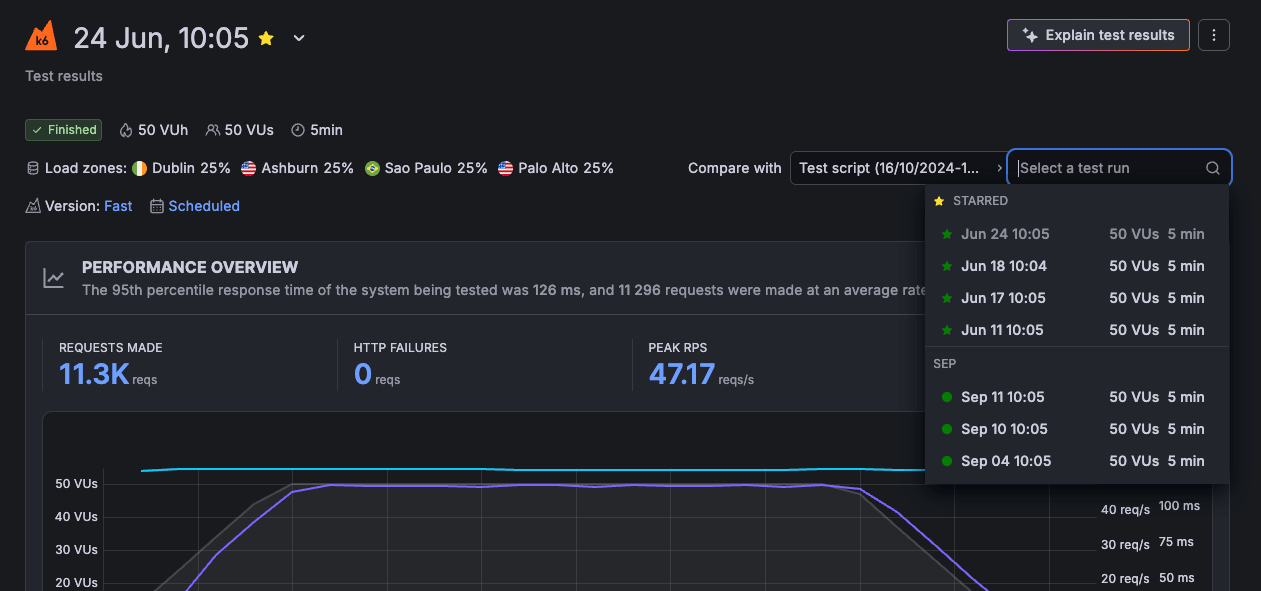
You can now star test runs in Grafana Cloud k6 to mark the results that matter and find them again quickly. Starring gives you one consistent way to flag a test run as a reference point, whether you’re tracking a release, validating a performance optimization, or keeping an important run on hand to compare against.
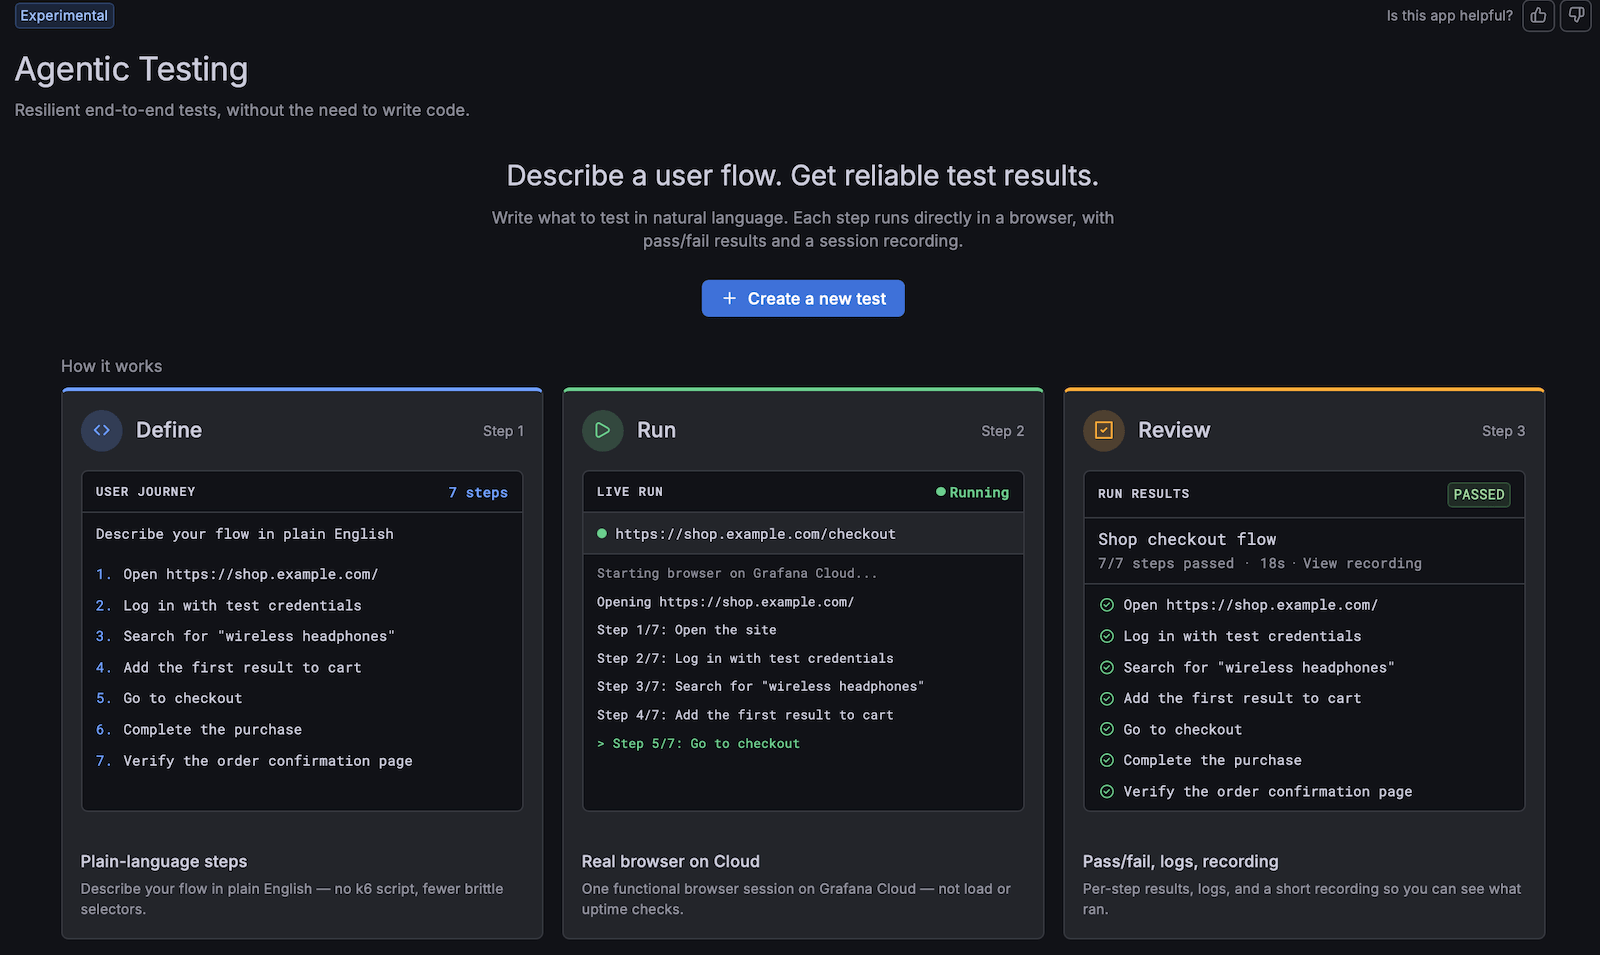
Creating browser tests is now faster and easier with the new experimental Agentic testing experience in Grafana Cloud.
Describe the user journey you want to test, such as signing in, completing checkout, or submitting a form, and Grafana Cloud helps turn that journey into a runnable browser test you can run, review, and iterate on without manually scripting every step.
In Grafana Cloud, the internal Grafana Alertmanager handles Grafana-managed alerts by default.
- New stacks use internal routing by default. Sending to an external Alertmanager isn’t enabled by default.
- Existing stacks move to internal routing by default, plan by plan. If your stack actively sends to an external Alertmanager, it keeps that configuration and continues to work.
Sending Grafana-managed alerts to an external Alertmanager is still supported. If you need it, contact Grafana Support.
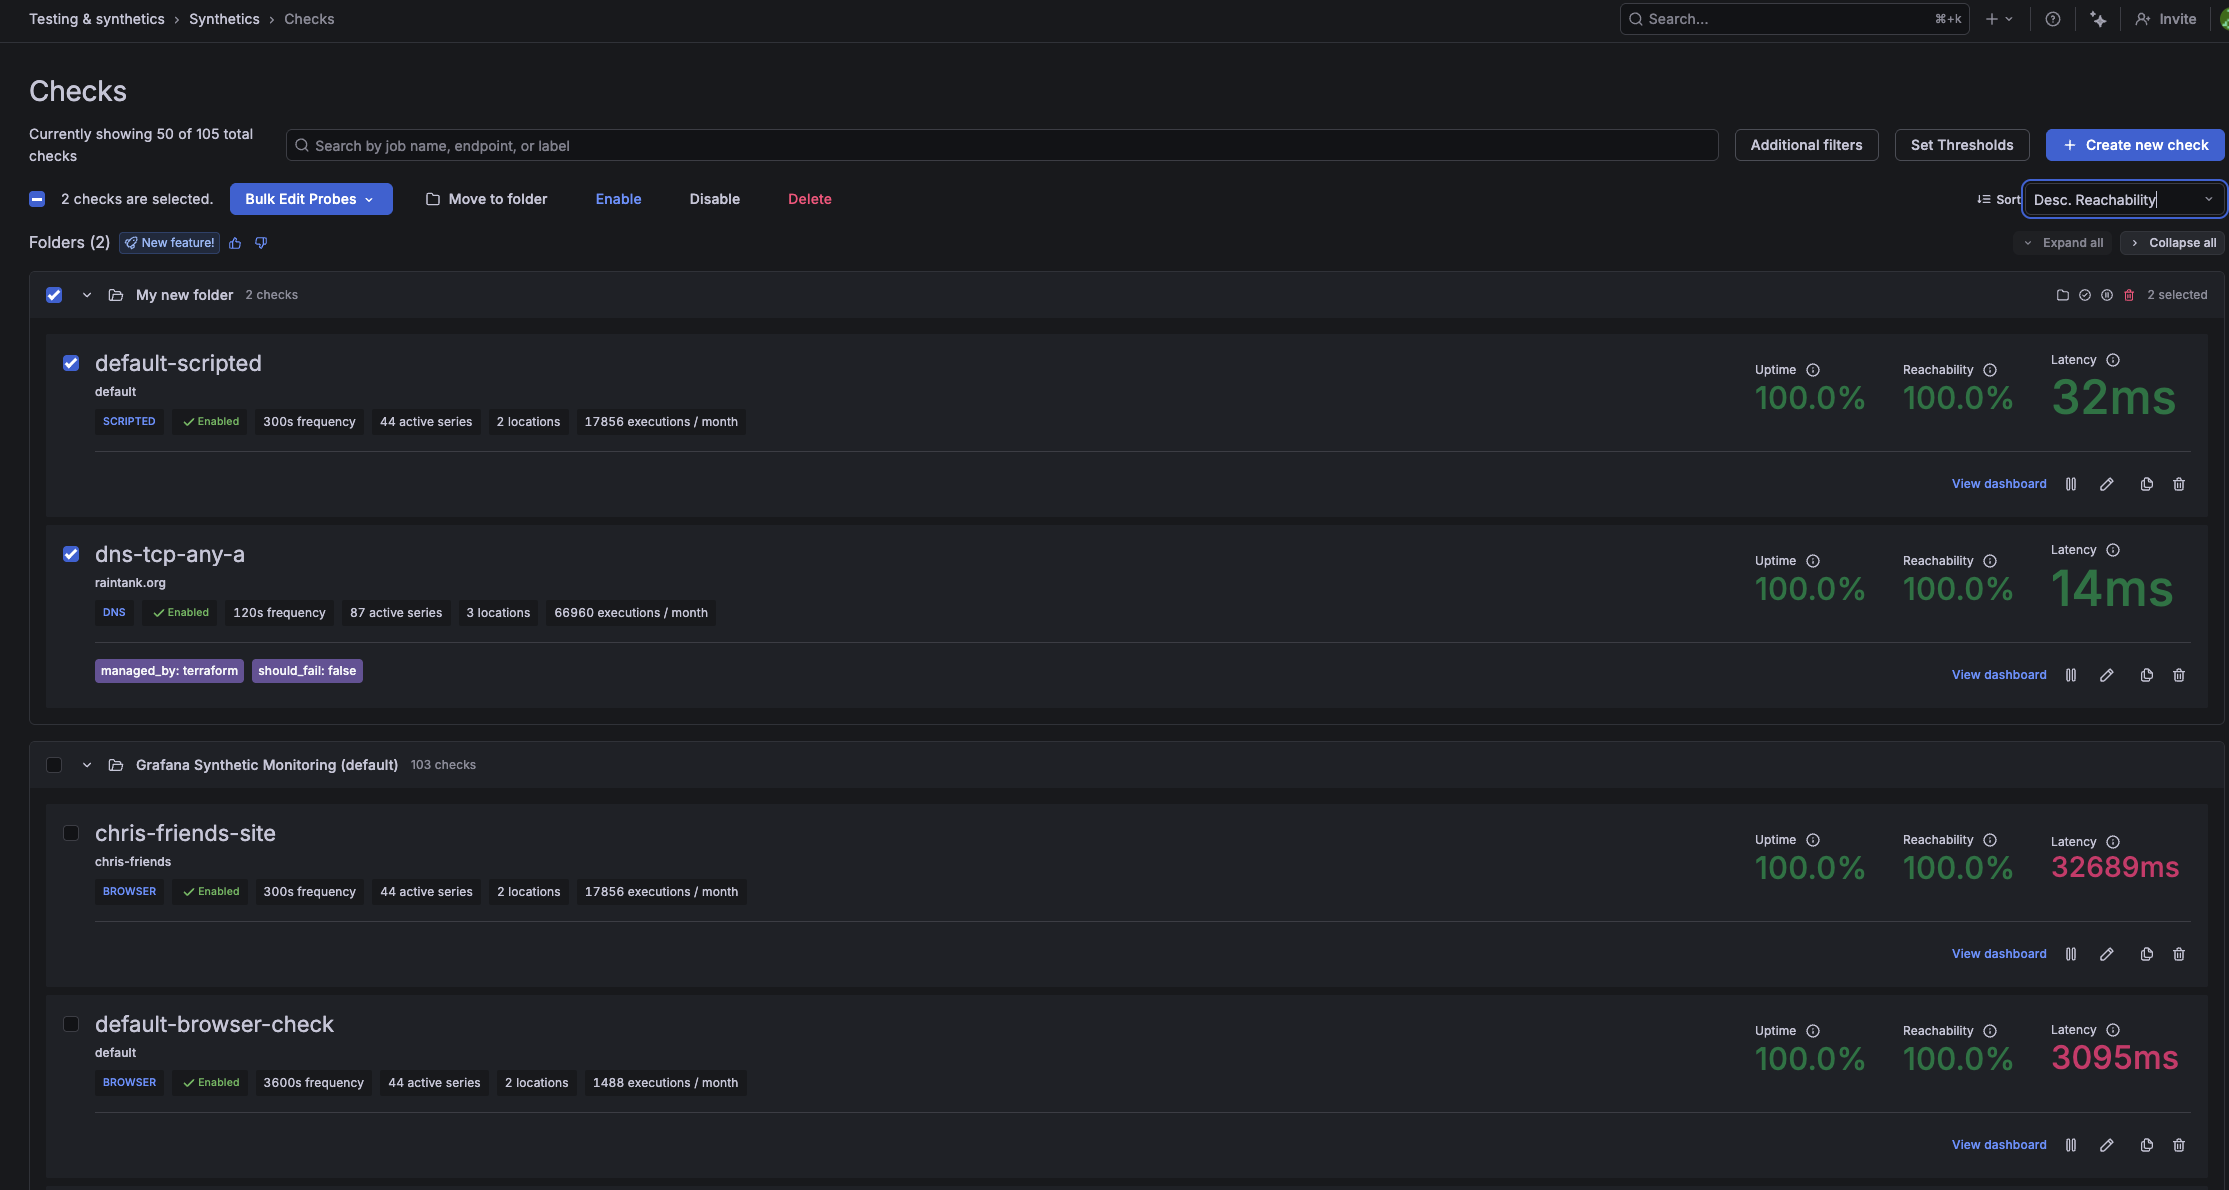
Grafana Cloud Synthetic Monitoring now lets you organize your checks into Grafana Folders. As you create more checks or onboard new teams, a single flat list becomes hard to scan. With folders, you can group checks by team, service, or environment so the right checks are always easy to find and act on a whole group at once instead of one check at a time.
Want more control than our pattern-based recommendations, but not sure where to start?
Adaptive Logs now walks you through creating a drop rule tailored to your environment in three guided steps: pick one of your highest-volume services, choose a drop rate, and review a pre-filled rule before any logs are dropped. The flow targets debug logs, often the largest and least-queried part of your log volume, and you take it from there.
Starting with Grafana 13.1, Grafana Assistant comes pre-installed in Grafana Enterprise, with no plugin installation required. If you’re a Grafana Enterprise user, simply connect your Grafana Cloud account to start using Assistant right away. Get onboarded quicker, explore telemetry data, build dashboards, and get things done faster using natural language.
This builds on our vision of Assistant as an “anywhere agent” and our ongoing efforts to expand access to our purpose-built LLM, including to self-managed Grafana users.
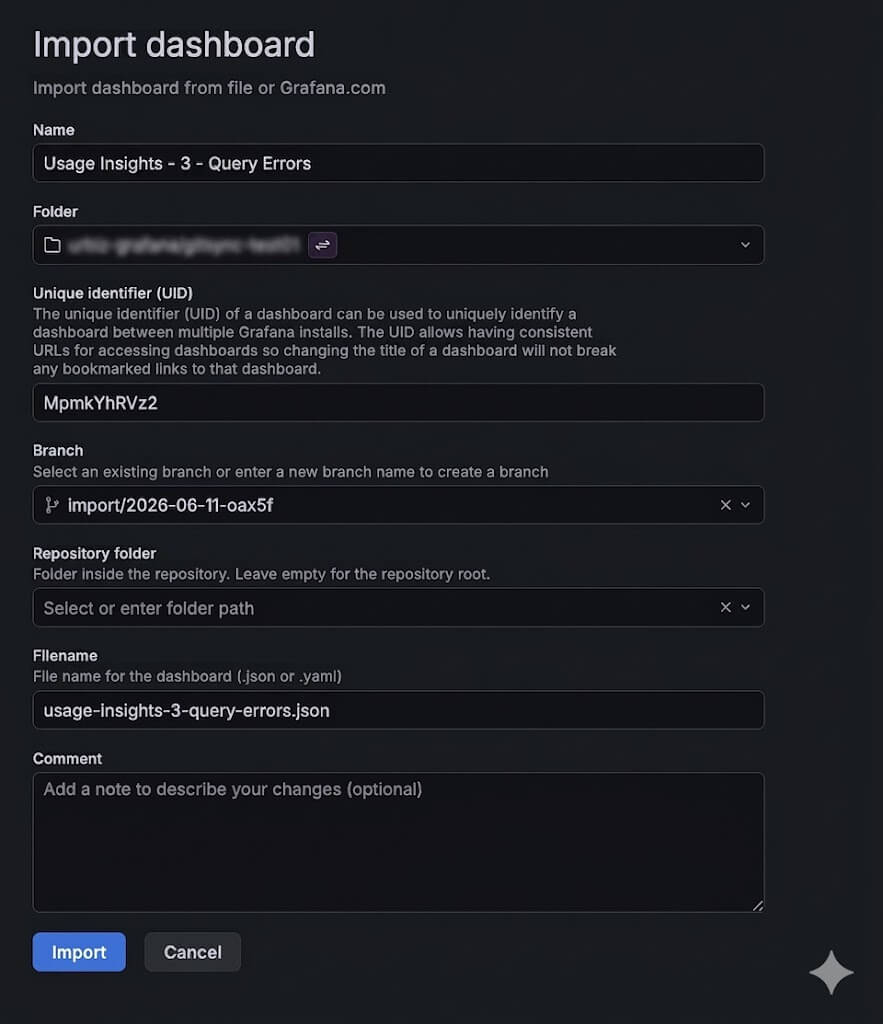
You can now import a dashboard JSON straight into a Git Sync–provisioned folder. From the folder’s browse view, hit Import and Grafana will route you through a provisioned import flow: pick the file path, branch, commit message, and workflow, and the dashboard gets committed back to your repository as part of the import.
Git Sync now signs commits with your user’s signing key, so Git providers mark them as Verified. GPG, SSH, and S/MIME keys are all supported. Configure a signing key on the repository, and every commit Git Sync makes to your branch is signed automatically.
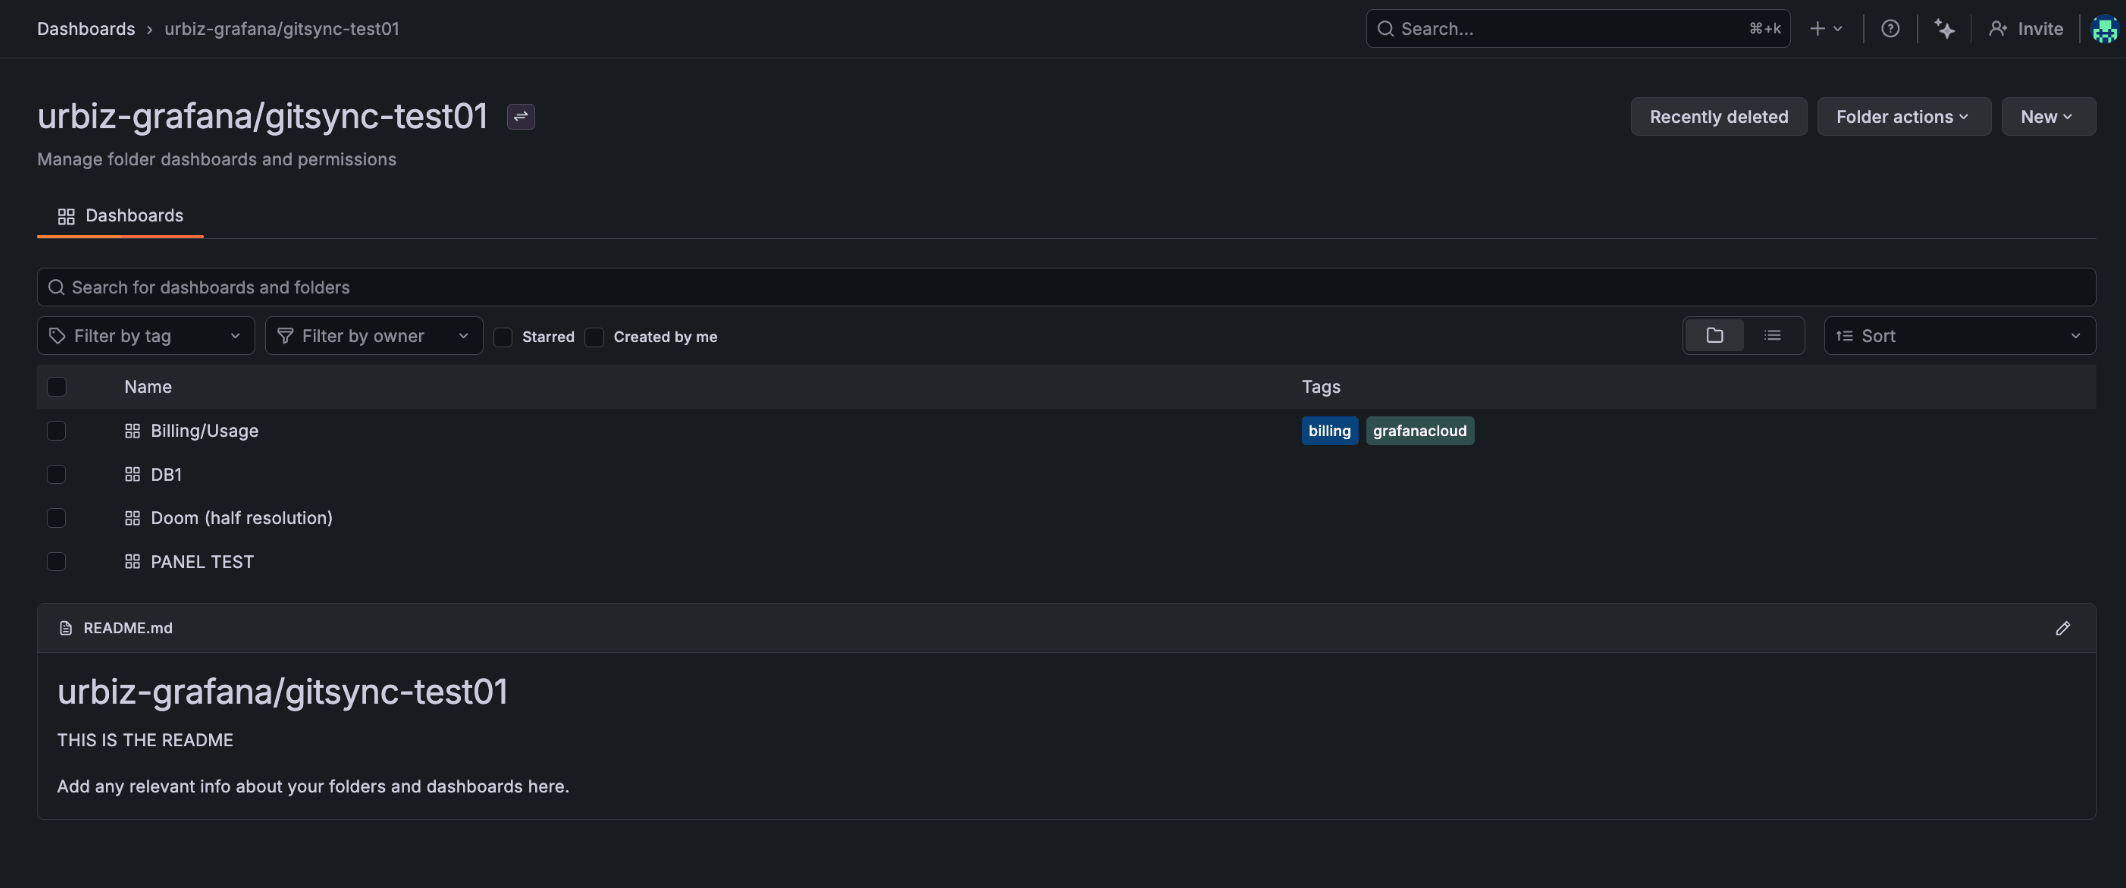
Git Sync provisioned folders now render their README.md inline below the dashboards list, out of the box. Add a README.md next to your dashboards in the repo and it shows up in Grafana: context, links, ownership notes, runbooks, whatever your team needs sitting alongside the dashboards.
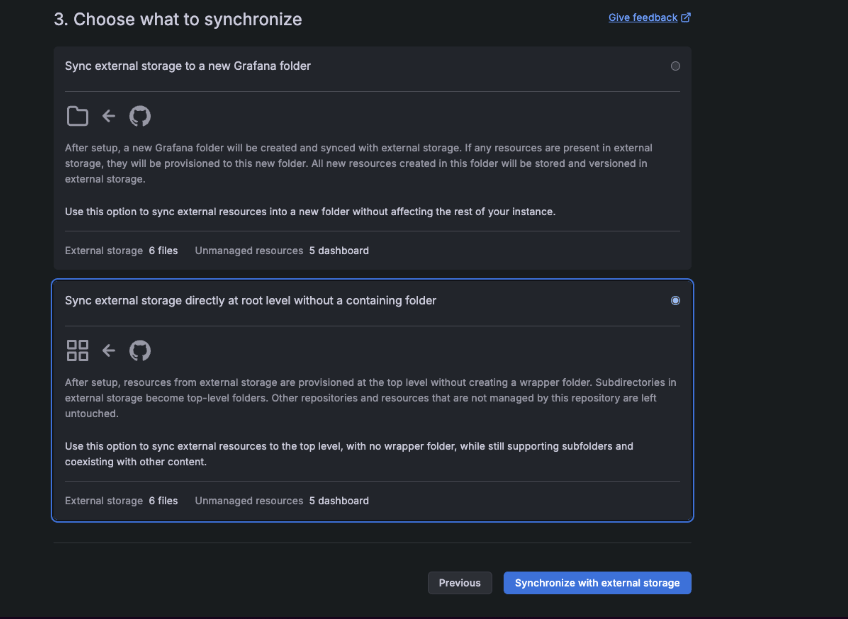
Git Sync now supports syncing a repository to the top level of your Grafana instance, with no parent folder. Pick Sync at root level without a containing folder in the setup wizard and your provisioned dashboards land at the root, alongside everything else, instead of being scoped under a single folder.
Earlier this year, we introduced multi-property variables in public preview for Grafana OSS and Enterprise (and generally available in Grafana Cloud). Now, this feature is generally available in Grafana OSS and Enterprise.