
Transformation updates
We’ve made a number of exciting updates to transformations!
You can now use variables in some transformations
Template variables are now supported for the Limit, Sort by, Filter data by values, Grouping to matrix (a community contribution ⭐️), Heatmap, and Histogram transformations. This enables dynamic transformation configurations based on panel data and dashboard variables.
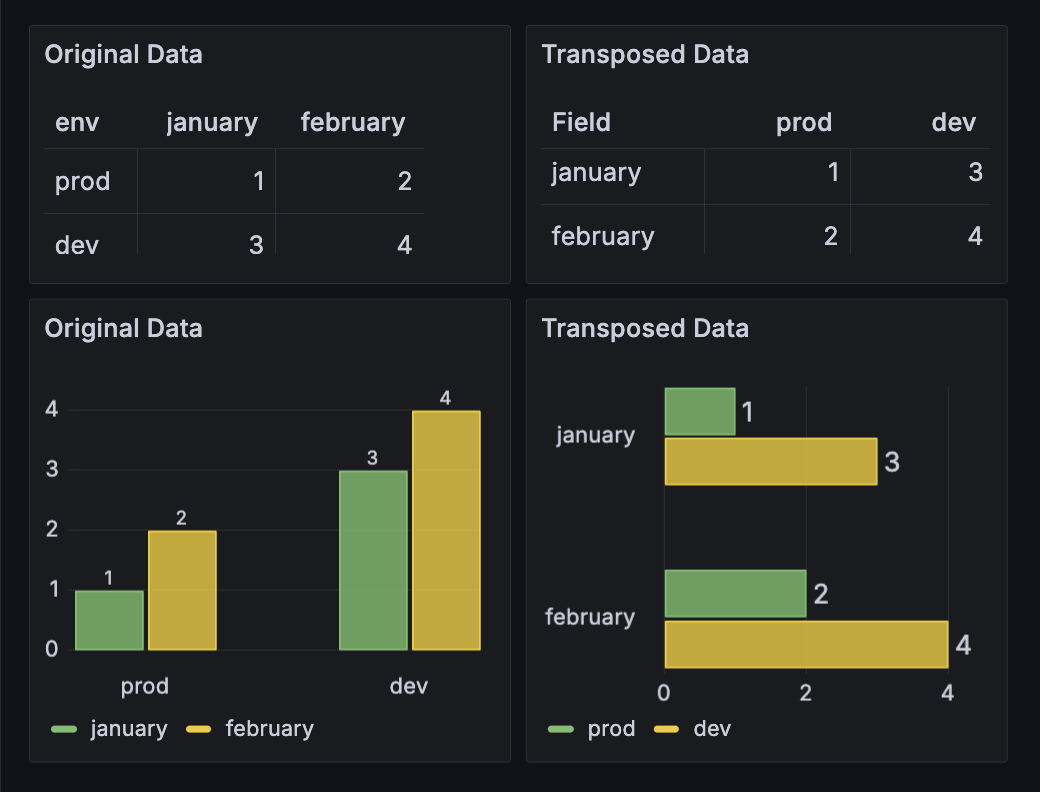
New transpose transformation
We’re excited to announce the new Transpose transformation, which allows you to pivot the data frame, converting rows into columns and columns into rows. This feature is particularly useful for data sources that don’t support pivot queries, enabling more flexible and insightful data visualizations.
For more information, refer to the documentation.
This feature is a community contribution ❤️
Group to nested tables is now generally available
We’re excited to announce that the Group to nested tables transformation is now generally available! Easily group your table data by specified fields and perform calculations on each group. With this transformation, you can enhance the depth and utility of your table visualizations.
See the documentation for more information.
Format string is now generally available
The Format string transformation is now generally available! Use this transformation to customize the output of a string field. From formatting your string data to upper, lower, title case, and more, this transformation provides a convenient way to standardize and tailor the presentation of string data for better visualization and analysis. See the documentation for more information.
New cumulative and window calculations available in Add field from calculation
The Add field from calculation transformation now supports both cumulative and window calculations. The cumulative function calculates on the current row and all preceding rows. You can calculate the total or the mean of your data up to and including the current row. With the window function you can calculate the mean, standard deviation, or variance on a specified set (window) of your data. The window can either be trailing or centered. With a trailing window the current row will be the last row in the window. With a centered window the window will be centered on the current row.
See the documentation for more information.