More streamlining in Kubernetes Monitoring for troubleshooting
Kubernetes Monitoring has added more troubleshooting tools:
- Find deleted Clusters, Nodes, Pods, containers, workloads, and namespace
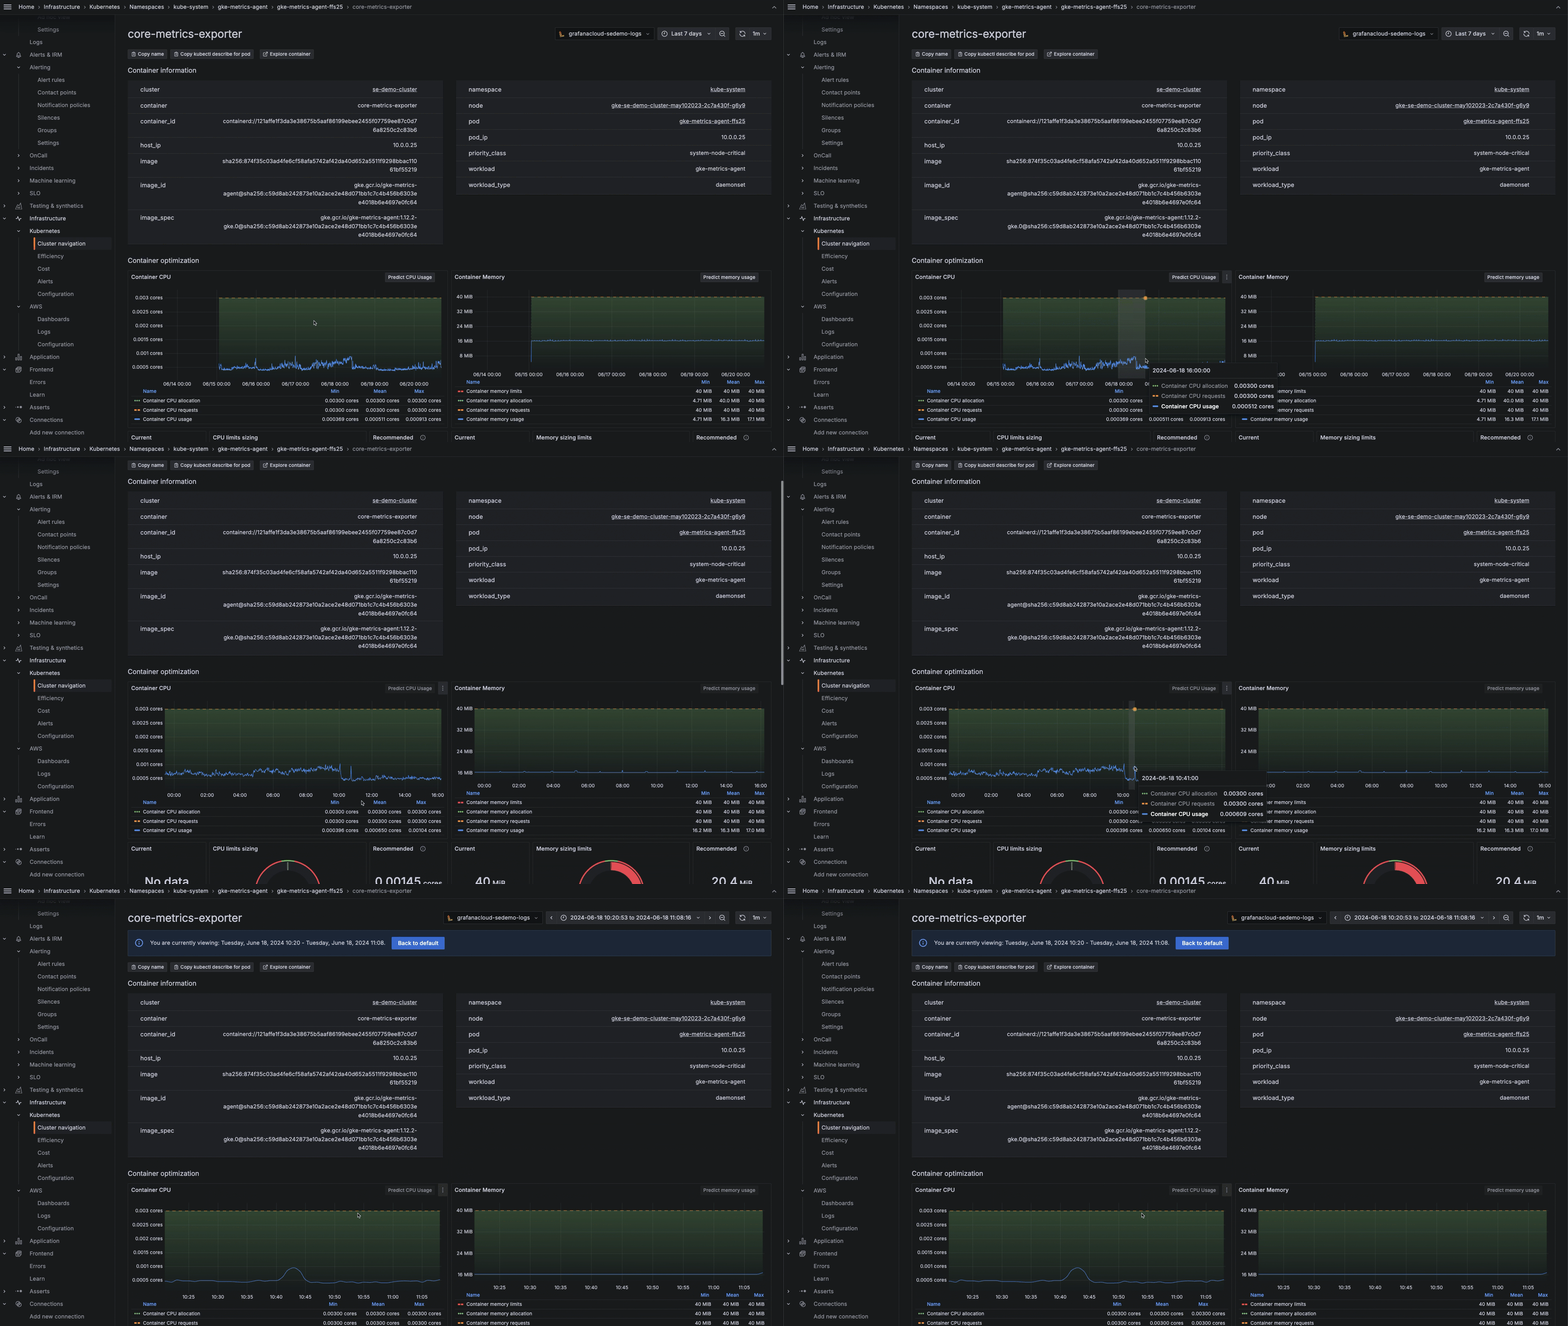
- Zoom into an area on the graph to narrow the time range
- Jump directly to the list of Clusters, Nodes, and workloads from the home page
Find deleted objects
You can find deleted objects, such as a Node shown in this example:

Zoom in to refine a time range
Zoom in on a graph to narrow a time range for more analysis.

Jump directly to Clusters, Nodes, and workloads
From the home page, you can jump directly to the list of Clusters, Nodes, and workloads.

