
Data visualization quality of life improvements v10.4
Documentation Grafana Cloud
What's new in Grafana Cloud
Data visualization quality of life improvements v10.4
Grafana Cloud
What's new in Grafana Cloud
Data visualization quality of life improvements v10.4
Grafana Cloud
← Back to What's newData visualization quality of life improvements v10.4
Generally AvailableDashboards and visualizations
Release date: 2024-02-20
We’ve made a number of small improvements to the data visualization experience in Grafana.
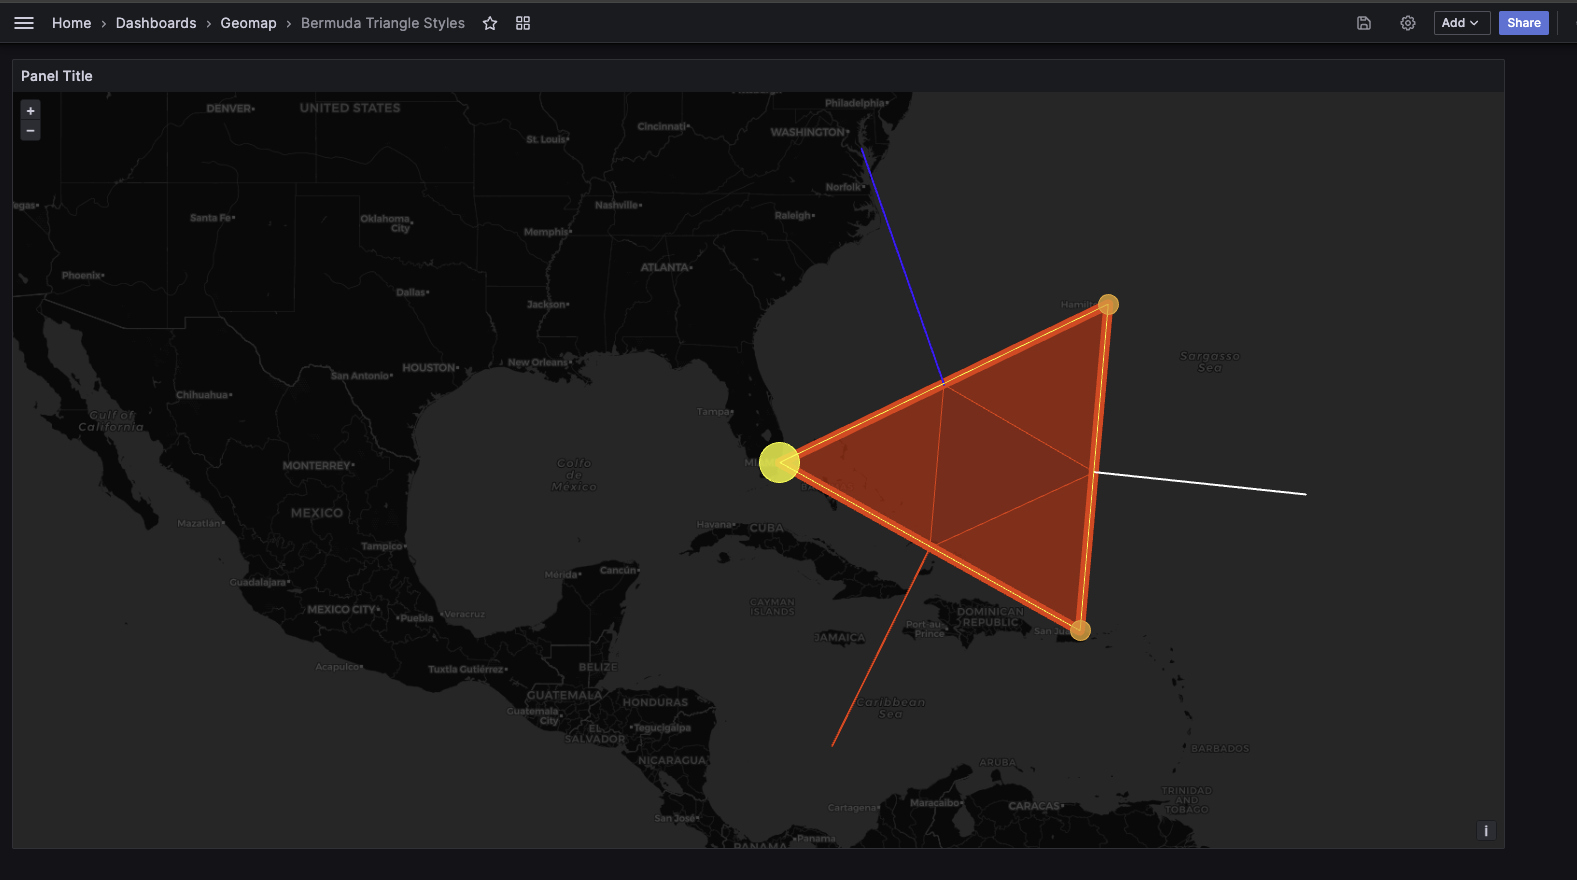
Geomap geojson layer now supports styling
You can now visualize geojson styles such as polygons, point color/size, and line strings. To learn more, refer to the documentation.
Canvas elements now support snapping and aligning
You can precisely place elements in a canvas with ease as elements now snap into place and align with one another.
View data links inline in table visualizations
You can now view your data links inline to help you keep your tables visually streamlined.
Was this page helpful?
Related resources from Grafana Labs
5 Mar

Getting started with managing your metrics, logs, and traces using Grafana
In this webinar, we’ll demo how to get started using the LGTM Stack: Loki for logs, Grafana for visualization, Tempo for traces, and Mimir for metrics.
60 min

Intro to Kubernetes monitoring in Grafana Cloud
In this webinar you’ll learn how Grafana offers developers and SREs a simple and quick-to-value solution for monitoring their Kubernetes infrastructure.
60 min

Building advanced Grafana dashboards
In this webinar, we’ll demo how to build and format Grafana dashboards.