Moving average and trend lines using transformations
We’ve added two new features to transformations in Grafana, to help you make sense of your data.
Moving average
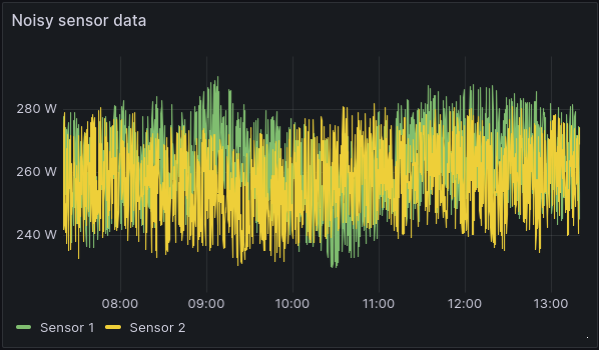
Sometimes your data is too noisy to quickly grasp what’s going on. A common way to address this issue is to calculate the moving mean, or moving average, to filter out some of that noise. Luckily, many data sources already support calculating the moving mean, but when the support is lacking or you’re not well versed in the query language, until now, you were stuck with the noise.
By selecting the Window functions mode and using Mean as the calculation for the Add field from calculation transformation, Grafana adds a field with the moving mean for your selected field.
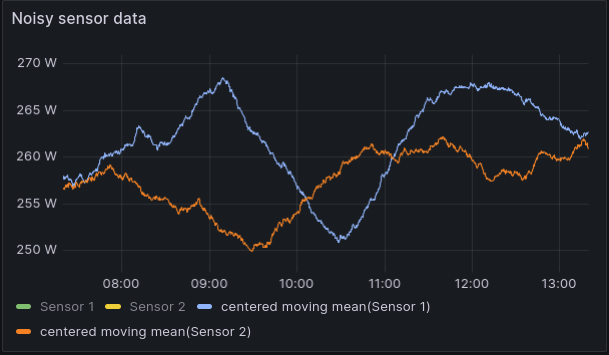
The Window functions mode also supports moving variance and moving standard deviation calculations if you need to analyze the volatility of your metric.
Trend lines
We’re also adding some basic statistical analysis features as a way to help you visualize trends in your data. The Regression analysis transformation will fit a mathematical function to your data and display it as predicted data points in a separate data frame.
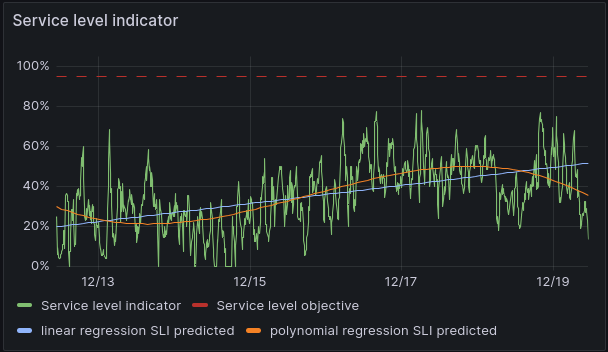
The transformation currently supports linear regression and polynomial regression to the fifth-degree.
We hope these two features will help you better visualize trends in your data.