Create dashboards from templates and suggestions
Grafana provides alternative ways to start building a dashboard with templates and suggested dashboards.
Dashboard templates
Note
Dashboard templates is currently in public preview. Grafana Labs offers limited support, and breaking changes might occur prior to the feature being made generally available.
Grafana provides a variety of pre-built dashboard templates that you can use to quickly set up visualizations for your data. These dashboards use sample data, which you can replace with your own data, making it easier to get started with monitoring and analysis.
The templates provide standardized dashboard layouts designed to help you answer engineering or business questions consistently. For instance, the DORA template allows all teams within an organization to measure delivery performance using a widely adopted industry framework.
Create dashboards from templates
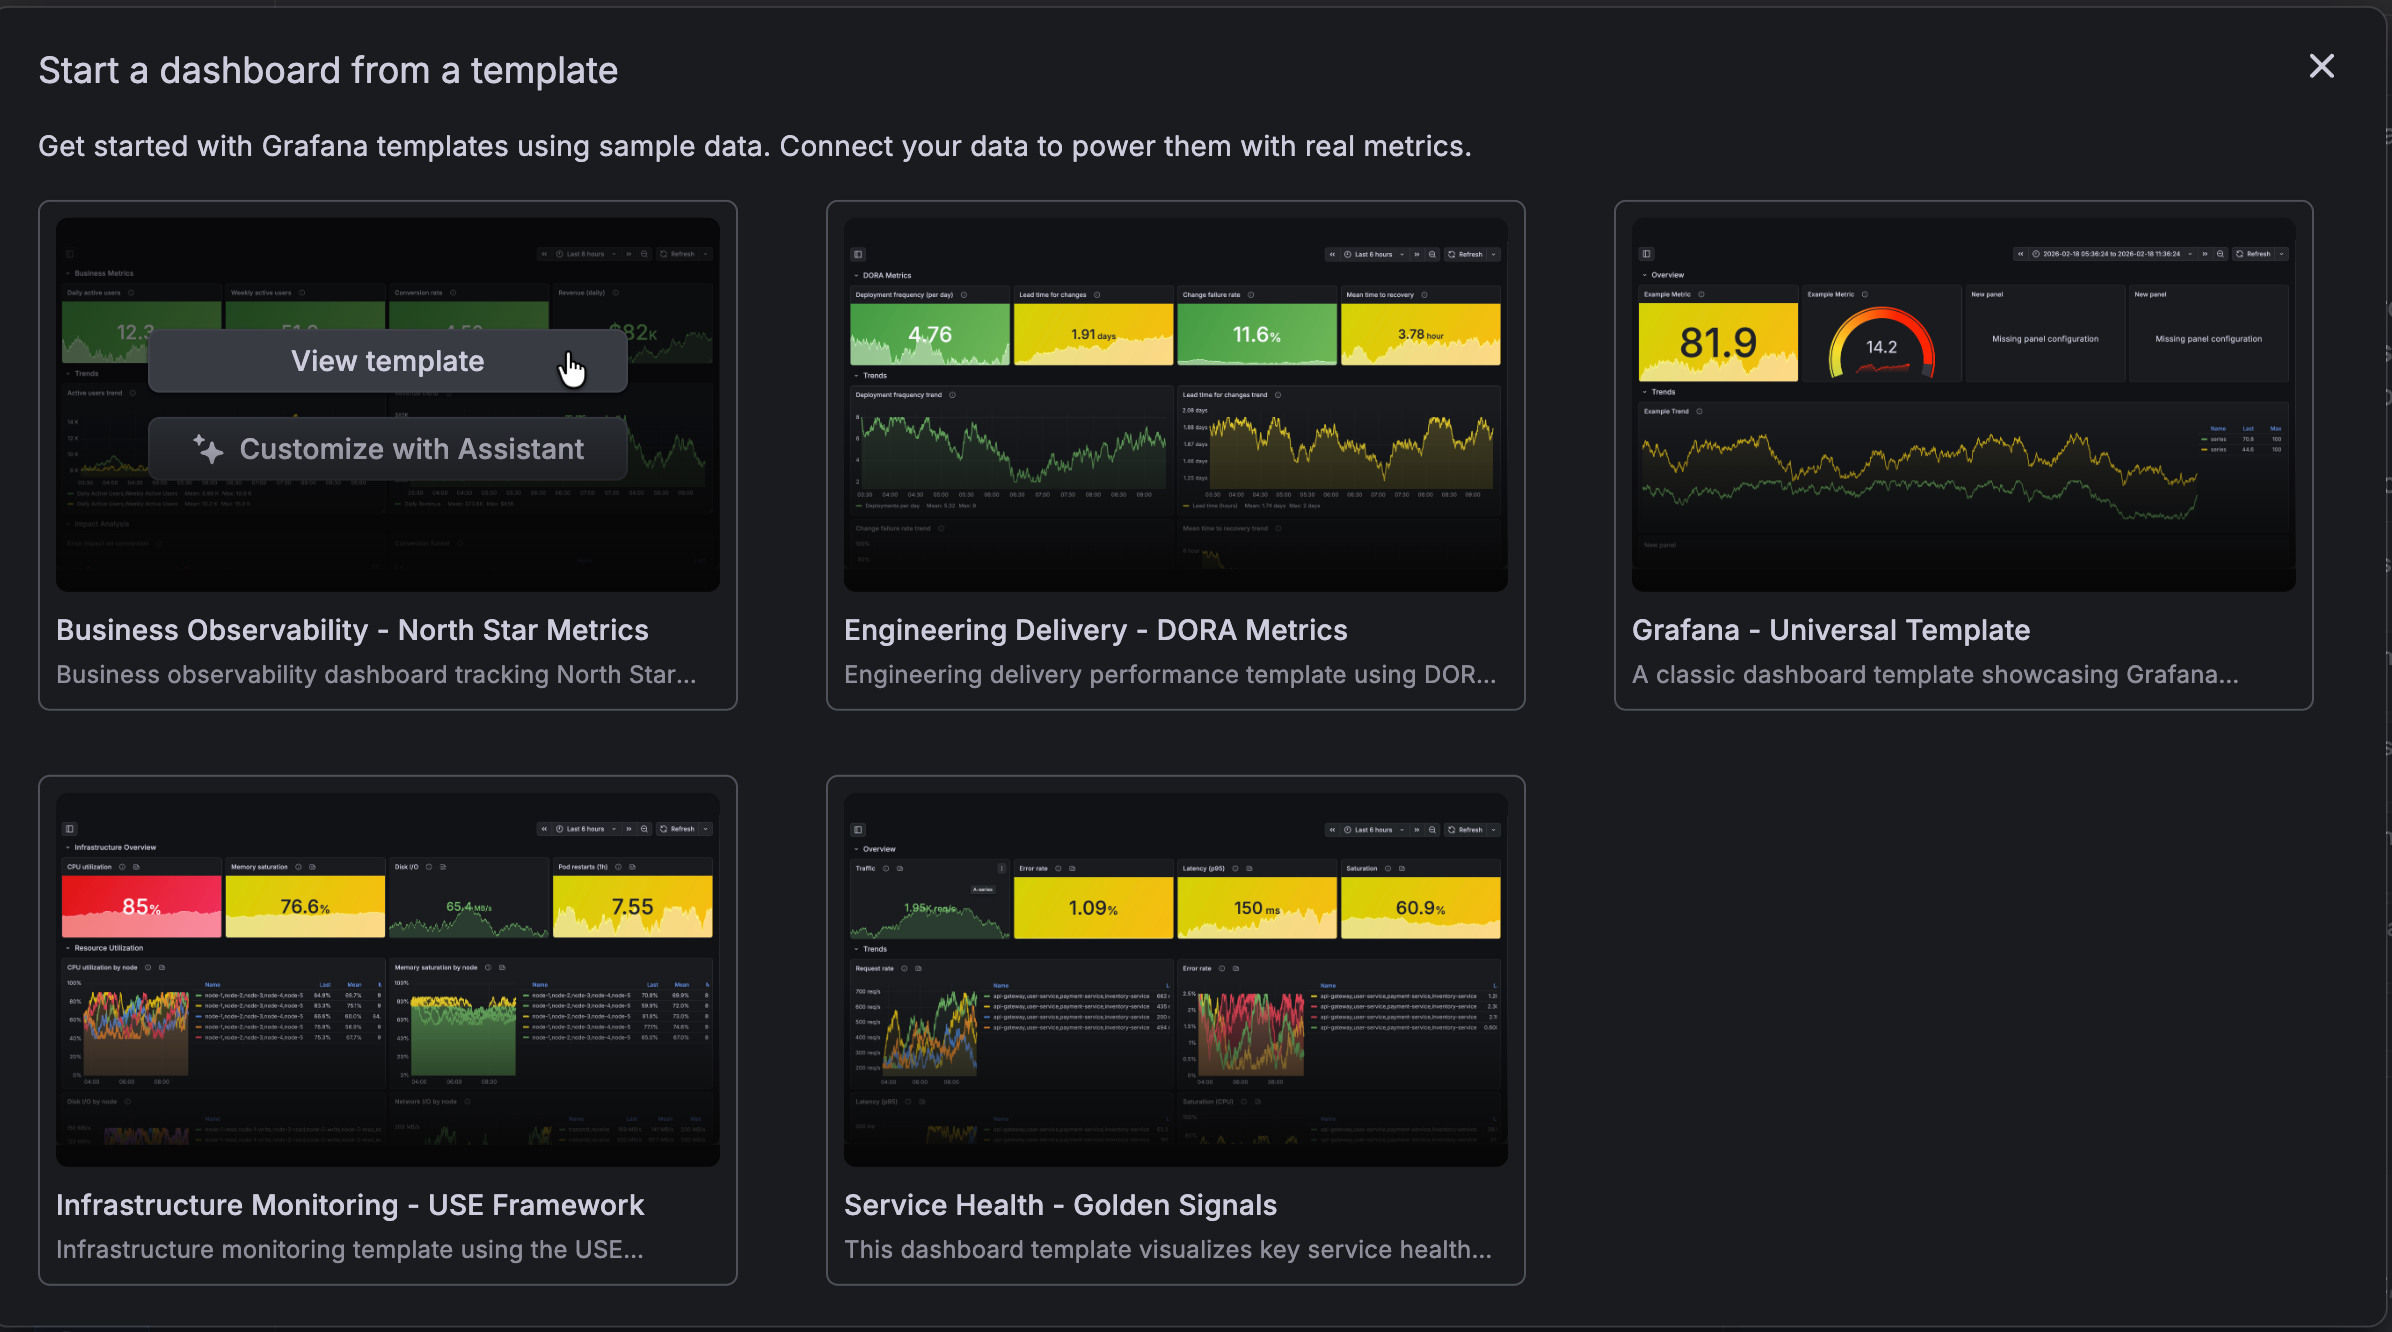
To create a dashboard from a template, follow these steps:
Click Dashboards in the primary menu.
Click New and select Dashboard from template in the drop-down menu.
Hover the cursor over the template you want to use and click View template.
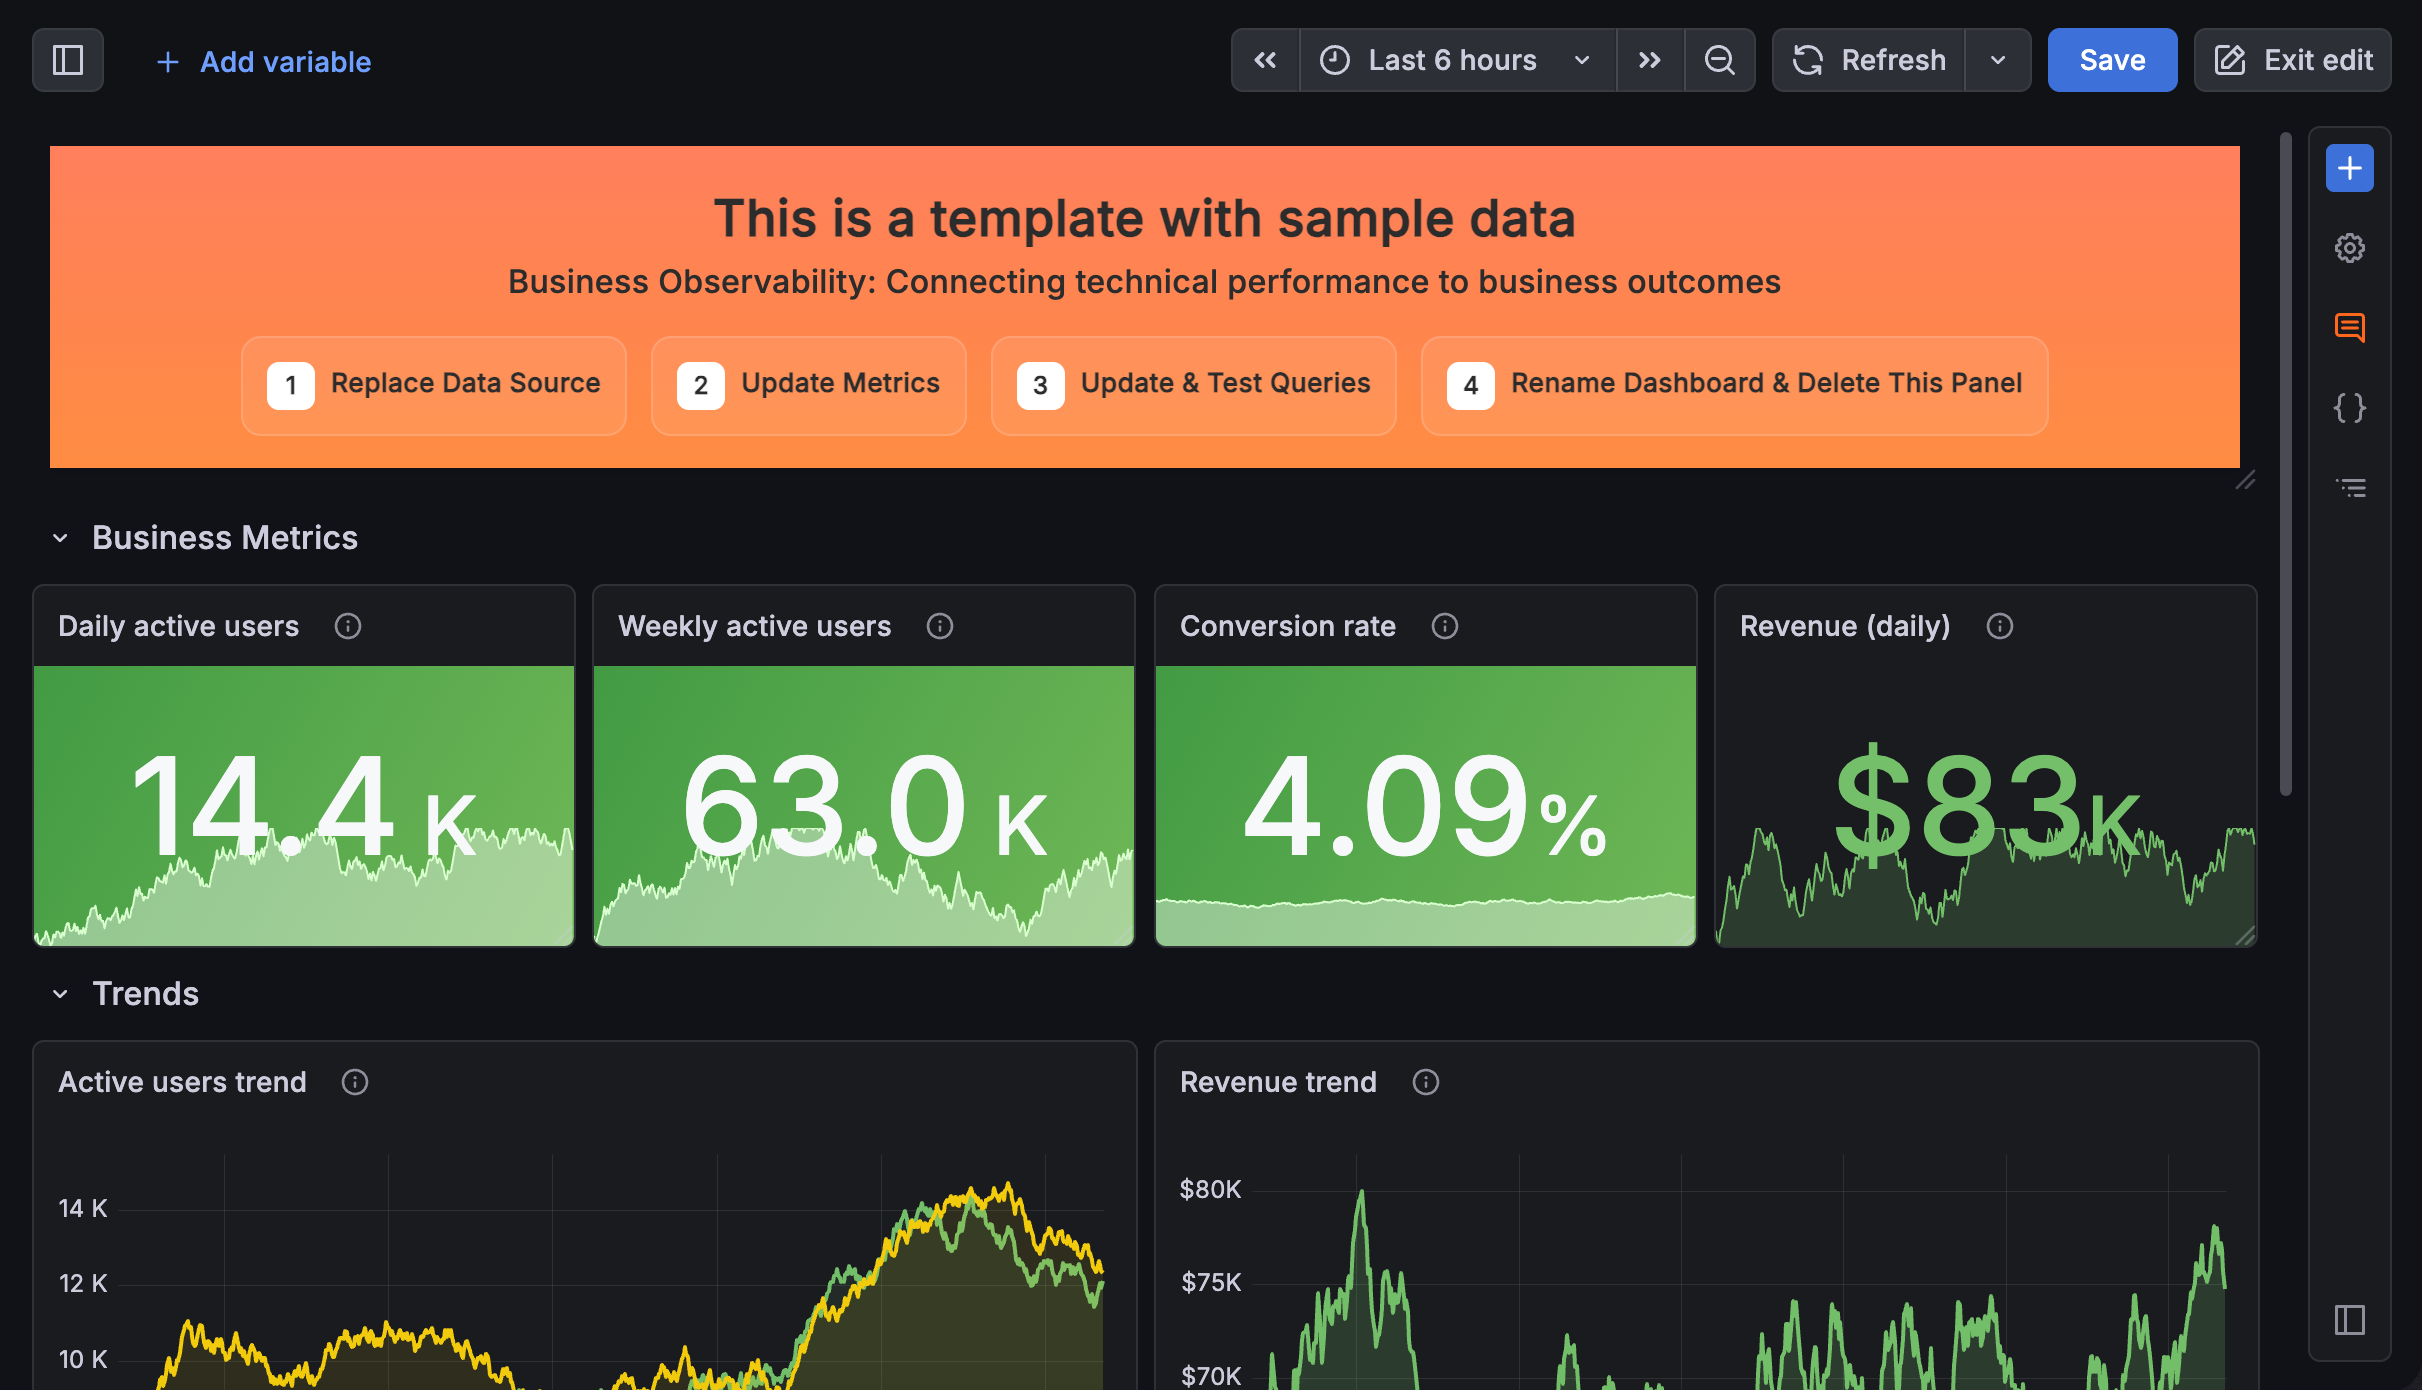
The dashboard created includes a banner panel indicating the dashboard is using sample data:
![Dashboard with sample data]()
Click Save in the top-right corner.
(Optional) Enter a new title for the dashboard.
(Optional) Select a folder for the dashboard.
Click Save.
Update the data source for each panel to add your own data and configure the queries you need.
In Grafana Cloud, you also have the option to customize the template using Grafana Assistant.
Make any other edits to the dashboard to most effectively display your data.
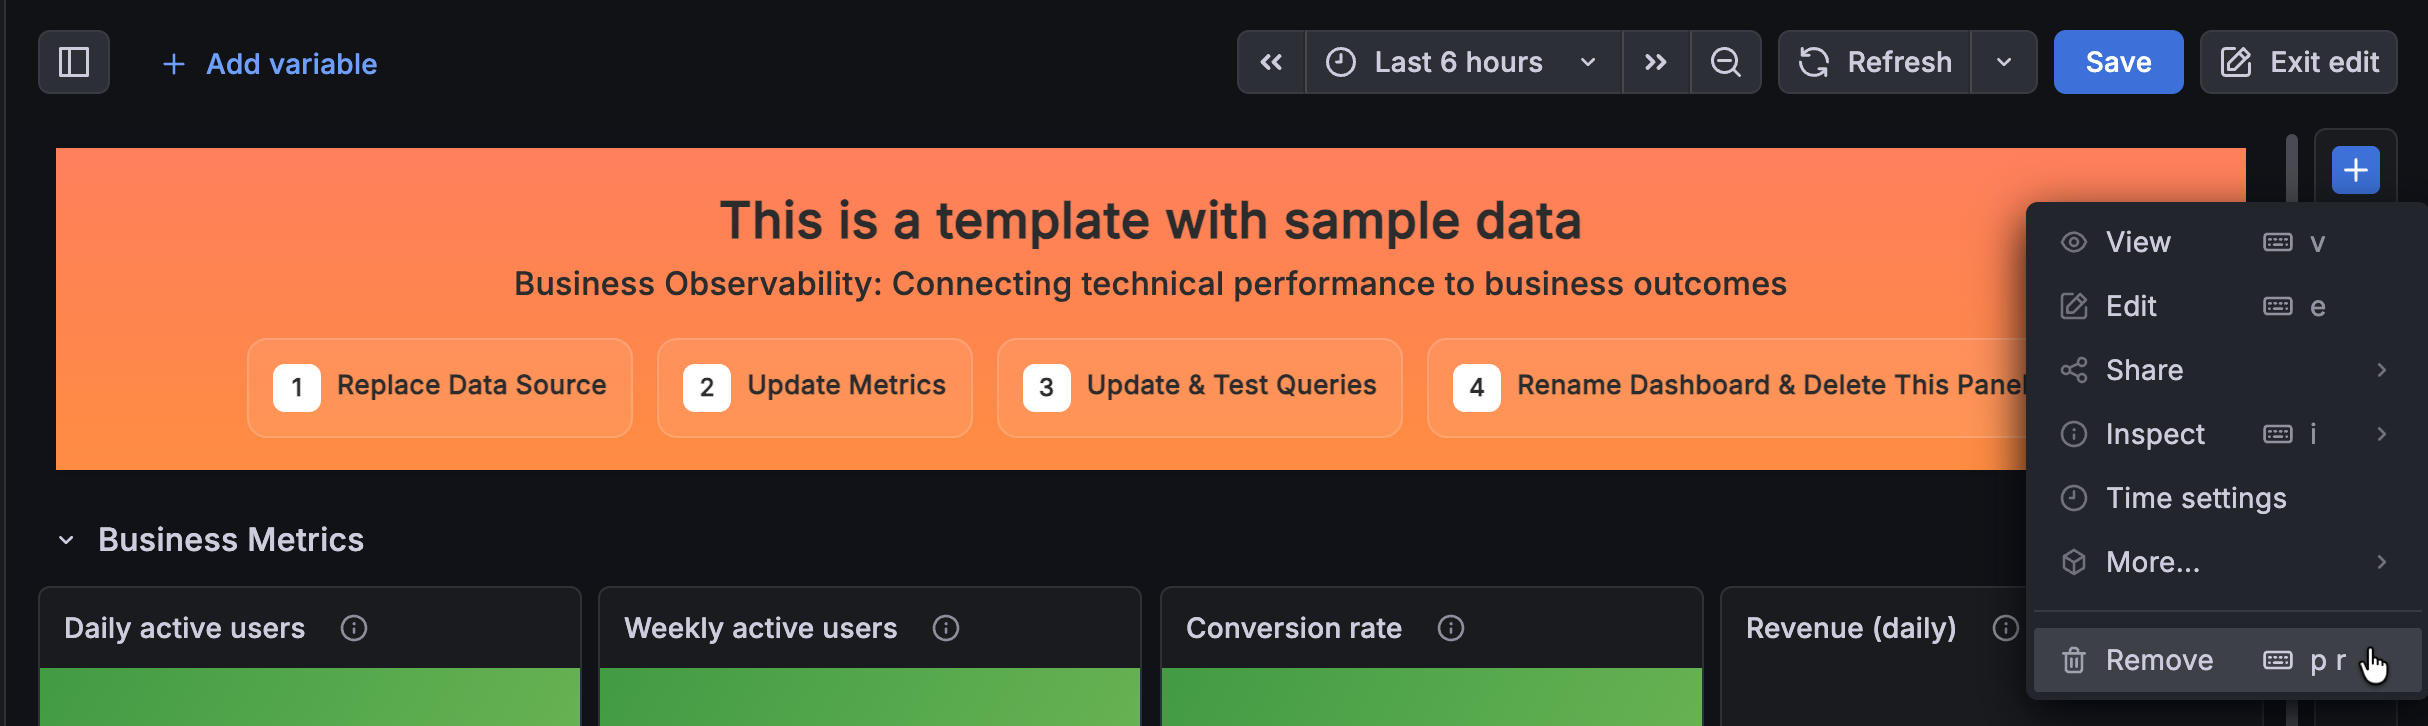
When you’ve made all of your changes, hover the cursor over the top-right corner of the banner panel to open the panel edit menu, and then click Remove to remove the panel.
![Removing the sample data banner panel]()
Click Save.
Enter an optional description of your updates, and click Save.
Suggested dashboards
Note
Suggested dashboards is currently in public preview. Grafana Labs offers limited support, and breaking changes might occur prior to the feature being made generally available.
Suggested dashboards can be helpful when you have a data source configured, but you’re not sure how to most effectively visualize your data. The process of creating a dashboard from a suggestion starts from the Data sources feature, so the suggestions are specific to your data source type (for example, Prometheus, Loki, or Elasticsearch).
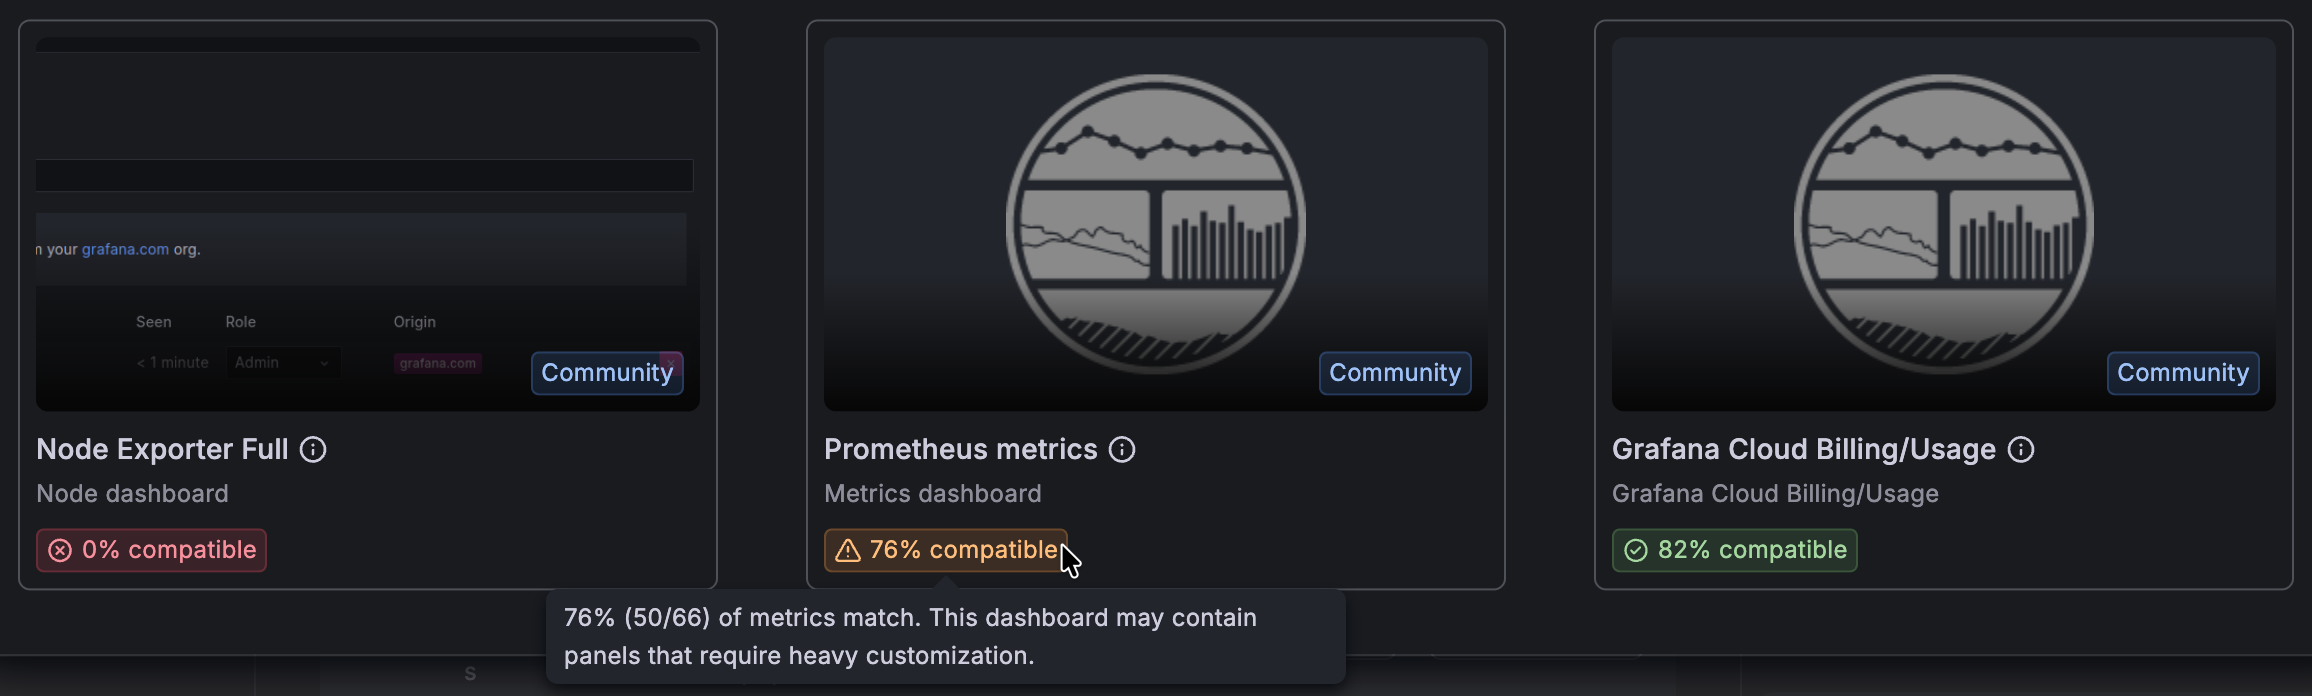
The dashboards suggested are either provided by the data source plugin (provisioned) or come from the Grafana Community, and they are labeled to indicate this:
For Prometheus data sources, Grafana compares the metrics of your data source against those of the suggested dashboard to assess how much you might need to update the dashboard to make it useful. Using that analysis, Grafana assigns the dashboard a compatibility score:
Access the suggested dashboards for a data source by clicking the Build a dashboard drop-down list and selecting From suggestions:
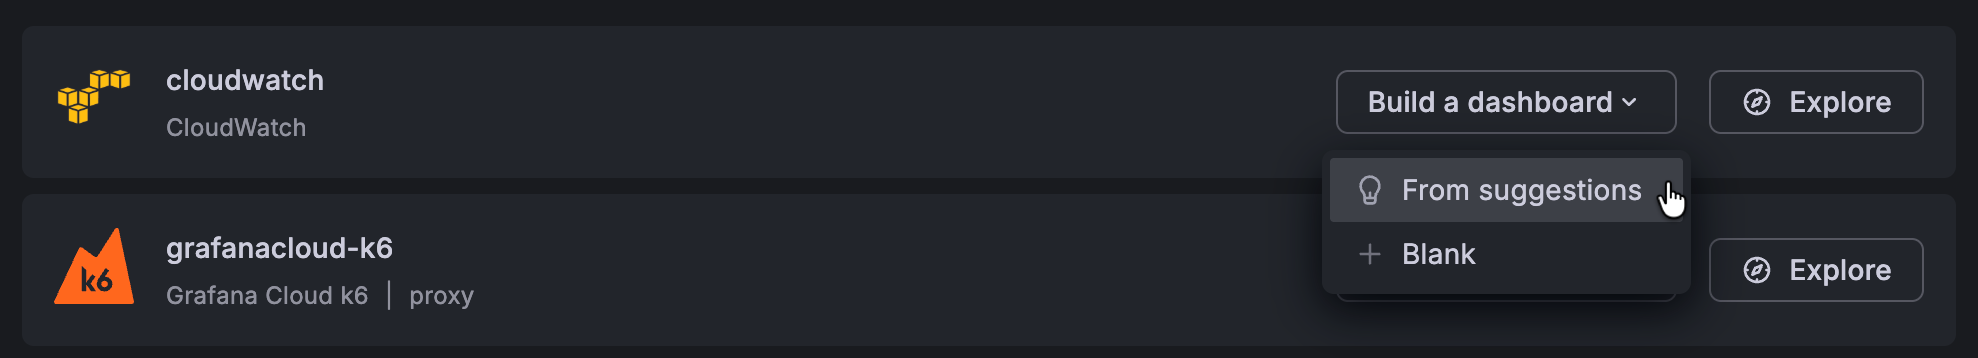
The From suggestions option is only enabled if suggested dashboards are available for the data source. If there are no suggestions available, Grafana displays a warning, and you won’t be able to select the option.
Create dashboards from suggestions
To build a dashboard from suggestions, follow these steps:
Navigate to Connections > Data sources.
Go to the row of the data source for which you want to create a dashboard.
Click the Build a dashboard drop-down list and select From suggestions.
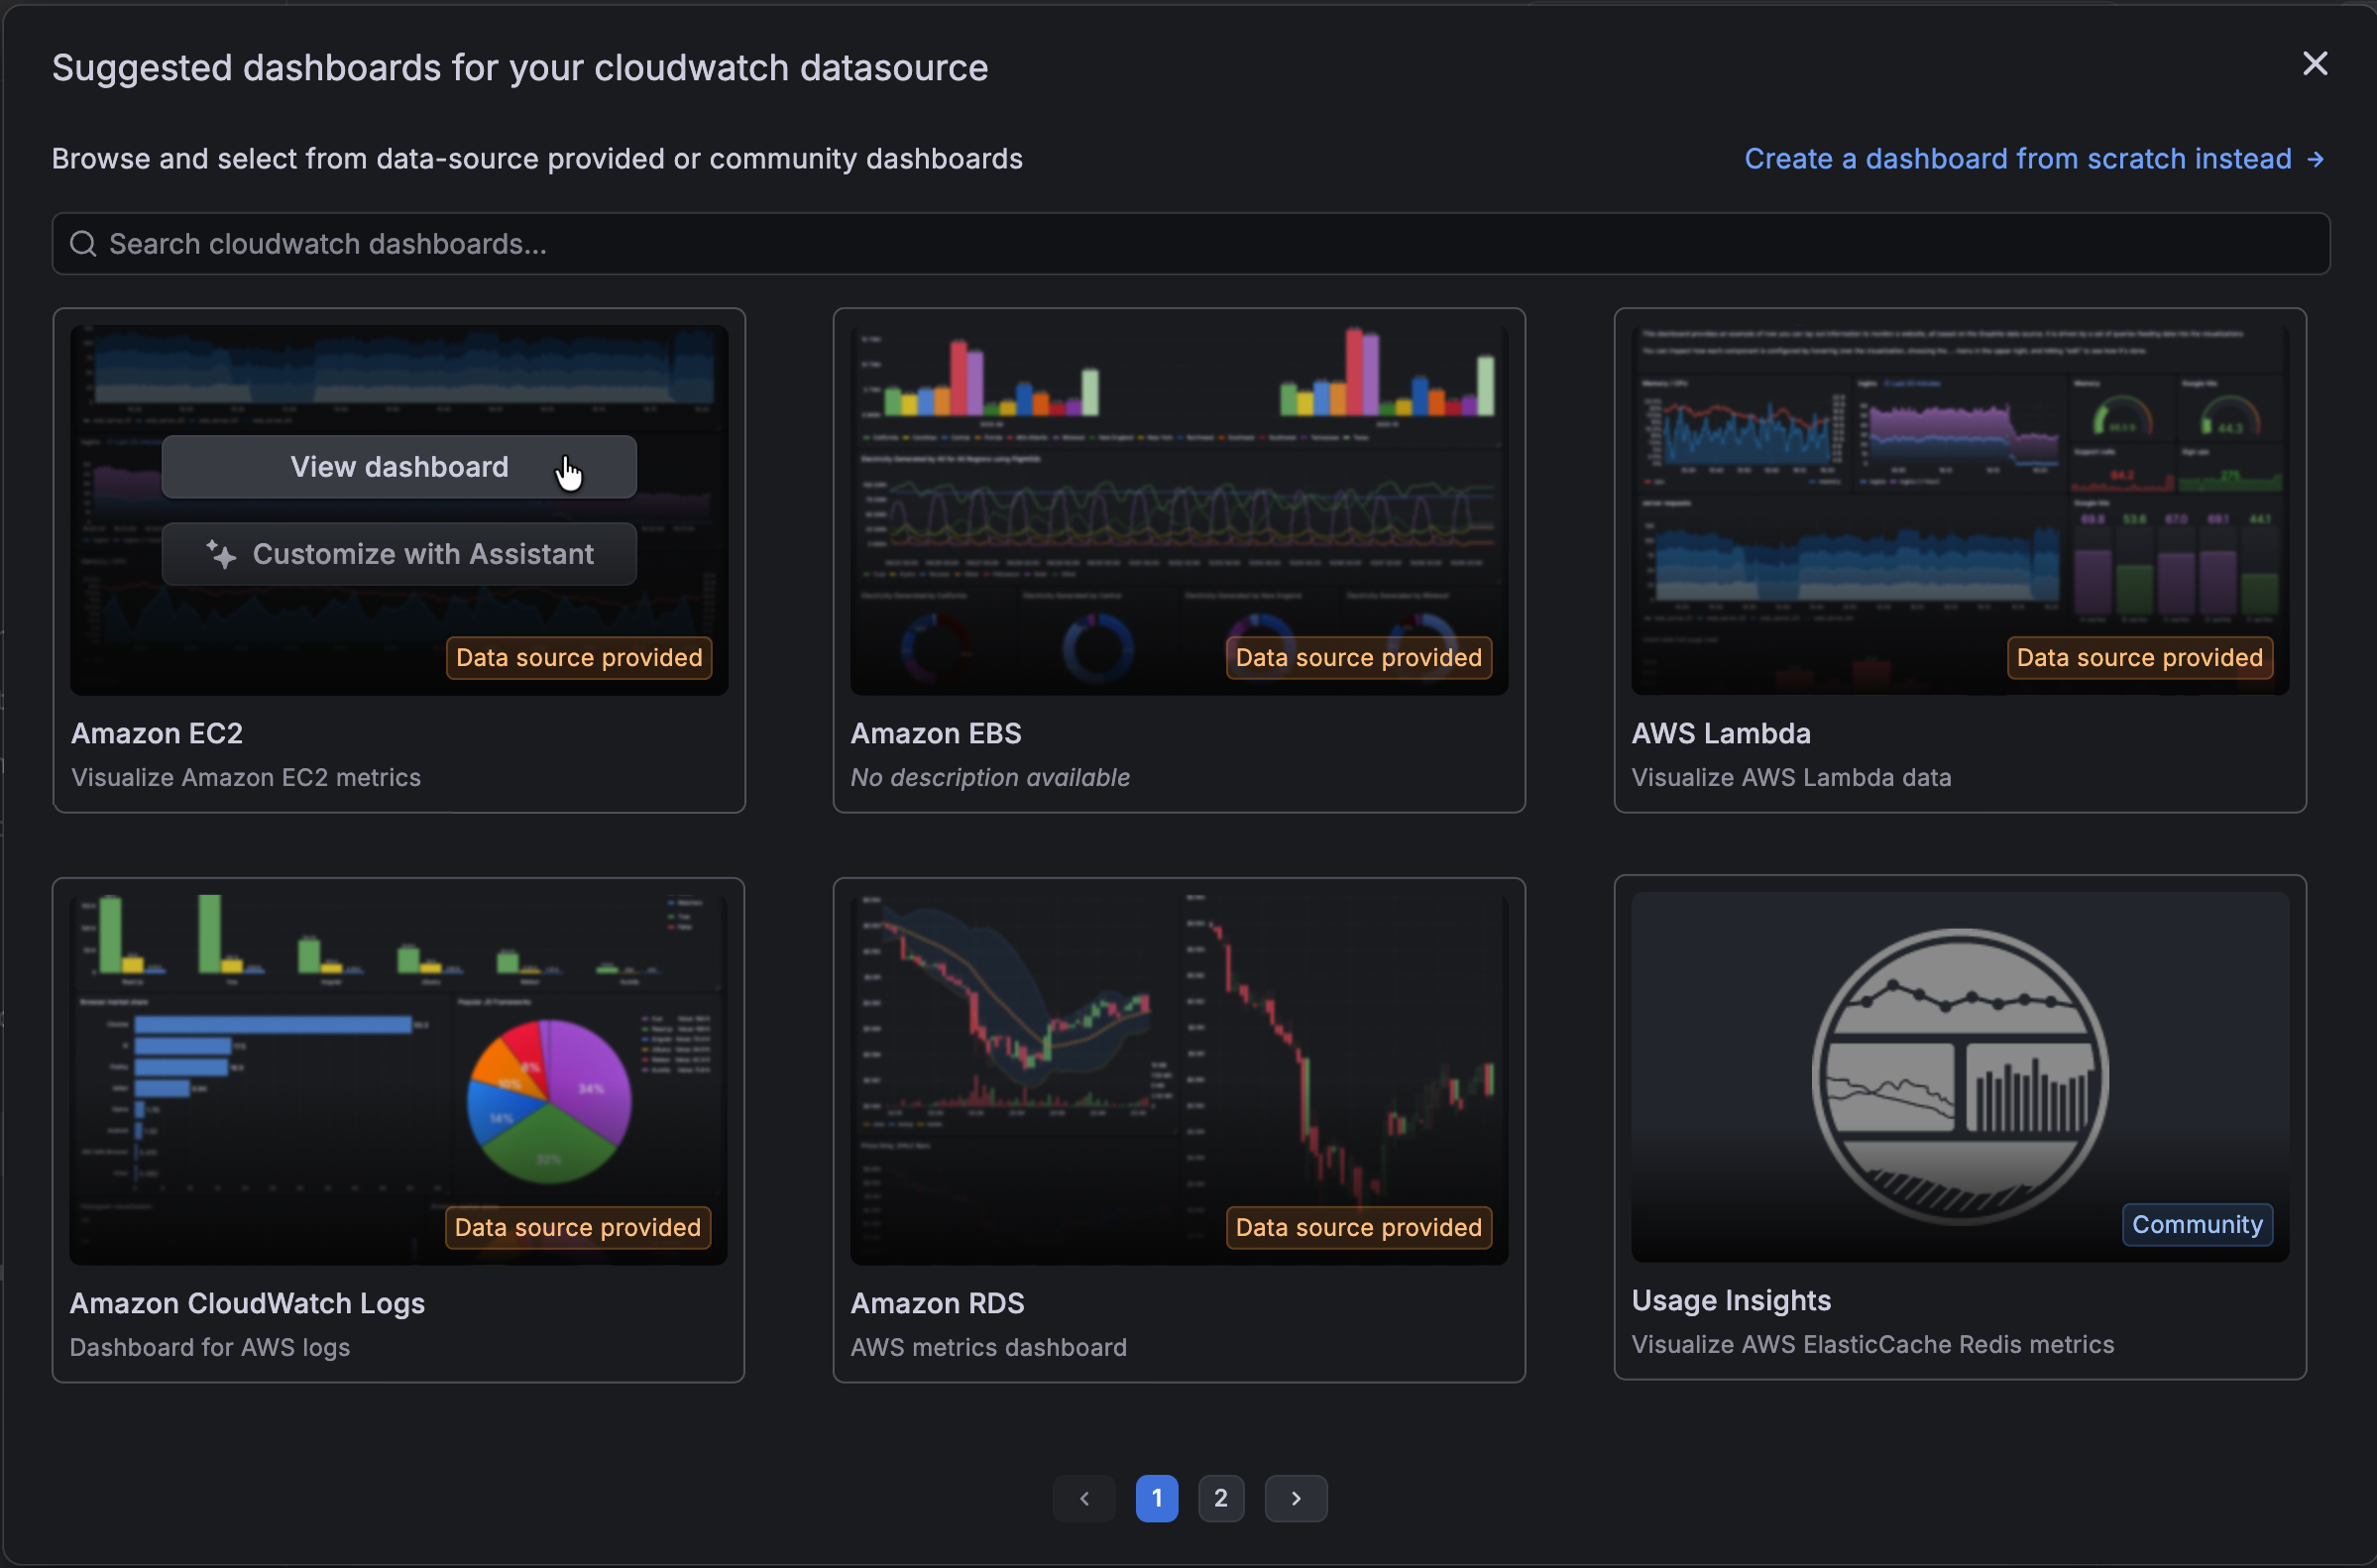
A dialog box with suggested dashboards opens.
Hover the cursor over the suggestion you want to use and click View dashboard.
In Grafana Cloud, you also have the option to customize the suggested dashboard using Grafana Assistant.
(Optional) Do one or more of the following:
- If there are more than six suggested dashboards, use the page numbers or arrow buttons at the bottom of the dialog box to navigate between pages of suggestions.
- To find a specific dashboard, enter the name of the dashboard in the search bar.
- If, after viewing the suggested dashboard, you find it doesn’t meet your needs, go back and choose a different suggestion or start a new dashboard by clicking one of the options in the banner:
![Suggested dashboards banner]()
Complete the rest of the dashboard configuration.
Click Save.
(Optional) Enter a new title for the dashboard.
(Optional) Select a folder for the dashboard.
Click Save.

Customize templates and suggested dashboards with Grafana Assistant
In Grafana Cloud, you can customize a dashboard template or suggested dashboard using Grafana Assistant.
To use this option, hover the cursor over the template or suggestion that you want to use and click Customize with Assistant:
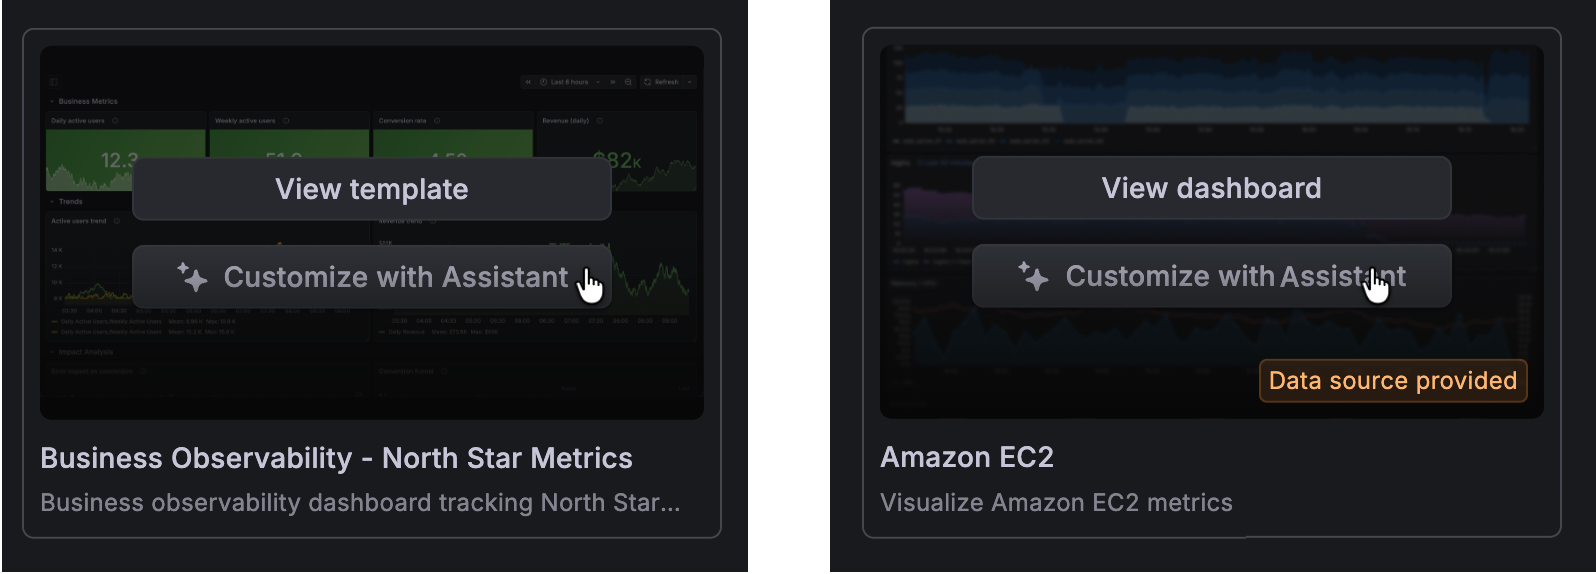
When you choose this option, a preconfigured prompt is entered into the Assistant chat to start the process:


Grafana Assistant analyses the template or suggested dashboard, checks your available data sources, and guides the creation of a dashboard tailored to your environment. This lets you create a working, relevant dashboard from a template or suggestion without the need to manually map metrics and panels.
Grafana Assistant can query a subset of data sources, so customizing with Assistant for other data sources might generate poor results. For an up-to-date list of supported data sources, refer to the Assistant documentation.


