Troubleshoot remote configuration errors
When a configuration pipeline has an error, Grafana Fleet Management helps you identify the affected collectors in several ways:
- On the Inventory tab, collectors with pipeline errors have a red health status that indicates an error has occurred and they are unhealthy.
- Look for logs on the Logs tab in the collector details view. You can search for specific log messages to go straight to matching entries. These logs report the collector’s failure to fetch the remote configuration.
- For Alloy collectors, you can also use the Remote Configuration dashboard on the Health tab in the collector details view to monitor how successfully a collector loads its remote configuration over time. The dashboard includes panels for the last configuration load status, the load success rate, and configuration error logs. It’s useful for identifying intermittent remote configuration load failures or confirming that a fix has resolved an issue.
Note
You must be running Grafana Alloy v1.12.0 or later to see detailed remote configuration errors in the application interface. If you’re running OpenTelemetry Collectors, configuration errors are noted in the application, but details are not provided.
Troubleshoot with Grafana Assistant
When a collector has a configuration pipeline error, a Troubleshoot in Assistant icon appears beside its health status indicator on the Inventory tab. You can click this icon to open Grafana Assistant with the collector’s configuration and error details pre-loaded. The assistant automatically analyzes the errors, explains the root cause of each one, and suggests specific fixes with corrected configuration examples.
- In your Grafana Cloud instance, click Connections > Fleet Management.
- On the Inventory tab, find the collector with a red (Error) status.
- Click the Troubleshoot in Assistant icon next to the status indicator. Grafana Assistant opens and automatically sends a prompt that analyzes the configuration errors.
- Review the suggested fixes and apply them to the relevant pipeline(s) on the Remote configuration tab.
Note
If you don’t see the Troubleshoot in Assistant icon, Grafana Assistant might not be enabled on your stack. Contact your stack administrator for more details.
Manually troubleshoot Alloy configuration errors
You can also manually troubleshoot configuration errors in the Fleet Management application. To learn more about a configuration error, go to the Configuration tab in the collector details view of an affected collector. When an error is present, you can see an expandable error panel that includes diagnostic details. Follow these steps to troubleshoot the configuration error without leaving the application.
Note
Diagnostic error information isn’t currently available for OpenTelemetry Collectors.
In your Grafana Cloud instance, click Connections > Fleet Management.
On the Inventory tab, search, filter, or sort to find the affected collector.
Click on the collector ID to open the details view, which takes you directly to the Configuration tab.
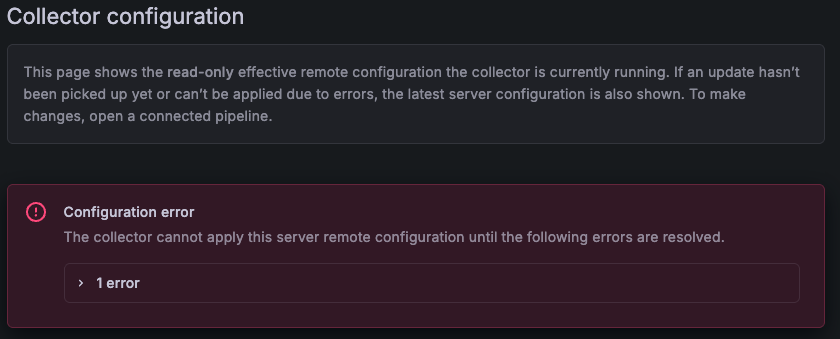
If configuration errors are present, a Configuration error banner appears at the top of the tab. The banner includes an expandable list of individual errors with diagnostic details, including:
- Error messages describing what went wrong.
- Line and column numbers indicating where each error occurs in the remote configuration.
![Red banner titled “Configuration error” with a dropdown error to see specific errors]()
Use the tabs to switch between the Effective config and Server config views. The effective configuration shows the last valid configuration the collector is still running despite the error. The server configuration shows the latest version that contains the error. Comparing the two views helps you identify what changed and caused the failure.
In the Server config view, find the line that corresponds to the error.
Scan backward in the configuration until you find the name of the erroring pipeline. Pipelines are named in a
declareblock. For example, the self-monitoring logs pipeline for Linux systems is named like this:declare "self_monitoring_logs_linux" {Once you know which pipeline caused the error and how to fix it, expand the Connected pipelines section.
Click the Edit icon next to the pipeline to open the editor and make the necessary changes. If the Edit icon is disabled, the pipeline is managed externally by Git, Terraform, or the Instrumentation Hub setup workflow. Make the change in the external source that manages the pipeline, then sync or redeploy it.
Troubleshoot Alloy configuration rollout issues
When you save a configuration pipeline change, Fleet Management waits for the collector to poll and apply the new configuration. During this time, the collector details view shows an Applying status with a spinner icon and an informational banner on the Configuration tab.
If the collector doesn’t apply the configuration within two minutes, Fleet Management flags the rollout as potentially stuck. An unresponsive warning appears in the collector’s Status column on the Inventory page and in its details view.
An unresponsive rollout typically means the collector is offline or otherwise unable to apply the new configuration. For example, it has stopped or is unreachable from the Fleet Management service. To diagnose the issue for Alloy instances:
- Verify that the collector process is running on the host or in the cluster.
- In the collector details view, switch to the Logs tab and search for error messages such as
msg="failed to fetch remote configuration from the API"by pasting them in the case-insensitive search box. - On the Health tab, select the Remote Configuration dashboard from the Alloy health dashboards dropdown menu. Check the panels for configuration load failures around the time the change was made.
- Confirm that the collector has network connectivity to the Fleet Management service. If the collector is behind a firewall or uses a private endpoint, verify the network path is open.
Once the collector comes back online and successfully applies the configuration, the warning indicators clear automatically.


