Caution
Grafana Agent has reached End-of-Life (EOL) on November 1, 2025. Agent is no longer receiving vendor support and will no longer receive security or bug fixes. Current users of Agent Static mode, Agent Flow mode, and Agent Operator should proceed with migrating to Grafana Alloy. If you have already migrated to Alloy, no further action is required. Read more about why we recommend migrating to Grafana Alloy.
Deploy Grafana Agent
Grafana Agent is a flexible, vendor-neutral telemetry collector. This flexibility means that Grafana Agent doesn’t enforce a specific deployment topology but can work in multiple scenarios.
This page lists common topologies used for deployments of Grafana Agent, when to consider using each topology, issues you may run into, and scaling considerations.
As a centralized collection service
Deploying Grafana Agent as a centralized service is recommended for collecting application telemetry. This topology allows you to use a smaller number of agents to coordinate service discovery, collection, and remote writing.
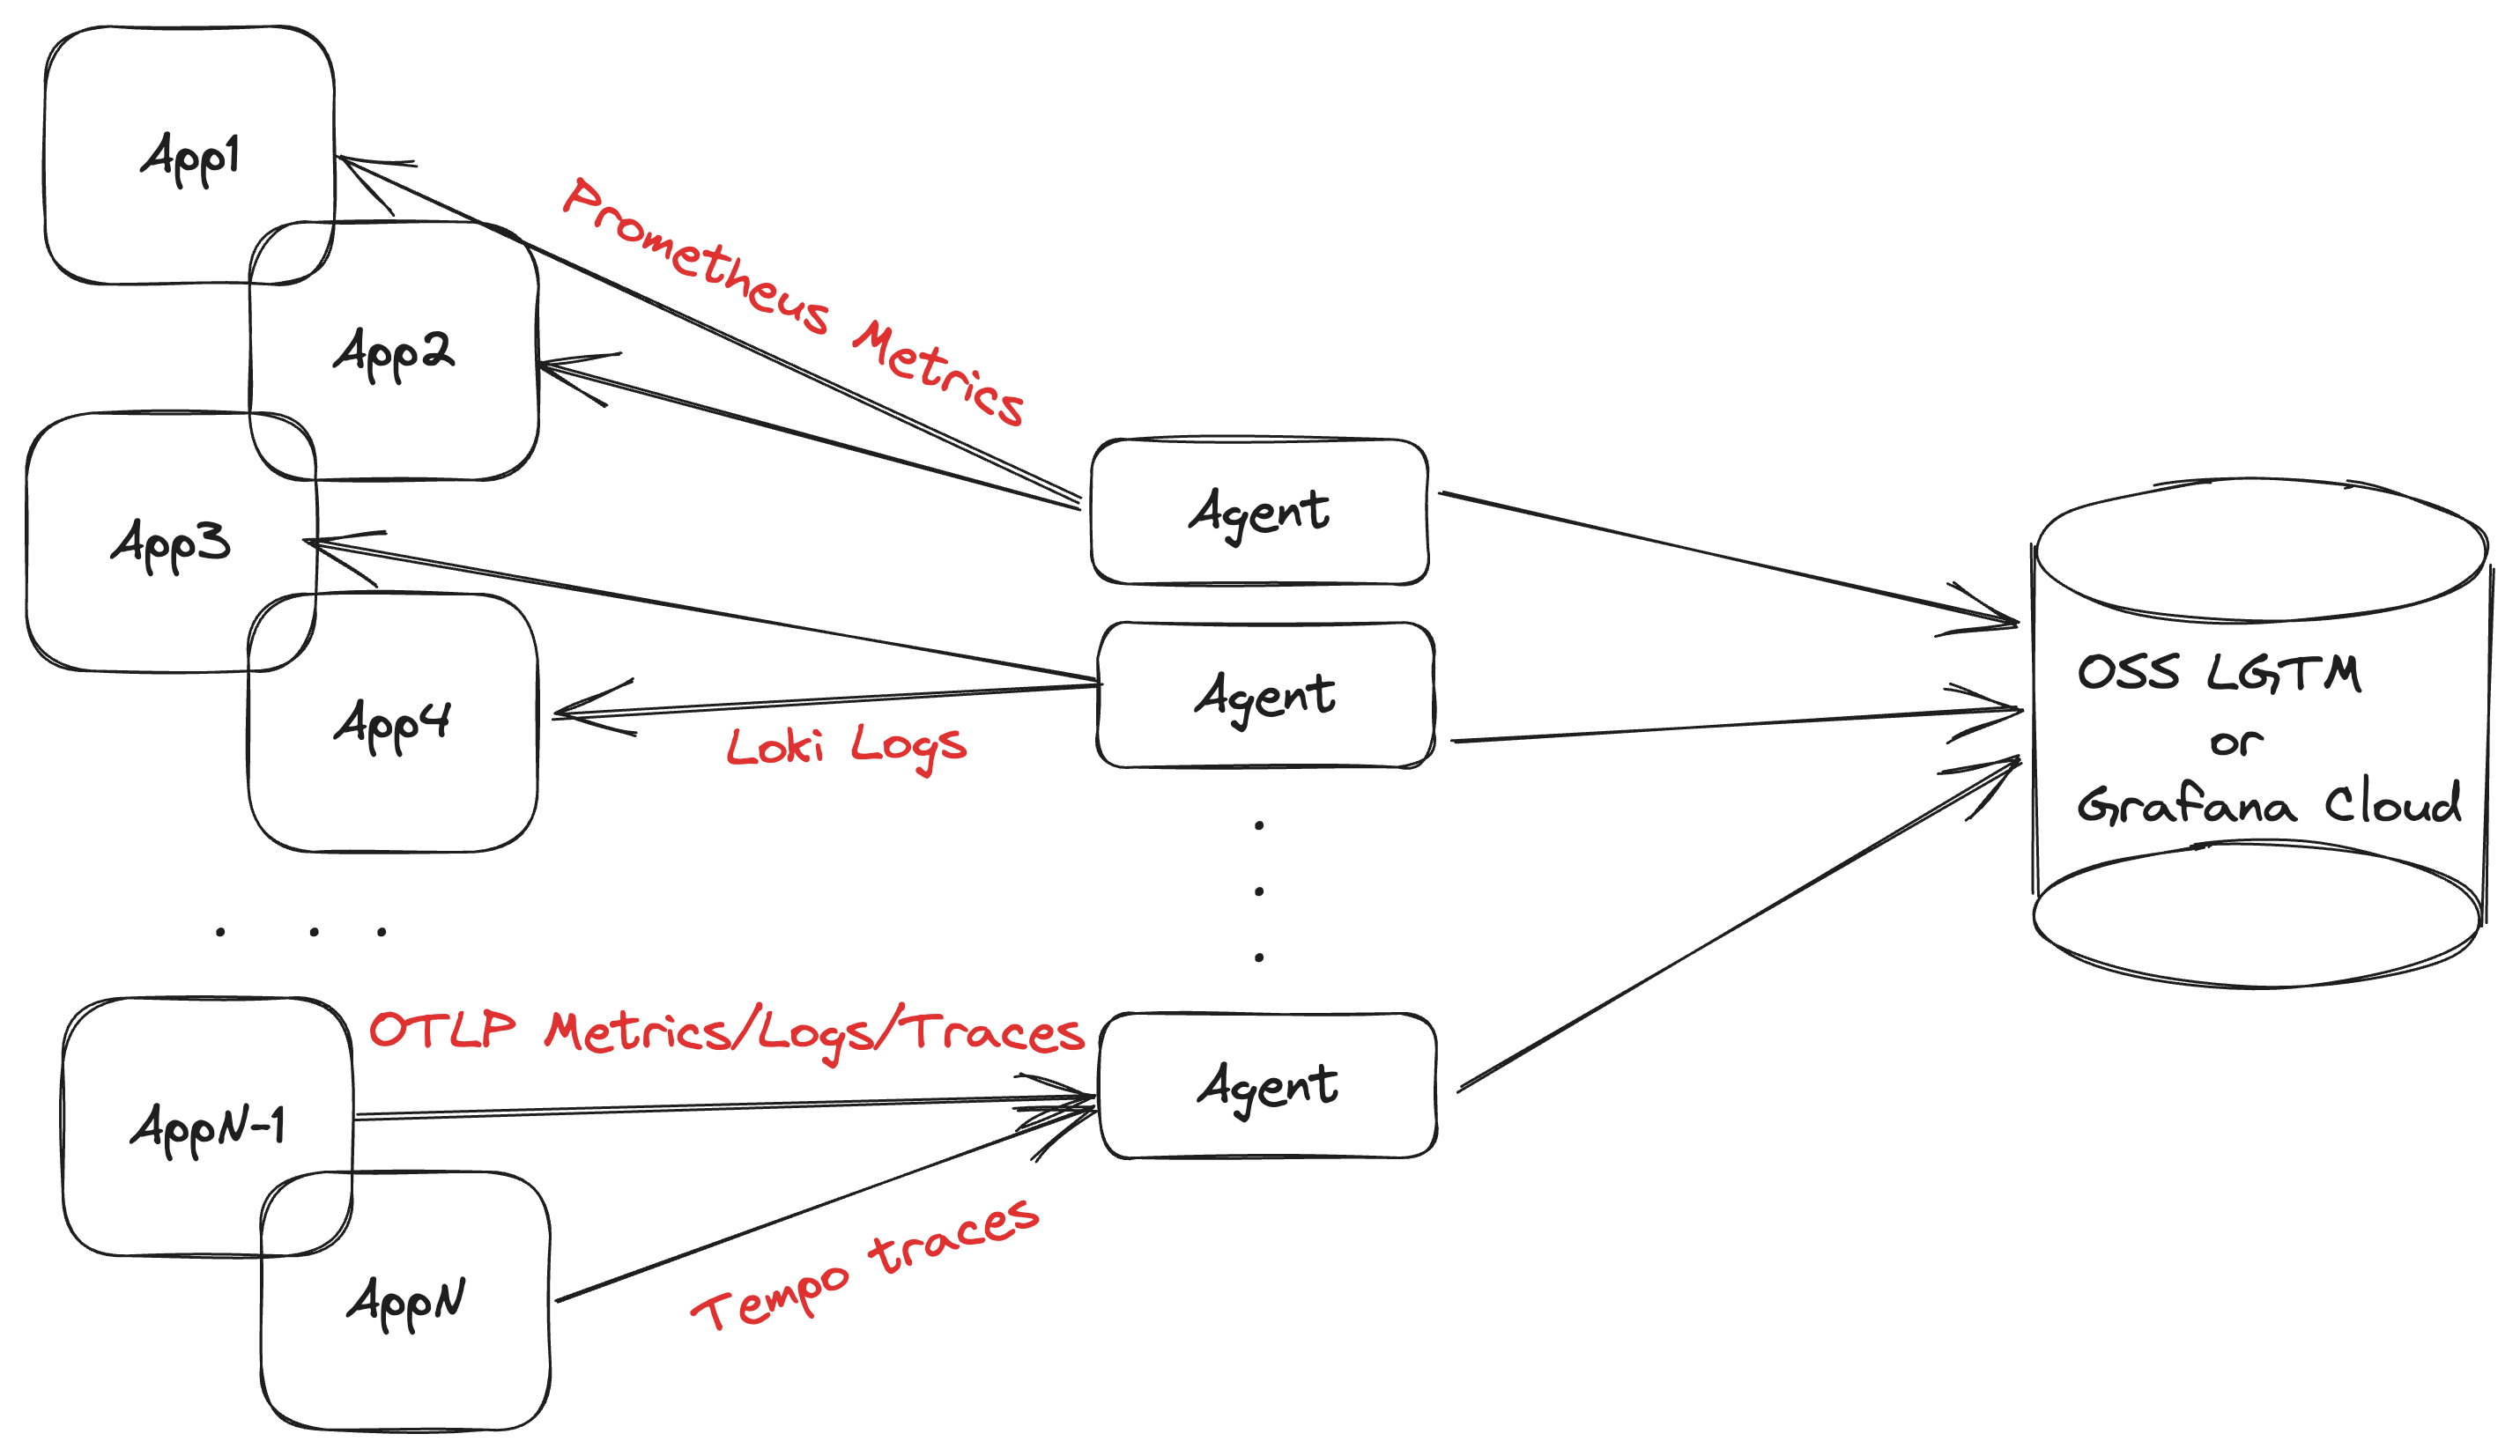
Using this topology requires deploying the Agent on separate infrastructure, and making sure that agents can discover and reach these applications over the network. The main predictor for the size of the agent is the number of active metrics series it is scraping; a rule of thumb is approximately 10 KB of memory for each series. We recommend you start looking towards horizontal scaling around the 1 million active series mark.
Using Kubernetes StatefulSets
Deploying Grafana Agent as a StatefulSet is the recommended option for metrics collection. The persistent pod identifiers make it possible to consistently match volumes with pods so that you can use them for the WAL directory.
You can also use a Kubernetes deployment in cases where persistent storage is not required, such as a traces-only pipeline.
Pros
- Straightforward scaling using clustering or hashmod sharding
- Minimizes the “noisy neighbor” effect
- Easy to meta-monitor
Cons
- Requires running on separate infrastructure
Use for
- Scalable telemetry collection
Don’t use for
- Host-level metrics and logs
As a host daemon
Deploying one Grafana Agent per machine is required for collecting machine-level metrics and logs, such as node_exporter hardware and network metrics or journald system logs.
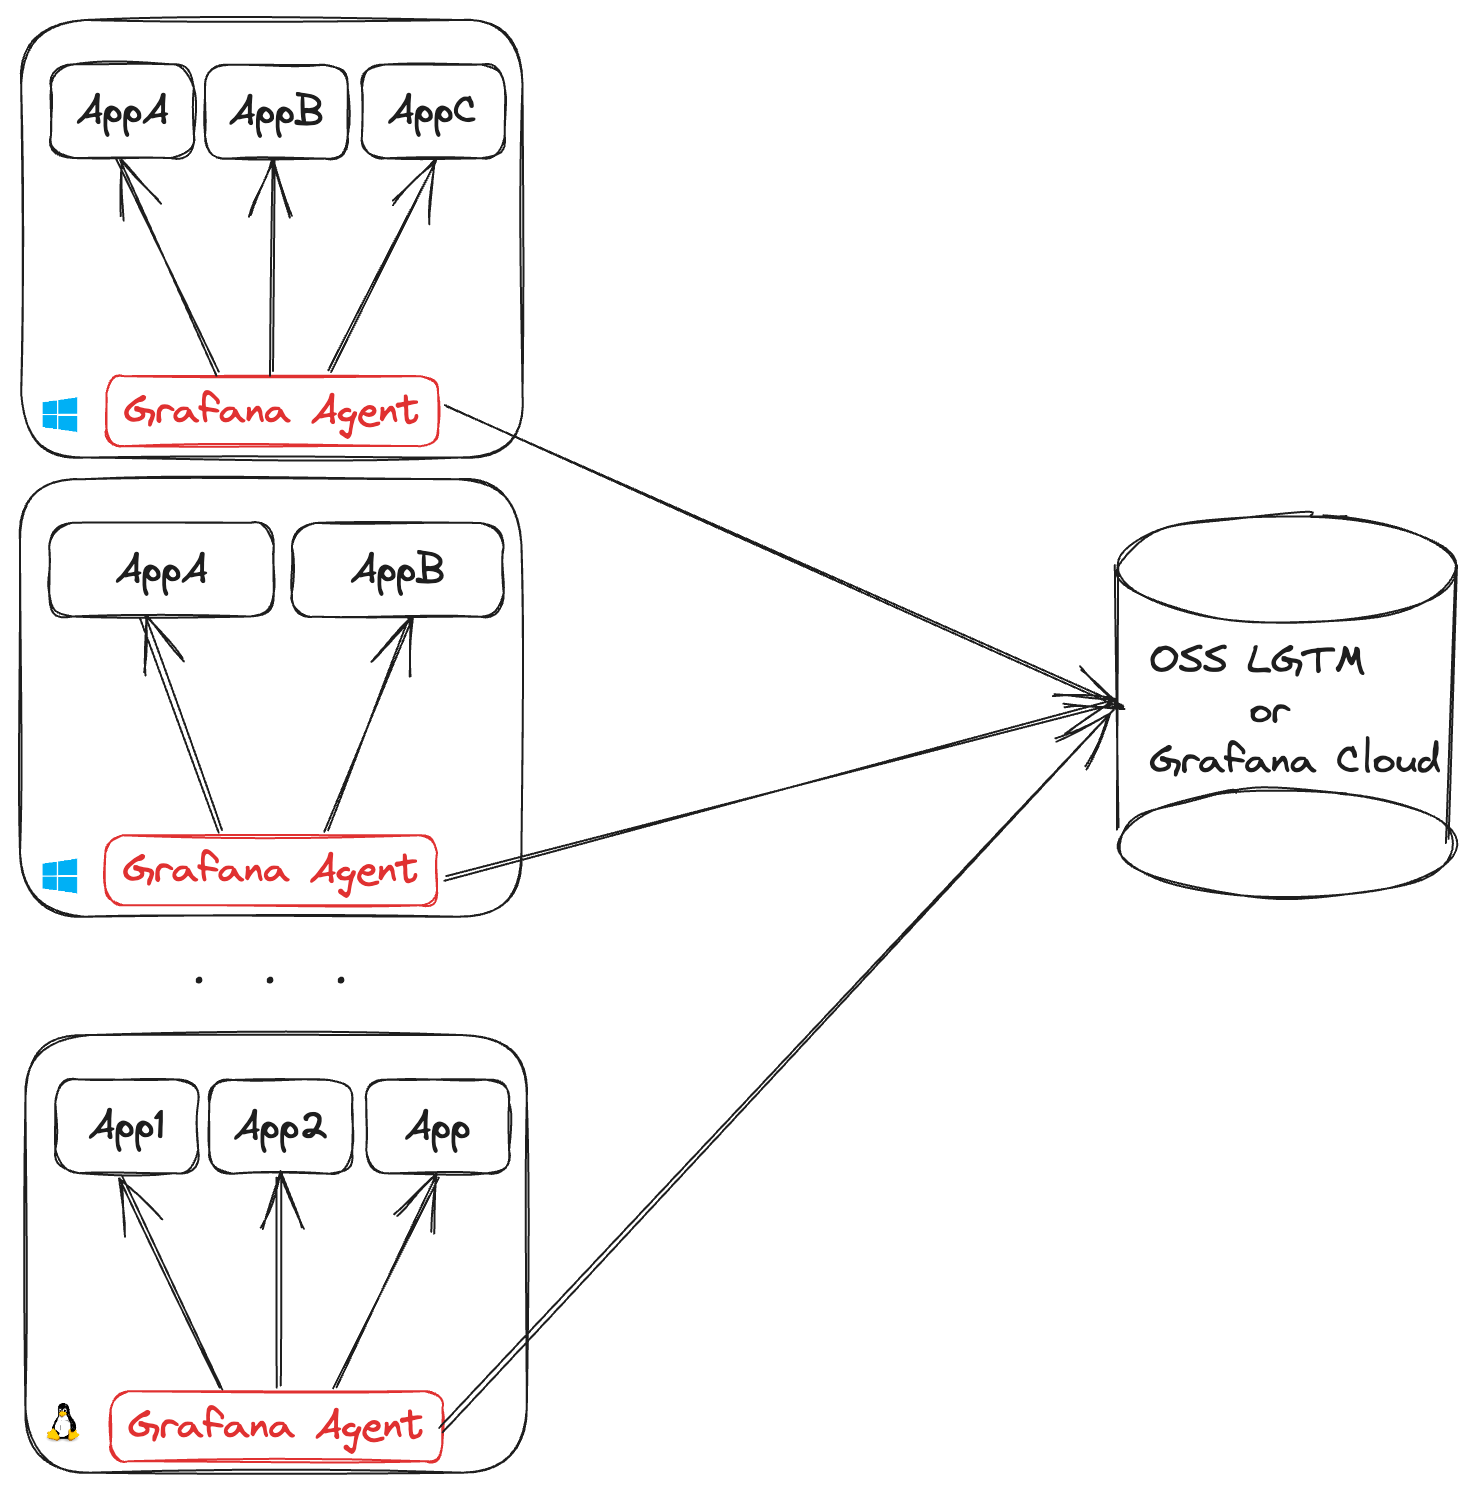
Each Grafana Agent requires you to open an outgoing connection for each remote endpoint it’s shipping data to. This can lead to NAT port exhaustion on the egress infrastructure. Each egress IP can support up to (65535 - 1024 = 64511) outgoing connections on different ports. So, if all agents are shipping metrics and log data, an egress IP can support up to 32,255 agents.
Using Kubernetes DaemonSets
The simplest use case of the host daemon topology is a Kubernetes DaemonSet, and it is required for node-level observability (for example cAdvisor metrics) and collecting pod logs.
Pros
- Doesn’t require running on separate infrastructure
- Typically leads to smaller-sized agents
- Lower network latency to instrumented applications
Cons
- Requires planning a process for provisioning Grafana Agent on new machines, as well as keeping configuration up to date to avoid configuration drift
- Not possible to scale agents independently when using Kubernetes DaemonSets
- Scaling the topology can strain external APIs (like service discovery) and network infrastructure (like firewalls, proxy servers, and egress points)
Use for
- Collecting machine-level metrics and logs (for example, node_exporter hardware metrics, Kubernetes pod logs)
Don’t use for
- Scenarios where Grafana Agent grows so large it can become a noisy neighbor
- Collecting an unpredictable amount of telemetry
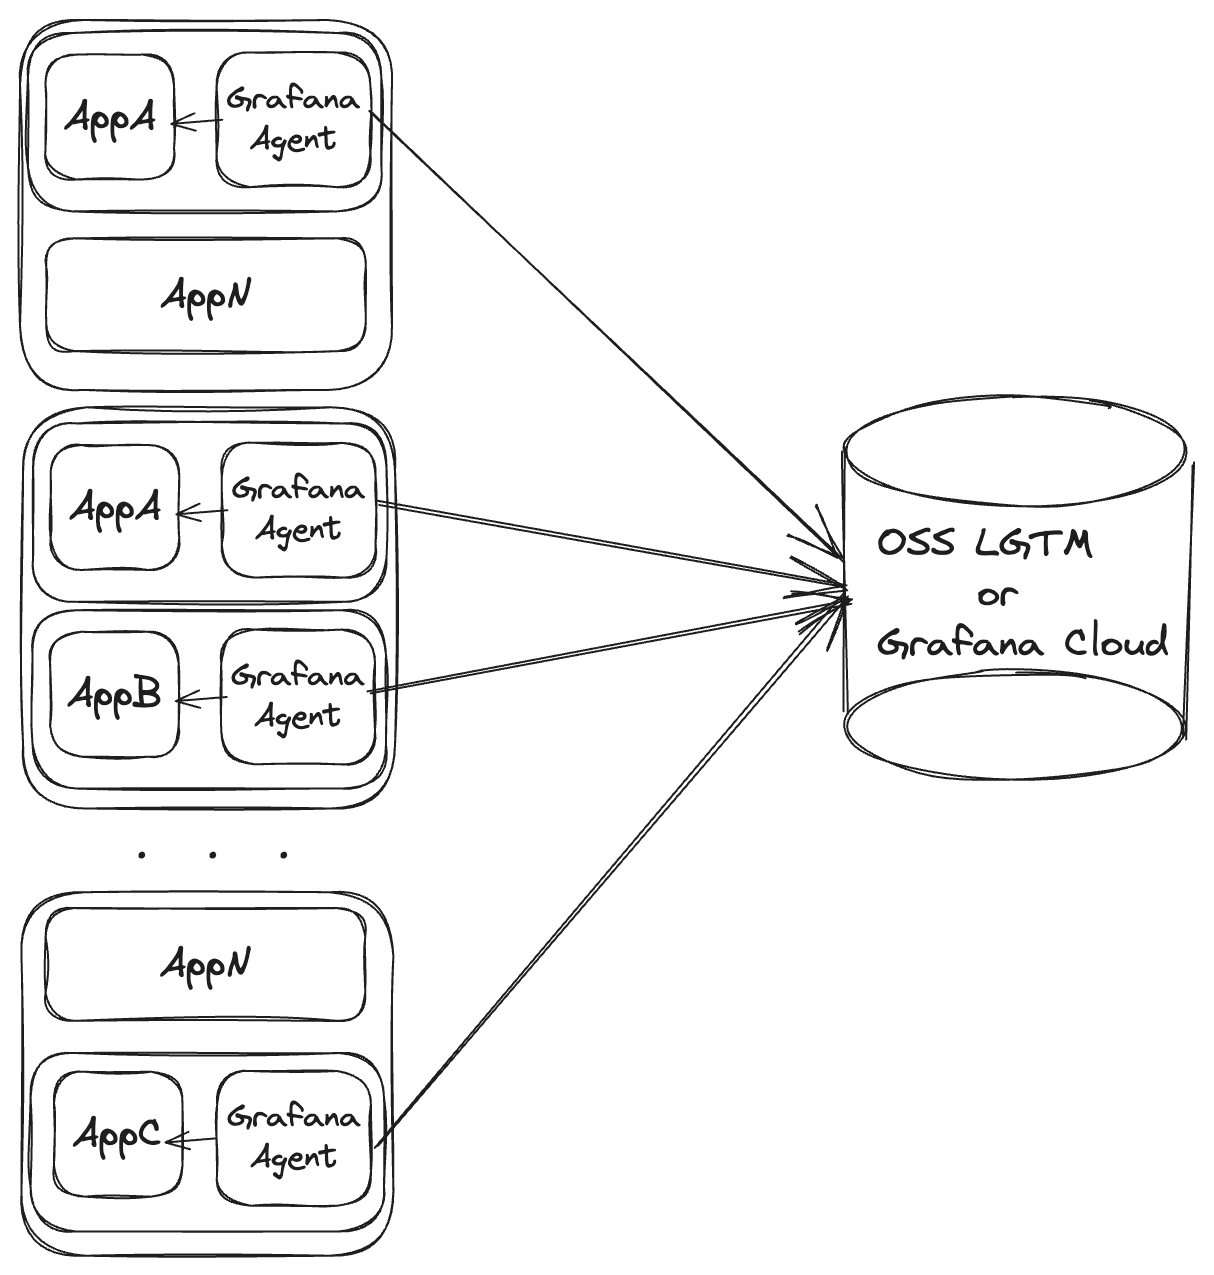
As a container sidecar
Deploying Grafana Agent as a container sidecar is only recommended for short-lived applications or specialized agent deployments.
Using Kubernetes pod sidecars
In a Kubernetes environment, the sidecar model consists of deploying Grafana Agent as an extra container on the pod. The pod’s controller, network configuration, enabled capabilities, and available resources are shared between the actual application and the sidecar agent.
Pros
- Doesn’t require running on separate infrastructure
- Straightforward networking with partner applications
Cons
- Doesn’t scale separately
- Makes resource consumption harder to monitor and predict
- Agents do not have a life cycle of their own, making it harder to reason about things like recovering from network outages
Use for
- Serverless services
- Job/batch applications that work with a push model
- Air-gapped applications that can’t be otherwise reached over the network
Don’t use for
- Long-lived applications
- Scenarios where the agent size grows so large it can become a noisy neighbor
For scalable ingestion of traces
For small workloads, it is normal to have just one Agent handle all incoming spans with no need of load balancing. However, for large workloads it is desirable to spread out the load of processing spans over multiple Agent instances.
To scale the Agent for trace ingestion, do the following:
- Set up the
load_balancingsection of the Agent’stracesconfig. - Start multiple Agent instances, all with the same configuration, so that:
- Each Agent load balances using the same strategy.
- Each Agent processes spans in the same way.
- The cluster of Agents is now setup for load balancing. It works as follows:
- Any of the Agents can receive spans from instrumented applications via the configured
receivers. - When an Agent firstly receives spans, it will forward them to any of the Agents in the cluster according to the
load_balancingconfiguration.
- Any of the Agents can receive spans from instrumented applications via the configured
tail_sampling
If some of the spans for a trace end up in a different Agent, tail_sampling will not sample correctly.
Enabling load_balancing is necessary if tail_sampling is enabled and when there could be more than one Agent instance processing spans for the same trace.
load_balancing will make sure that all spans of a given trace will be processed by the same Agent instance.
spanmetrics
All spans for a given service.name must be processed by the same spanmetrics Agent.
To make sure that this is the case, set up load_balancing with routing_key: service.
service_graphs
It is challenging to scale service_graphs over multiple Agent instances.
- For
service_graphsto work correctly, each “client” span must be paired with a “server” span in order to calculate metrics such as span duration. - If a “client” span goes to one Agent, but a “server” span goes to another Agent, then no single Agent will be able to pair the spans and a metric won’t be generated.
load_balancing can solve this problem partially if it is configured with routing_key: traceID.
- Each Agent will then be able to calculate service graph for each “client”/“server” pair in a trace.
- However, it is possible to have a span with similar “server”/“client” values in a different trace, processed by another Agent.
- If two different Agents process similar “server”/“client” spans, they will generate the same service graph metric series.
- If the series from two Agents are the same, this will lead to issues when writing them to the backend database.
- Users could differentiate the series by adding a label such as
"agent_id".- Unfortunately, there is currently no method in the Agent to aggregate those series from different Agents and merge them into one series.
- A PromQL query could be used to aggregate the metrics from different Agents.
- If the metrics are stored in Grafana Mimir, cardinality issues due to
"agent_id"labels can be solved using Adaptive Metrics.
A simpler, more scalable alternative to generating service graph metrics in the Agent is to generate them entirely in the backend database. For example, service graphs can be generated in Grafana Cloud by the Tempo traces database.
Example Kubernetes configuration
apiVersion: v1
kind: Namespace
metadata:
  name: grafana-cloud-monitoring
---
apiVersion: v1
kind: Service
metadata:
  name: agent-traces
  namespace: grafana-cloud-monitoring
spec:
  ports:
  - name: agent-traces-otlp-grpc
    port: 9411
    protocol: TCP
    targetPort: 9411
  selector:
    name: agent-traces
---
apiVersion: apps/v1
kind: Deployment
metadata:
  name: k6-trace-generator
  namespace: grafana-cloud-monitoring
spec:
  minReadySeconds: 10
  replicas: 1
  revisionHistoryLimit: 1
  selector:
    matchLabels:
      name: k6-trace-generator
  template:
    metadata:
      labels:
        name: k6-trace-generator
    spec:
      containers:
      - env:
        - name: ENDPOINT
          value: agent-traces-headless.grafana-cloud-monitoring.svc.cluster.local:9411
        image: ghcr.io/grafana/xk6-client-tracing:v0.0.2
        imagePullPolicy: IfNotPresent
        name: k6-trace-generator
---
apiVersion: apps/v1
kind: Deployment
metadata:
  name: agent-traces
  namespace: grafana-cloud-monitoring
spec:
  minReadySeconds: 10
  replicas: 3
  revisionHistoryLimit: 1
  selector:
    matchLabels:
      name: agent-traces
  template:
    metadata:
      labels:
        name: agent-traces
    spec:
      containers:
      - args:
        - -config.file=/etc/agent/agent.yaml
        command:
        - /bin/grafana-agent
        image: grafana/agent:v0.38.0
        imagePullPolicy: IfNotPresent
        name: agent-traces
        ports:
        - containerPort: 9411
          name: otlp-grpc
          protocol: TCP
        - containerPort: 34621
          name: agent-lb
          protocol: TCP
        volumeMounts:
        - mountPath: /etc/agent
          name: agent-traces
      volumes:
      - configMap:
          name: agent-traces
        name: agent-traces
---
apiVersion: v1
kind: Service
metadata:
  name: agent-traces-headless
  namespace: grafana-cloud-monitoring
spec:
  clusterIP: None
  ports:
  - name: agent-lb
    port: 34621
    protocol: TCP
    targetPort: agent-lb
  selector:
    name: agent-traces
  type: ClusterIP
---
apiVersion: v1
kind: ConfigMap
metadata:
  name: agent-traces
  namespace: grafana-cloud-monitoring
data:
  agent.yaml: |
    traces:
      configs:
      - name: default
        load_balancing:
          exporter:
            insecure: true
          resolver:
            dns:
              hostname: agent-traces-headless.grafana-cloud-monitoring.svc.cluster.local
              port: 34621
              timeout: 5s
              interval: 60s
          receiver_port: 34621
        receivers:
          otlp:
            protocols:
              grpc:
                endpoint: 0.0.0.0:9411
        remote_write:
        - basic_auth:
            username: 111111
            password: pass
          endpoint: tempo-prod-06-prod-gb-south-0.grafana.net:443
          retry_on_failure:
enabled: falseapiVersion: v1
kind: Namespace
metadata:
name: grafana-cloud-monitoring
---
apiVersion: v1
kind: ServiceAccount
metadata:
name: grafana-agent-traces
namespace: grafana-cloud-monitoring
---
apiVersion: rbac.authorization.k8s.io/v1
kind: Role
metadata:
name: grafana-agent-traces-role
namespace: grafana-cloud-monitoring
rules:
- apiGroups:
- ""
resources:
- endpoints
verbs:
- list
- watch
- get
---
apiVersion: rbac.authorization.k8s.io/v1
kind: RoleBinding
metadata:
name: grafana-agent-traces-rolebinding
namespace: grafana-cloud-monitoring
roleRef:
apiGroup: rbac.authorization.k8s.io
kind: Role
name: grafana-agent-traces-role
subjects:
- kind: ServiceAccount
name: grafana-agent-traces
namespace: grafana-cloud-monitoring
---
apiVersion: v1
kind: Service
metadata:
name: agent-traces
namespace: grafana-cloud-monitoring
spec:
ports:
- name: agent-traces-otlp-grpc
port: 9411
protocol: TCP
targetPort: 9411
selector:
name: agent-traces
---
apiVersion: apps/v1
kind: Deployment
metadata:
name: k6-trace-generator
namespace: grafana-cloud-monitoring
spec:
minReadySeconds: 10
replicas: 1
revisionHistoryLimit: 1
selector:
matchLabels:
name: k6-trace-generator
template:
metadata:
labels:
name: k6-trace-generator
spec:
containers:
- env:
- name: ENDPOINT
value: agent-traces-headless.grafana-cloud-monitoring.svc.cluster.local:9411
image: ghcr.io/grafana/xk6-client-tracing:v0.0.2
imagePullPolicy: IfNotPresent
name: k6-trace-generator
---
apiVersion: apps/v1
kind: Deployment
metadata:
name: agent-traces
namespace: grafana-cloud-monitoring
spec:
minReadySeconds: 10
replicas: 3
revisionHistoryLimit: 1
selector:
matchLabels:
name: agent-traces
template:
metadata:
labels:
name: agent-traces
spec:
containers:
- args:
- -config.file=/etc/agent/agent.yaml
command:
- /bin/grafana-agent
image: grafana/agent:v0.38.0
imagePullPolicy: IfNotPresent
name: agent-traces
ports:
- containerPort: 9411
name: otlp-grpc
protocol: TCP
- containerPort: 34621
name: agent-lb
protocol: TCP
volumeMounts:
- mountPath: /etc/agent
name: agent-traces
serviceAccount: grafana-agent-traces
volumes:
- configMap:
name: agent-traces
name: agent-traces
---
apiVersion: v1
kind: Service
metadata:
name: agent-traces-headless
namespace: grafana-cloud-monitoring
spec:
clusterIP: None
ports:
- name: agent-lb
port: 34621
protocol: TCP
targetPort: agent-lb
selector:
name: agent-traces
type: ClusterIP
---
apiVersion: v1
kind: ConfigMap
metadata:
name: agent-traces
namespace: grafana-cloud-monitoring
data:
agent.yaml: |
traces:
configs:
- name: default
load_balancing:
exporter:
insecure: true
resolver:
kubernetes:
service: agent-traces-headless
ports:
- 34621
receiver_port: 34621
receivers:
otlp:
protocols:
grpc:
endpoint: 0.0.0.0:9411
remote_write:
- basic_auth:
username: 111111
password: pass
endpoint: tempo-prod-06-prod-gb-south-0.grafana.net:443
retry_on_failure:
enabled: false```You need to fill in correct OTLP credentials prior to running the above examples. The example above can be started by using k3d:
k3d cluster create grafana-agent-lb-test
kubectl apply -f kubernetes_config.yaml
To delete the cluster, run:
k3d cluster delete grafana-agent-lb-test

