
Ruby Rack integration for Grafana Cloud
The Rack webserver interface for Ruby allows easily building web applications. This integration enables the agent to send metrics to Grafana Cloud along with a useful default dashboard for visualization.
This integration includes 1 pre-built dashboard to help monitor and visualize Ruby Rack metrics.
Grafana Alloy configuration
Before you begin
This integration monitors a Rack web application (e.g. any Sinatra or Rails application) using the Collector middleware included in the Ruby Prometheus client library.
To get started, add the Prometheus client library to your Gemfile:
gem 'prometheus-client'Then change the config.ru file of your Rack application to use the Prometheus Collector and Exporter middlewares before running your app:
require 'prometheus/middleware/collector'
require 'prometheus/middleware/exporter'

use Prometheus::Middleware::Collector
use Prometheus::Middleware::Exporter

run Sinatra::Application
You can refer to this example Sinatra app for a complete setup of the Prometheus client library.
Install Ruby Rack integration for Grafana Cloud
- In your Grafana Cloud stack, click Connections in the left-hand menu.
- Find Ruby Rack and click its tile to open the integration.
- Review the prerequisites in the Configuration Details tab and set up Grafana Agent to send Ruby Rack metrics to your Grafana Cloud instance.
- Click Install to add this integration’s pre-built dashboard to your Grafana Cloud instance, and you can start monitoring your Ruby Rack setup.
Configuration snippets for Grafana Alloy
Simple mode
These snippets are configured to scrape a single Ruby Rack instance running locally with default ports.
Copy and paste the following snippets into your Grafana Alloy configuration file.
Metrics snippets
discovery.relabel "metrics_integrations_integrations_ruby_rack" {
	targets = [{
		__address__ = "localhost:9292",
	}]

	rule {
		target_label = "instance"
		replacement  = constants.hostname
	}
}

prometheus.scrape "metrics_integrations_integrations_ruby_rack" {
	targets    = discovery.relabel.metrics_integrations_integrations_ruby_rack.output
	forward_to = [prometheus.remote_write.metrics_service.receiver]
	job_name   = "integrations/ruby-rack"
}
Advanced mode
The following snippets provide examples to guide you through the configuration process.
To instruct Grafana Alloy to scrape your Ruby Rack instances, copy and paste the snippets to your configuration file and follow subsequent instructions.
Advanced metrics snippets
discovery.relabel "metrics_integrations_integrations_ruby_rack" {
	targets = [{
		__address__ = "localhost:9292",
	}]

	rule {
		target_label = "instance"
		replacement  = constants.hostname
	}
}

prometheus.scrape "metrics_integrations_integrations_ruby_rack" {
	targets    = discovery.relabel.metrics_integrations_integrations_ruby_rack.output
	forward_to = [prometheus.remote_write.metrics_service.receiver]
	job_name   = "integrations/ruby-rack"
}
To monitor your Ruby Rack instance, you must use a discovery.relabel component to discover your Ruby Rack Prometheus endpoint and apply appropriate labels, followed by a prometheus.scrape component to scrape it.
Configure the following properties within each discovery.relabel component:
__address__: The address to your Ruby Rack Prometheus metrics endpoint.instancelabel:constants.hostnamesets theinstancelabel to your Grafana Alloy server hostname. If that is not suitable, change it to a value uniquely identifies this Ruby Rack instance.
If you have multiple Ruby Rack servers to scrape, configure one discovery.relabel for each and scrape them by including each under targets within the prometheus.scrape component.
Grafana Agent configuration
Before you begin
This integration monitors a Rack web application (e.g. any Sinatra or Rails application) using the Collector middleware included in the Ruby Prometheus client library.
To get started, add the Prometheus client library to your Gemfile:
gem 'prometheus-client'Then change the config.ru file of your Rack application to use the Prometheus Collector and Exporter middlewares before running your app:
require 'prometheus/middleware/collector'
require 'prometheus/middleware/exporter'

use Prometheus::Middleware::Collector
use Prometheus::Middleware::Exporter

run Sinatra::Application
You can refer to this example Sinatra app for a complete setup of the Prometheus client library.
Install Ruby Rack integration for Grafana Cloud
- In your Grafana Cloud stack, click Connections in the left-hand menu.
- Find Ruby Rack and click its tile to open the integration.
- Review the prerequisites in the Configuration Details tab and set up Grafana Agent to send Ruby Rack metrics to your Grafana Cloud instance.
- Click Install to add this integration’s pre-built dashboard to your Grafana Cloud instance, and you can start monitoring your Ruby Rack setup.
Post-install configuration for the Ruby Rack integration
After enabling the metrics generation, you should instruct Grafana Agent to scrape your Ruby application.
The Ruby Prometheus client lib exposes a /metrics endpoint. To scrape it, add the provided snippet to your agent configuration file.
Make sure to change targets in the snippet according to your environment.
Configuration snippets for Grafana Agent
Below metrics.configs.scrape_configs, insert the following lines and change the URLs according to your environment:
    - job_name: integrations/ruby-rack
      relabel_configs:
        - replacement: '<your-instance-name>'
          target_label: instance
      static_configs:
        - targets: ['localhost:9292']
Full example configuration for Grafana Agent
Refer to the following Grafana Agent configuration for a complete example that contains all the snippets used for the Ruby Rack integration. This example also includes metrics that are sent to monitor your Grafana Agent instance.
integrations:
  prometheus_remote_write:
  - basic_auth:
      password: <your_prom_pass>
      username: <your_prom_user>
    url: <your_prom_url>
  agent:
    enabled: true
    relabel_configs:
    - action: replace
      source_labels:
      - agent_hostname
      target_label: instance
    - action: replace
      target_label: job
      replacement: "integrations/agent-check"
    metric_relabel_configs:
    - action: keep
      regex: (prometheus_target_sync_length_seconds_sum|prometheus_target_scrapes_.*|prometheus_target_interval.*|prometheus_sd_discovered_targets|agent_build.*|agent_wal_samples_appended_total|process_start_time_seconds)
      source_labels:
      - __name__
  # Add here any snippet that belongs to the `integrations` section.
  # For a correct indentation, paste snippets copied from Grafana Cloud at the beginning of the line.
logs:
  configs:
  - clients:
    - basic_auth:
        password: <your_loki_pass>
        username: <your_loki_user>
      url: <your_loki_url>
    name: integrations
    positions:
      filename: /tmp/positions.yaml
    scrape_configs:
      # Add here any snippet that belongs to the `logs.configs.scrape_configs` section.
      # For a correct indentation, paste snippets copied from Grafana Cloud at the beginning of the line.
metrics:
  configs:
  - name: integrations
    remote_write:
    - basic_auth:
        password: <your_prom_pass>
        username: <your_prom_user>
      url: <your_prom_url>
    scrape_configs:
      # Add here any snippet that belongs to the `metrics.configs.scrape_configs` section.
      # For a correct indentation, paste snippets copied from Grafana Cloud at the beginning of the line.
    - job_name: integrations/ruby-rack
      relabel_configs:
        - replacement: '<your-instance-name>'
          target_label: instance
      static_configs:
        - targets: ['localhost:9292']
  global:
    scrape_interval: 60s
  wal_directory: /tmp/grafana-agent-wal
Dashboards
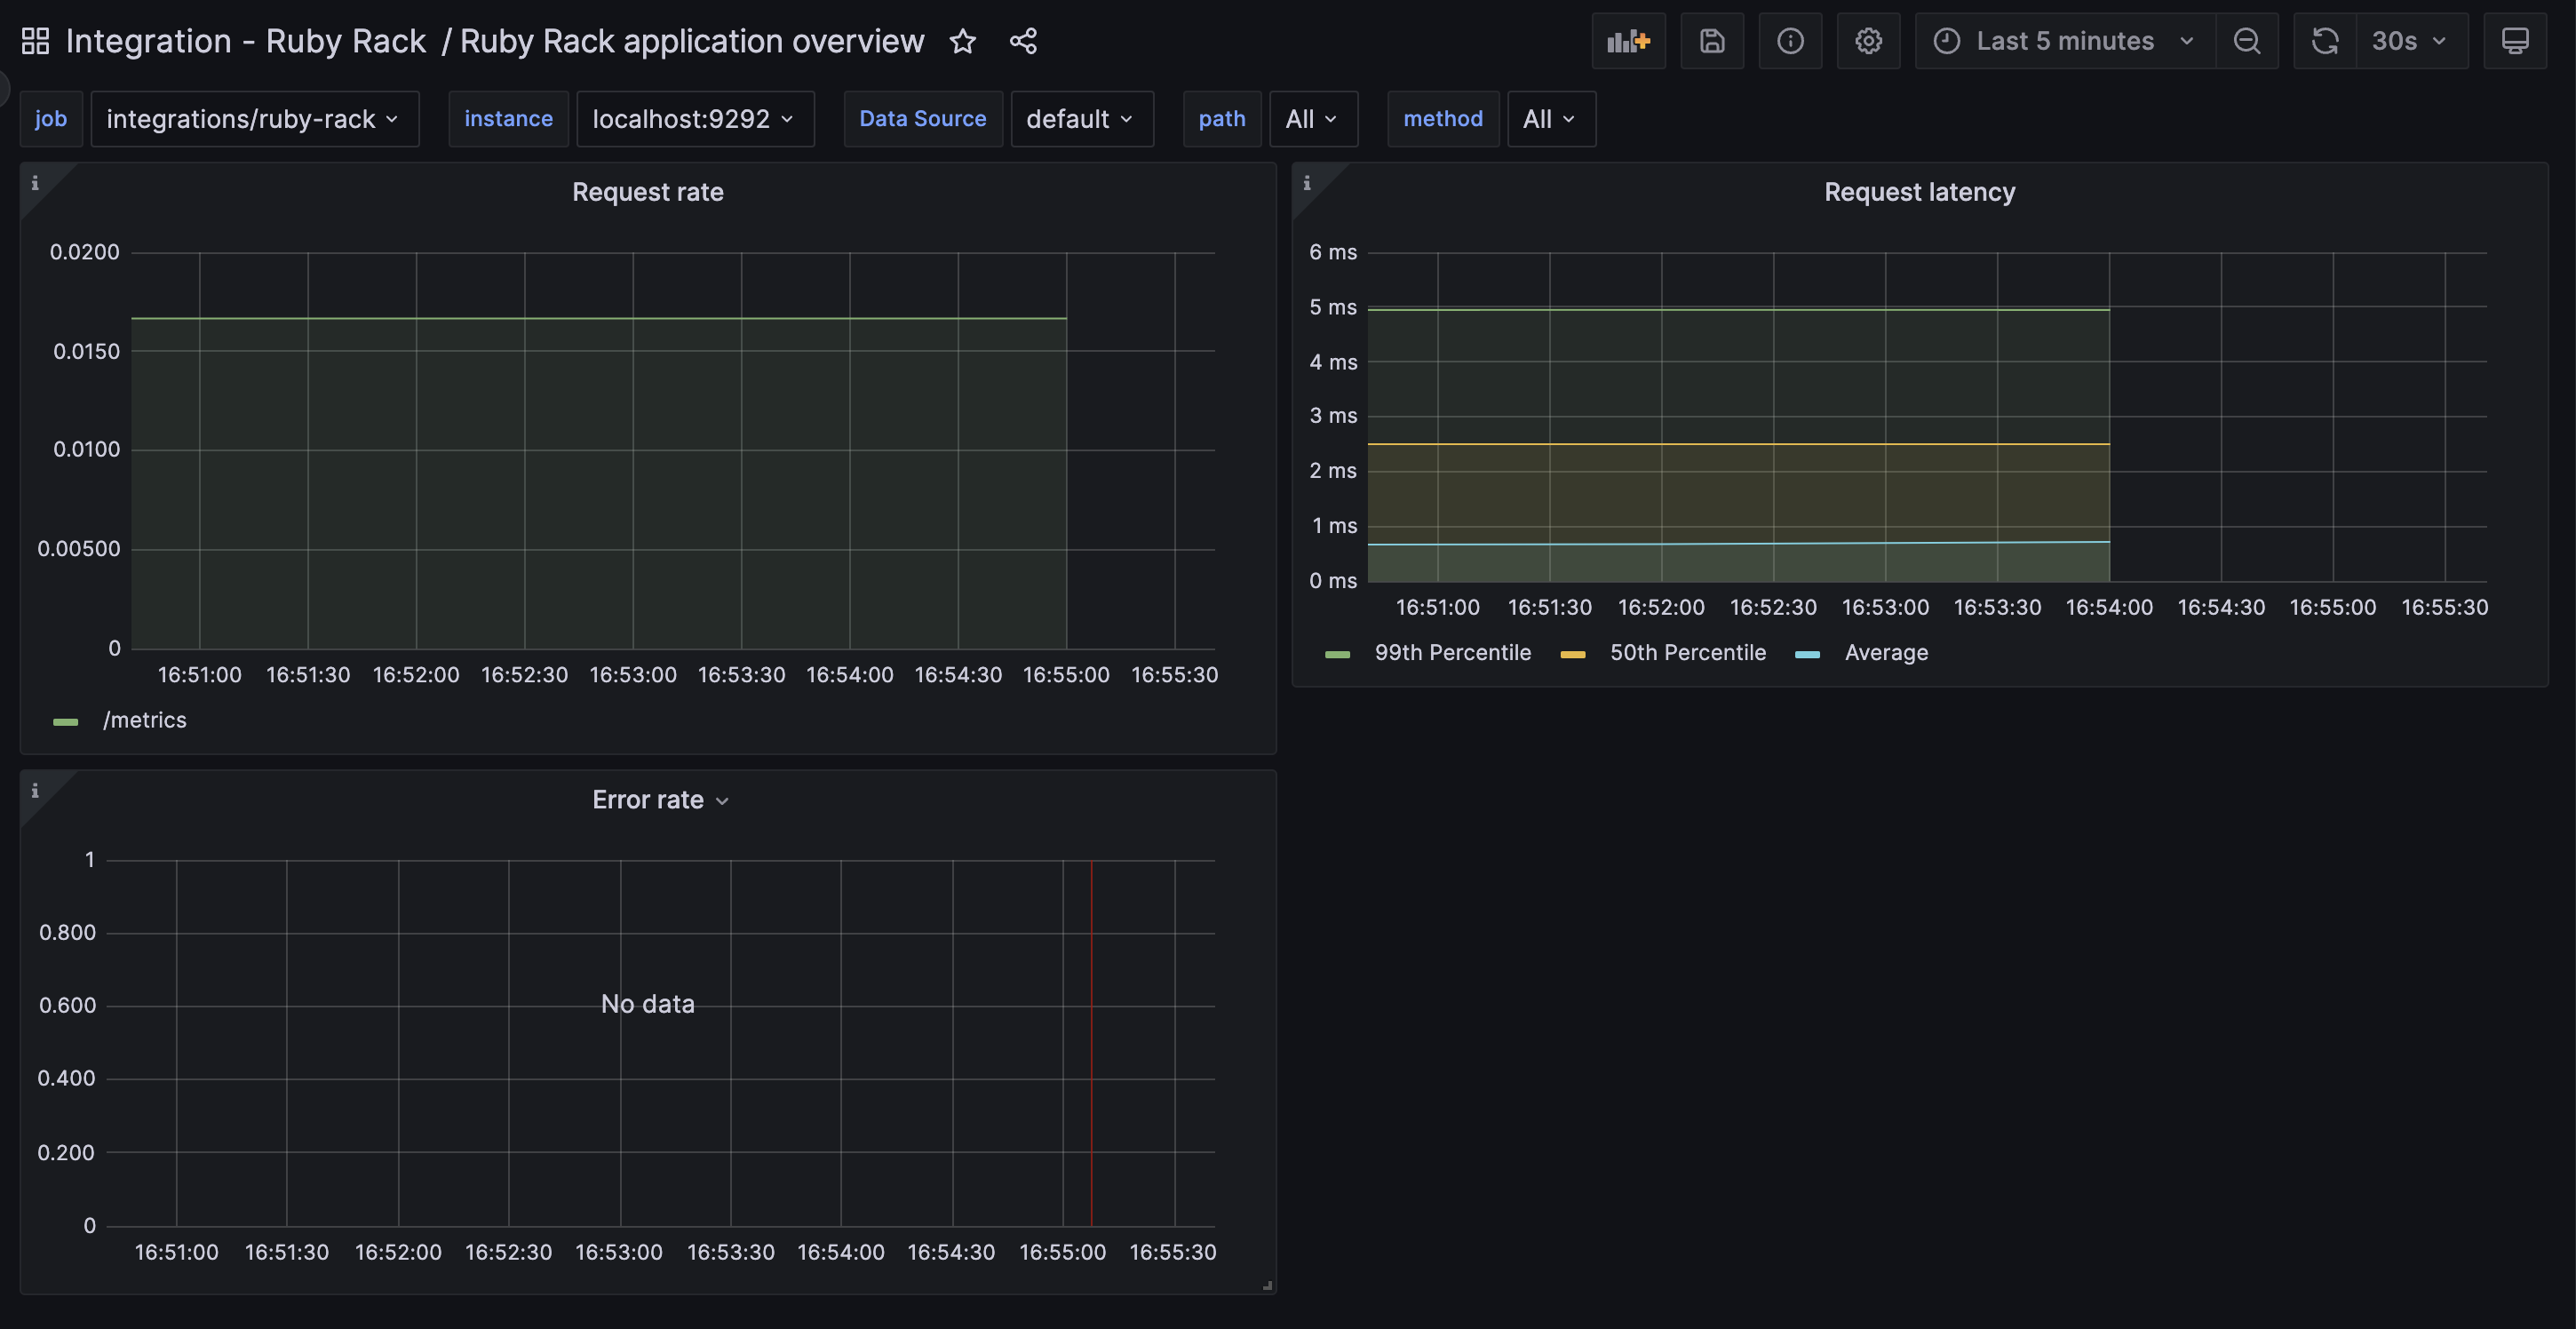
The Ruby Rack integration installs the following dashboards in your Grafana Cloud instance to help monitor your system.
- Ruby Rack application overview
Ruby Rack Overview
Metrics
The most important metrics provided by the Ruby Rack integration, which are used on the pre-built dashboard, are as follows:
- http_server_request_duration_seconds_bucket
- http_server_request_duration_seconds_count
- http_server_request_duration_seconds_sum
- http_server_requests_total
- up
Changelog
# 1.0.0 - February 2024

* Update mixin to replace all Angular panels with React based panels.

# 0.0.4 - September 2023

* New Filter Metrics option for configuring the Grafana Agent, which saves on metrics cost by dropping any metric not used by this integration. Beware that anything custom built using metrics that are not on the snippet will stop working.
* New hostname relabel option, which applies the instance name you write on the text box to the Grafana Agent configuration snippets, making it easier and less error prone to configure this mandatory label.

# 0.0.3 - September 2022

* Update dashboard panels descriptions.

# 0.0.2 - October 2021

* Update mixin to latest version:
  - Update queries to use $__rate_interval

# 0.0.1 - February 2021

* Initial release
Cost
By connecting your Ruby Rack instance to Grafana Cloud, you might incur charges. To view information on the number of active series that your Grafana Cloud account uses for metrics included in each Cloud tier, see Active series and dpm usage and Cloud tier pricing.
Was this page helpful?
Related resources from Grafana Labs


