

Kubernetes Monitoring pricing
Kubernetes Monitoring bills on active host hours and active container hours in a calendar month. Usage is metered from kube-state-metrics, so what you’re billed for depends on what that exporter reports.
For current rates, refer to the pricing page.
How Kubernetes Monitoring is billed
Billing starts when a host or container sends kube-state-metrics to Grafana Cloud after Kubernetes Monitoring is activated. Two meters run in parallel:
- Host hours for each active Kubernetes node.
- Container hours for each active container.
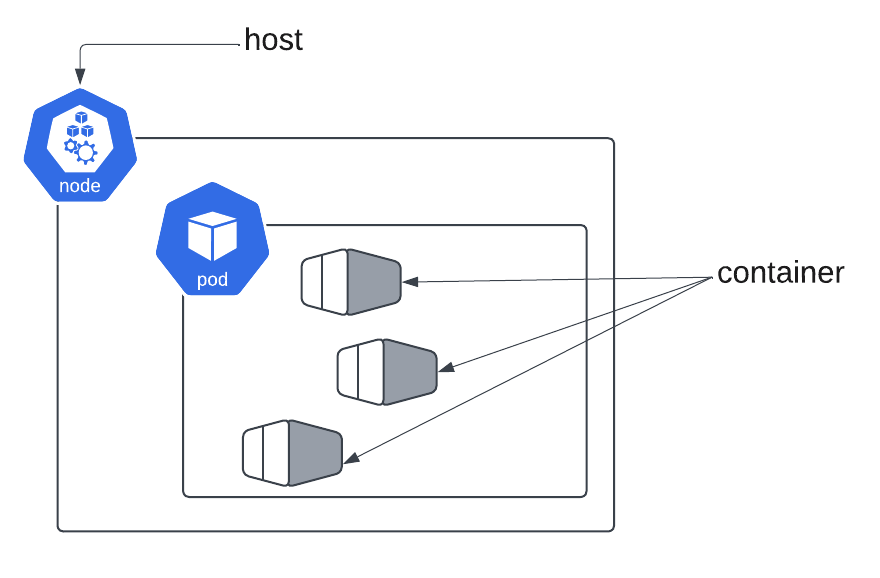
Kubernetes Monitoring usage means gathering metrics for Kubernetes infrastructure components, such as:
- Whether a Pod or container is running and healthy
- Whether the workload replicas match the actual replicas
- CPU, memory, network, and storage for clusters, nodes, and so on
Telemetry from other products running on the same cluster isn’t Kubernetes Monitoring usage and is billed separately. That includes an integration such as NGINX, an application monitored by Application Observability, and Frontend Observability.
Definitions
Host: The Kubernetes node, whether it’s a virtual machine or a physical machine, as reported by kube-state-metrics. A Pod isn’t a host. Pods are groups of one or more containers that run within nodes, and the node is the host.
Container: A container running on an active node and reported by kube-state-metrics.
Active: A host or container is active if kube-state-metrics has reported data for it within the last 15 minutes.
How usage is calculated
Grafana meters hosts only while they’re active rather than charging for the whole month. Metering begins as soon as one minute of host or container activity is captured, and the minimum tracked is 15 minutes plus the active time:
- Container A monitored for 2 minutes: 15 + 2 = 17 minutes billed
- Container B monitored for 43 minutes: 15 + 43 = 58 minutes billed
- Node C monitored for 70 minutes: 15 + 70 = 85 minutes billed
Billable hours are the number of hosts or containers multiplied by the hours each is active. One host active for 24 hours a day across a 30-day month is:
1 host x 24 hours x 30 days = 720 host hoursThis example assumes the default of scraping one data point per minute.
Special considerations
Windows nodes
If you run Windows nodes in a Kubernetes cluster, you’re billed for host hours when kube-state-metrics is present in the same cluster.
Telemetry that isn’t kube-state-metrics
If you use OpenTelemetry-style telemetry or another collection method such as VictoriaMetrics with Kubernetes Monitoring, the result is a partial or empty dataset. Without data from the kube-state-metrics exporter, active nodes and containers can’t be detected, and you aren’t billed for host hours.
Which billing plan applies to you
Kubernetes Monitoring has moved through three billing models. Which one applies depends on your customer type and when you started.
Customers whose plans started after February 13, 2026, whether on a paid month-to-month subscription or a contract, are billed on active host and container hours, with no credits applied for telemetry use.
Customers whose plans started between September 17, 2024 and February 13, 2026 are billed on active host and container hours, and the plan includes credits for telemetry. Refer to Telemetry credits.
Customers whose plans started before September 17, 2024 are billed differently depending on customer type. Customers on a paid month-to-month subscription are billed for active billable series based on the underlying metrics generated, and stay on that model unless they migrate. Contact Support to move to the hourly model. Contract customers work with their account team to transition.
Telemetry credits
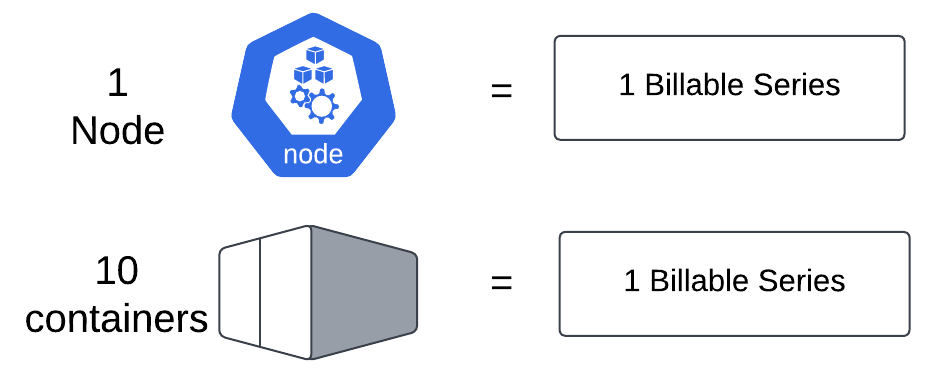
On the plan that includes credits, a credit of 1 billable series per active host hour and 0.10 billable series per active container hour is applied to your monthly invoice.
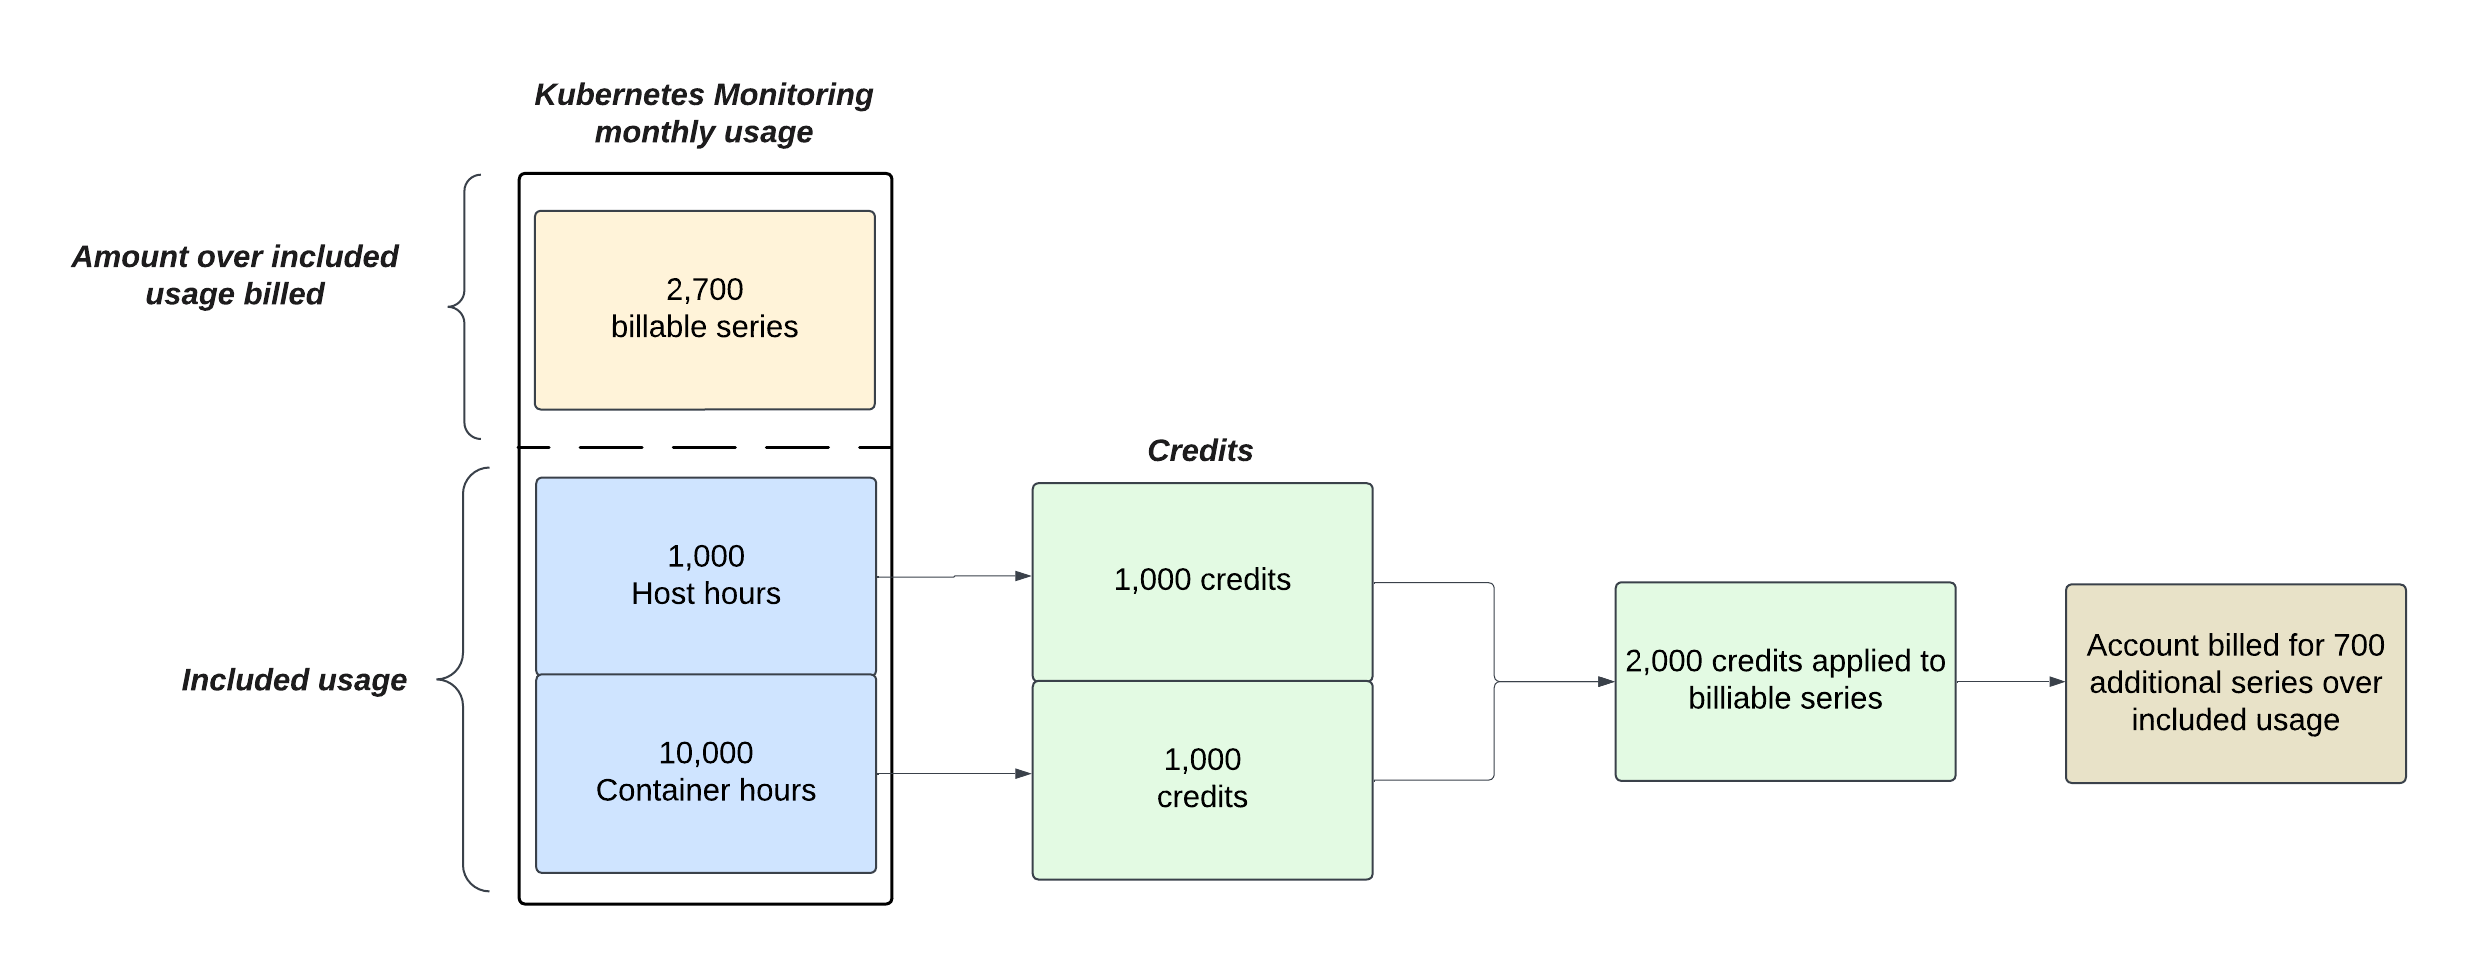
In the following example, the account had 2,700 billable series over the included usage, and 2,000 credits were applied to that overage. Credits apply to any metrics ingestion.
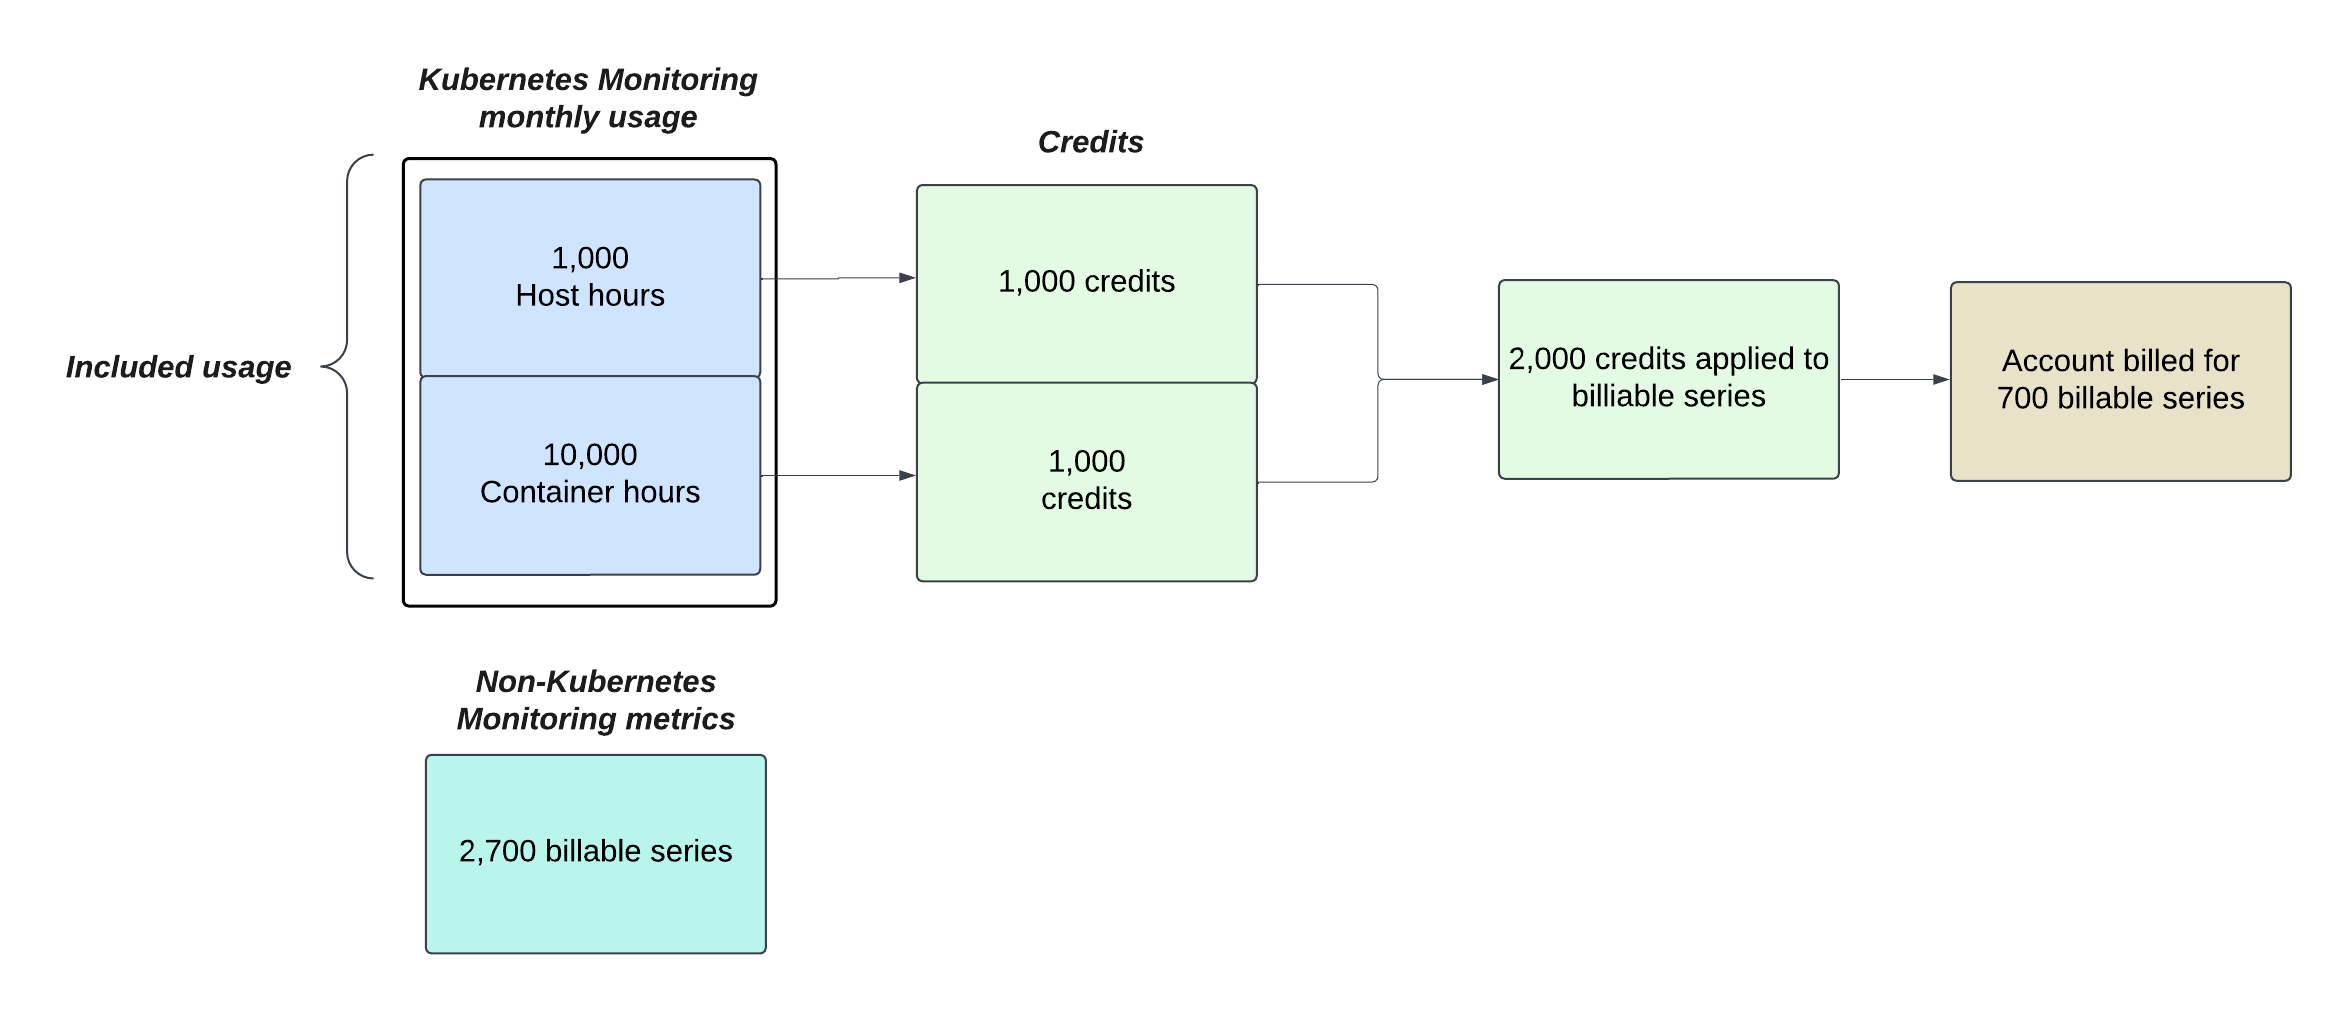
In the next example, the account had 2,700 billable series unrelated to Kubernetes Monitoring.
Included usage
In the Cost Management and Billing app you might see included host hours or included container hours. This is the usage included with Grafana Cloud Pro and Advanced plans. If you exceed it, standard metric ingestion pricing applies to metrics gathered beyond the included amount.
View your usage
- In your Grafana Cloud stack, go to Cost Management and Billing > Usage.
- Under Product Breakdown, select Kubernetes Containers for container usage, or Kubernetes Hosts for host usage.
Related
Was this page helpful?
Related resources from Grafana Labs



