
 Grafana Cloud
Observe and act
Test and validate
Synthetic Monitoring
Knowledge graph integration
Grafana Cloud
Observe and act
Test and validate
Synthetic Monitoring
Knowledge graph integrationConnect Synthetic Monitoring checks to the Knowledge graph
Note
Synthetic Monitoring Knowledge graph integration is currently in public preview. Grafana Labs offers limited support, and breaking changes might occur prior to the feature being made generally available.
A Synthetic Monitoring check tests a target from the outside and assesses its availability, performance, and correctness. Depending on the check type, that ranges from a single DNS lookup or HTTP request to a k6 browser check driving a whole user journey. What a check doesn’t describe is the system behind the target. The Knowledge graph does: it maps your services, their dependencies, and their health. Connecting the two puts a check’s outside view next to the inside view of the service it tests.
When the Knowledge graph is activated on your stack, every check appears in it automatically as a SyntheticCheck entity. You can then link a check to the service it monitors by setting two labels on the check, which connects the check to that service in the Entity graph.
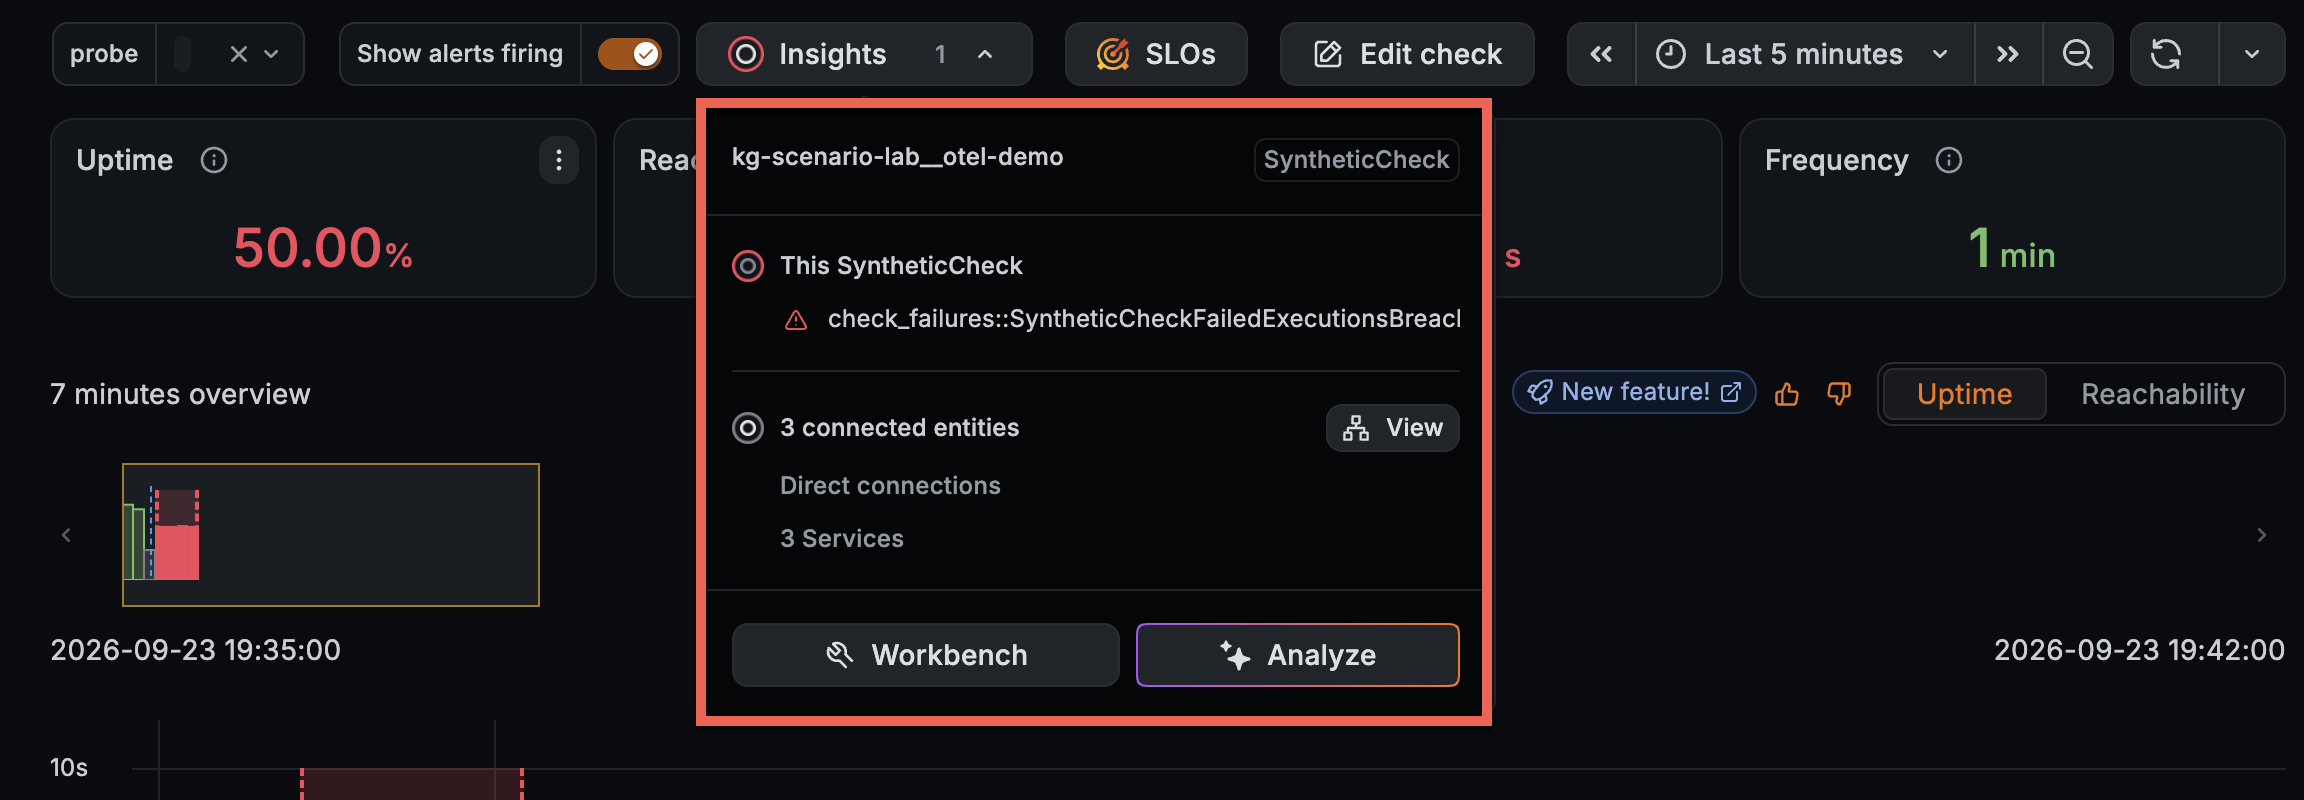
After a check is linked, you can see the service it monitors, follow that service’s dependencies, and see the check’s health on the service and the service’s health on the check. In Synthetic Monitoring, both appear on the check’s dashboard. Viewing check results alongside service health and dependencies helps you narrow down where to investigate failures.
How the integration works
- Checks become entities. Every check appears in the Knowledge graph as a
SyntheticCheckentity, automatically and with no configuration. The entity is named after the check’s job name and target, joined by a double underscore, for exampletraceroute__grafana.com. - Linking connects a check to a service. When you set the
service_nameandnamespacelabels on a check, and their values match a service the Knowledge graph has already discovered, the Knowledge graph creates aMONITORED_BYrelationship from that service to the check. The service and the check are then one hop apart in the Entity graph. - Check health comes from your Synthetic Monitoring alerts. The insights rings on a
SyntheticCheckentity use the firing state of that check’s own per-check alerts. Insights on a check also propagate to the service it monitors.
An unlinked check still appears in the Knowledge graph and still carries its own health. Linking is what places it next to the service it monitors.
Before you begin
- Ensure the Knowledge graph is activated on your stack.
- The service you want to link to must already be discovered by the Knowledge graph, or be discovered later. Refer to Manage dataset configurations.
- To link a check to a service, you need permission to edit checks in Synthetic Monitoring. Refer to Manage users and teams for Synthetic Monitoring.
Link a check to a service
The service_name and namespace label values are the identity of the service. They must match the name and namespace of a service in the Knowledge graph. They follow the OpenTelemetry conventions for service.name and service.namespace, and namespace also matches the Kubernetes namespace, so the same values work for both OpenTelemetry-instrumented and Kubernetes-discovered services.
Note
Setting the
service_namelabel also associates the check with that service in Service Center, so the same label links your check across both surfaces.
To link a check to a service:
Navigate to Testing & synthetics > Synthetics > Checks.
Create a check, or select an existing check to edit it.
Go to the Labels step.
In the Link to Knowledge Graph service section, set a value for each label:
- For
service_name, select or enter the name of the service the check monitors. - For
namespace, select or enter the namespace of that service.
Both fields suggest values from the services the Knowledge graph has already discovered. You can also enter a value that doesn’t exist yet, for a service that hasn’t been discovered.
- For
Complete the remaining steps, then click Save.
Allow a few minutes for the link to appear in the Knowledge graph.
You can also set these labels through the Synthetic Monitoring API or the Terraform provider, which is the fastest way to link many checks at once.
View Knowledge graph data on a check dashboard
Open a check from Testing & synthetics > Synthetics > Checks. Two Knowledge graph surfaces appear on the check’s dashboard.
Insights
In the check dashboard header, click Insights, next to Edit check, to view the check’s Knowledge graph insights and connected entities.
Connected services
The Connected services section shows the check’s neighborhood in the Entity graph. It includes:
- The check itself, highlighted and anchoring the top of the graph.
- The service linked to it through
MONITORED_BY. - That service’s immediate callers and dependencies, one
CALLShop in each direction.
Each node carries its own insights rings, so a service with active insights appears ringed next to your check. Hover over a node to preview its details, or click it to pin a card showing the entity’s type, environment and namespace, key performance indicators, and active insights.
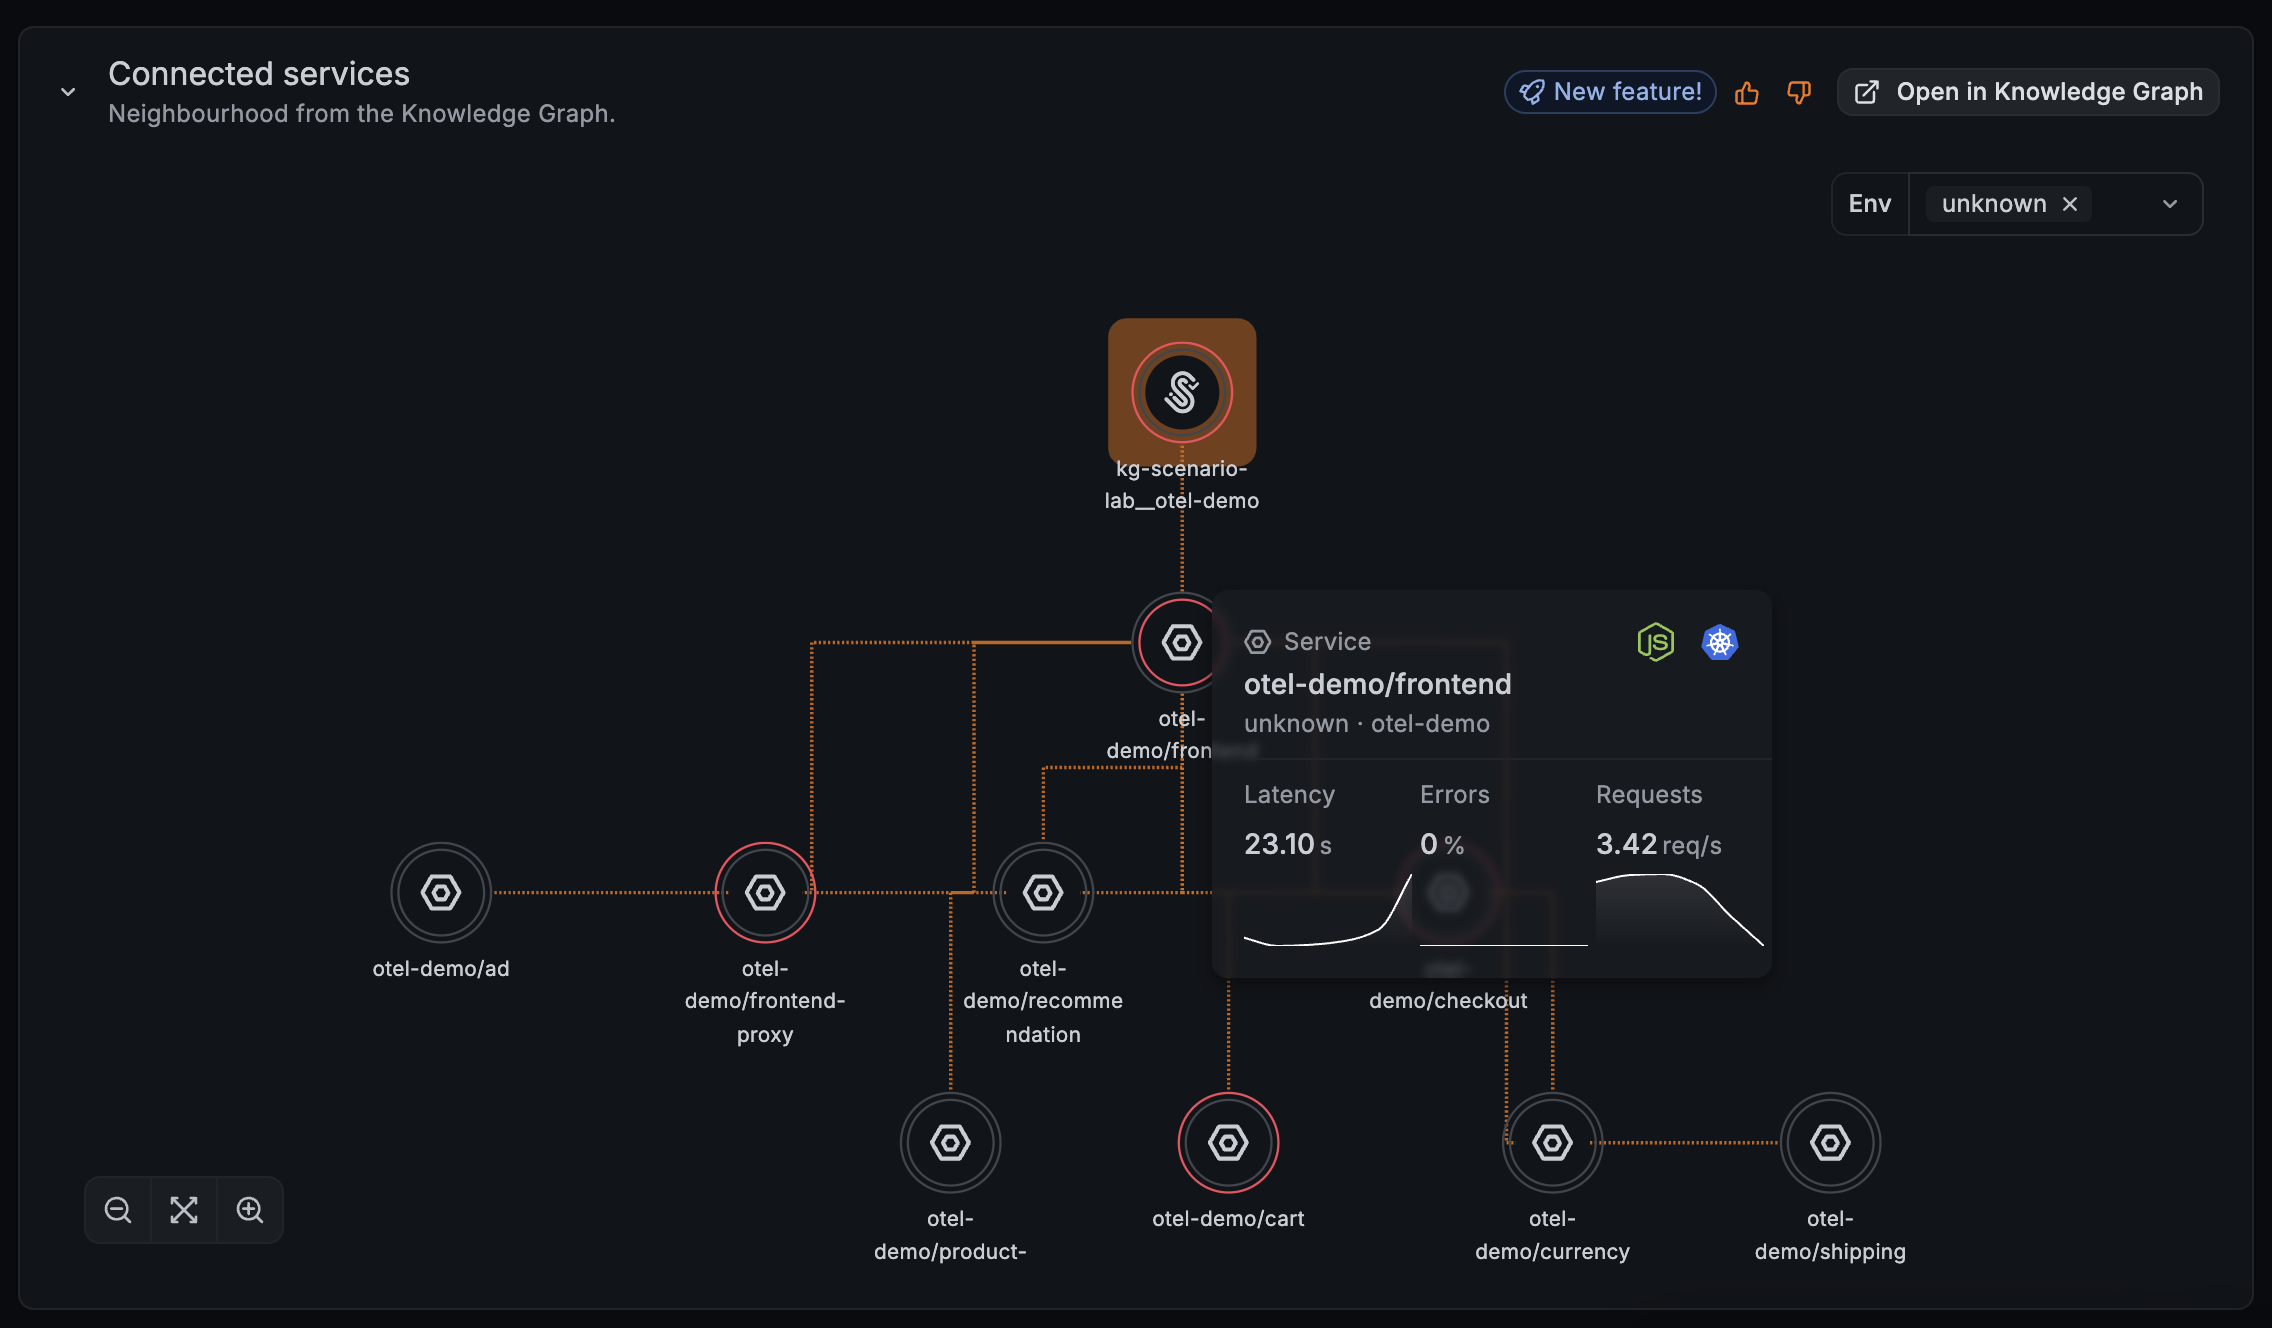
If the linked service exists in more than one environment, the graph shows a branch per environment and an Env filter appears above it. Select one or more environments to narrow the graph to the branches you’re interested in; the check always stays visible.
Click Open in Knowledge Graph to open the full Entity graph. If the check isn’t linked to a service yet, click Add service link to go straight to the Labels step of the check editor.
View a check in the Knowledge graph
In the Knowledge graph, find your check in the Entity catalog or Entity graph by filtering on the SyntheticCheck entity type, or open it from any service it monitors. From the entity page you can add the check to the root cause analysis (RCA) workbench and start an investigation with the service and its dependencies.
Because the relationship is Service MONITORED_BY SyntheticCheck, insights on a check also count towards the health of the service it monitors. The check’s health is visible from the service, without having to look for the check.
Understand check health in the Knowledge graph
A check’s insights reflect its own Synthetic Monitoring per-check alerts. Nothing is recalculated in the Knowledge graph, so a check’s rings follow your own thresholds and evaluation windows, including any change you make to them.
When several of these fire on the same check, they appear as separate insights that roll up into one ring.
A few consequences are worth knowing:
- A check with no per-check alerts configured never lights a ring, and looks the same as a healthy check. Configure per-check alerts on the checks whose health you want to see in the Knowledge graph.
- Only per-check alerts drive the rings. Legacy sensitivity alerts don’t.
Read check health and service health together
Compare check results with service health to decide where to investigate. A service’s insights can come from its own telemetry or from a linked synthetic check.
- Both unhealthy: a user-facing outage. Both signals agree, and the linked service helps you identify where to investigate.
- The check fails, but the service looks healthy: investigate the path to the service. Either the path to it—DNS, TLS, a load balancer, routing—or the check itself, such as a wrong target or an over-strict assertion.
- The check passes, but the service has insights: a possible coverage gap. Users may be affected on a path the check doesn’t exercise, while the probed path stays clean. Consider broadening your checks to cover the failing path.
- The service looks healthy, but a dependency is ringed. Follow the service’s
CALLSedges in the graph. The check’s failure can originate one hop further down.
Insights follow your per-check alert thresholds and evaluation windows, not individual probe results: a brief failure that doesn’t fire the alert shows in the check’s uptime without lighting a ring, and after recovery the service’s insights can take a few minutes longer than the check’s probes to settle.
Considerations
- A check links to every service with the same name and namespace. If the same service runs in more than one environment or cluster under the same name and namespace, a check links to all of them. Scoping a link to a single environment isn’t supported; use the Env filter on the Connected services graph to narrow the view.
- Checks don’t belong to an environment. The Knowledge graph groups entities by environment, but a check has no environment of its own, so checks aren’t grouped that way.
Was this page helpful?
Related resources from Grafana Labs



