Grafana Cloud
Observe and act
Test and validate
Synthetic Monitoring
Configure alerts
Configure per-check alerts
Configure per-check alerts
Per-check alerts allow you to create check-specific thresholds for common Synthetic Monitoring alert scenarios, including:
- Number of test failures within a time window.
- TLS certificate expiration threshold (HTTP and TCP checks only).
- Average latency (HTTP, DNS, and Ping checks).
Per-check alerts differ from legacy alert rules in the following ways:
- You can specify thresholds on a check-by-check basis.
- They use Grafana-managed alert rules, which Grafana evaluates. Legacy alert rules use data source-managed alert rules, which the selected data source stores and evaluates.
There are two steps to configure per-check alerts:
- Enable per-check alerts on a check.
- Review or configure notification destinations.
Enable per-check alerts on a check
To configure per-check alerts on a check:
- Navigate to Testing & synthetics > Synthetics > Checks.
- Click Create new check or edit an existing check.
- Open the Alerting step of the check form. If the Per-check alerts tab is shown, select it.
- Select the checkbox beside each alert you want to enable and configure its thresholds. Refer to Per-check alerts for the available conditions.
- Review the notification destinations and configure notifications if needed.
- Click Save.
For new checks, Failed Checks is selected by default. Other alert types are off until you select them. Clear all alert checkboxes to save the check without per-check alerts. This does not change custom rules created in Grafana Alerting.
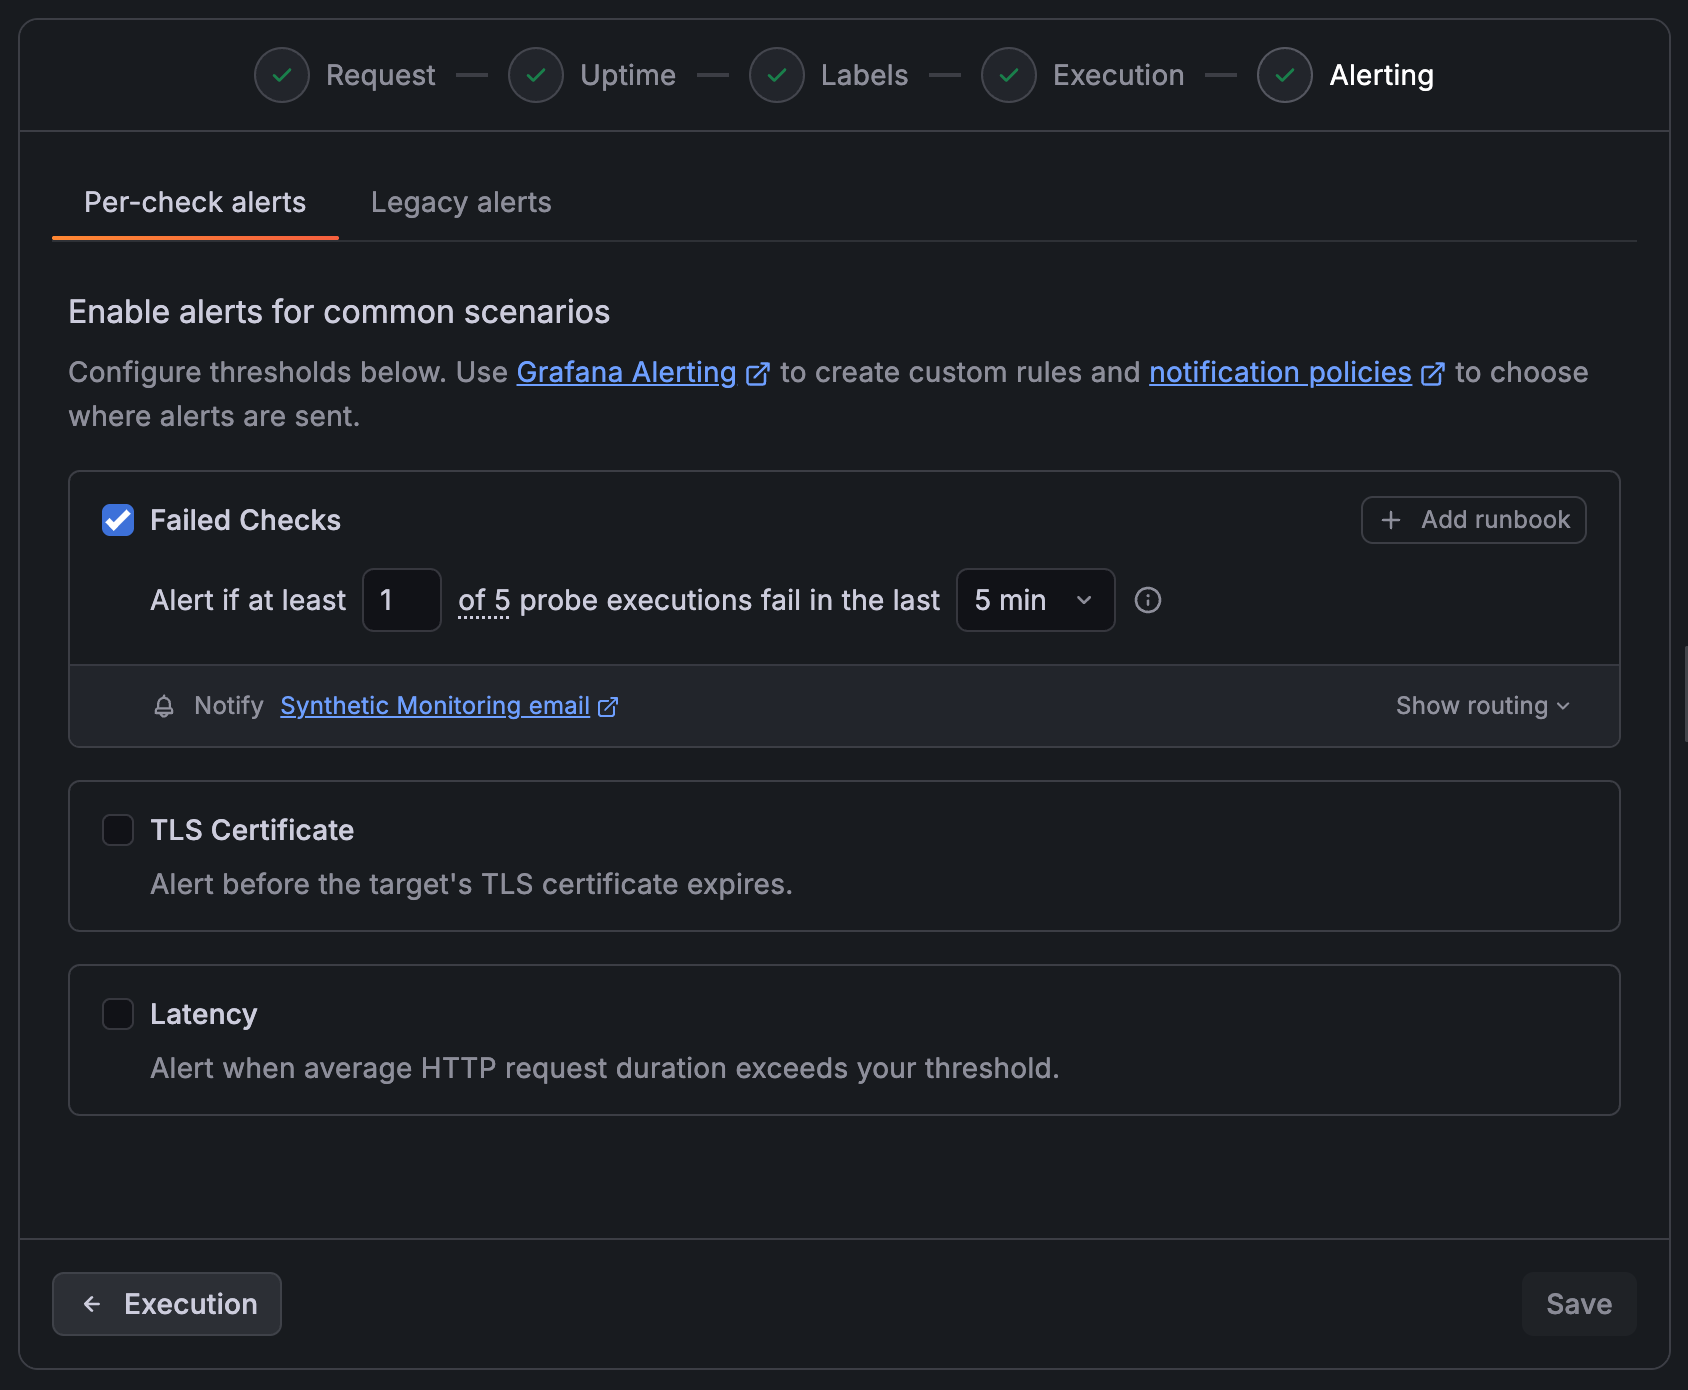
Add a runbook
A runbook provides instructions for investigating and resolving an alert. For an enabled alert, click Add runbook and enter the instructions’ URL in Runbook URL (optional). To remove it, click the trash icon next to the field. Save the check to apply the change.
Review notification routing
The Notify row lists the contact points selected by the matching notification policies. Click a contact point to review its configuration in Grafana Alerting.
- Click Show routing to inspect the matching notification policies and their destinations.
- Click See labels to inspect the labels used for routing.
The preview updates as you change the check. Different alert types or probe label values can match different policies, so a check can have more than one notification destination.
The preview shows which contact points match your alerts. It does not test notification delivery. If the preview cannot verify routing, notifications may still work. Follow the link to review your setup in Grafana Alerting.
Configure alert notifications
A contact point defines recipients and integrations, such as email or a webhook. A notification policy matches alert labels and routes notifications to a contact point.
If notifications are already configured, the check form shows matching destinations and preserves the existing setup. Manage recipient changes and additional policies in Grafana Alerting.
Set up email notifications
When the default contact point is not configured and any existing child policies exclude Synthetic Monitoring alerts, the form can offer Email addresses for initial setup. This option requires permission to create contact points, update notification policies, and configure alerts. It is not available for provisioned policy trees or when the existing configuration cannot be verified.
- In Email addresses, enter recipients separated by commas, semicolons, or new lines.
- Save the check.
Saving creates:
- A new contact point named Synthetic Monitoring email with the recipients you entered.
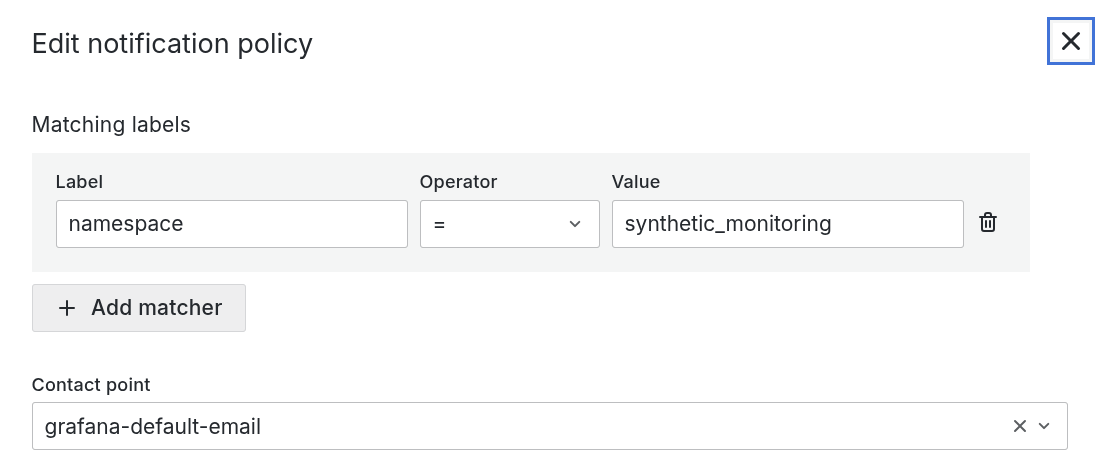
- A child notification policy matching
namespace = synthetic_monitoringthat routes to this contact point.
The default contact point stays unchanged. The new policy applies to current and future Synthetic Monitoring checks with alerts enabled that use the default policy tree. It is shared configuration, not a destination override for this check.
You can leave Email addresses blank and configure notifications later. Alerts can fire without notifying anyone until a usable destination is configured.
Reuse an existing contact point
If Synthetic Monitoring email already exists with usable configuration but its policy is missing, the form can show Notification policy missing instead of the email field. The same initial-setup conditions apply. Reuse requires permission to update policies and configure alerts, but does not require permission to create a contact point.
- Review the email recipients and other integrations shown for the contact point. Click its name to inspect its configuration.
- Click Add notification policy to select it for reuse.
- Save the check to add the shared policy. The contact point’s recipients and integrations stay unchanged.
To clear your selection before saving, click Cancel in the notice. To choose another contact point or configure routing yourself, click Set up manually.
Configure routing in Grafana Alerting
Use Grafana Alerting to change existing routing, add other integrations, or configure notifications when initial setup is not offered:
- Create or update a contact point with the intended recipients.
- Configure a notification policy that matches the check’s alert labels and selects that contact point.
For a shared Synthetic Monitoring destination, match namespace = synthetic_monitoring. Per-check alert instances also carry the custom labels you define on your checks. For example, use team = checkout to route alerts for checks with that label to the checkout team’s contact point. If your stack still uses prefixed custom labels, match label_team instead. Use See labels to confirm the label names for your check.
Policies form a tree, and their order and child policies affect which destinations receive notifications. Refer to Notification policies for routing behavior.
Grouping
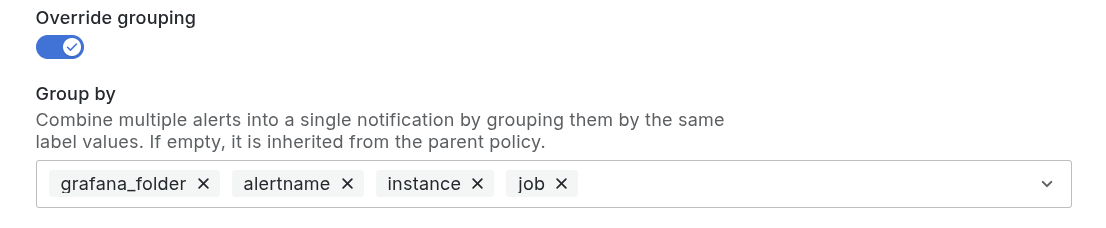
By default, notifications are grouped by Grafana folder and alert name. For details, refer to Group alert notifications.
For example, all alert instances for the failed checks alert are grouped under the same notification. Each alert is represented as a separate instance within that notification.
You can change the grouping configurations in the notification policy. For Synthetic Monitoring, add the instance and job labels to group notifications by check. These labels uniquely identify a check, so each check that triggers an alert generates a separate notification.
Alerts in check templates
The Detect broken links template includes Alert on check failure, selected by default. It triggers after at least one failed probe execution within one hour.
The template shows matching contact points and offers the same initial email setup or contact point reuse when available. Clear the checkbox to create the check without that alert. After creating the check, open its Alerting step to change thresholds, add a runbook, or inspect the full routing preview.
Resolve setup warnings
- A warning icon or Not configured beside a contact point identifies missing configuration. Review its recipients or integrations and the policy that selects it.
- If routing could not be verified, follow the link to review your setup and access in Grafana Alerting. Notifications may still work even when the preview cannot verify routing.
- If the check saves but alerting setup fails, use the retry action to complete setup for the saved check. You can also continue to the check and finish setup later. You do not need to create the check again.
The check page can show Alerting setup is incomplete when enabled per-check alerts need attention. Turning per-check alerts off does not produce a missing-destination warning for custom rules managed separately in Grafana Alerting.
Per-check alerts
Failed checks
The failed checks alert lets you define a threshold condition that determines when check execution failures should trigger an alert. The threshold can be defined based on:
- Number of failures: Number of check execution failures in the selected time range.
- Time range: Has to be greater or equal to the check frequency. Supported values are
5m,10m,15m,20m,30m,1h.
TLS certificate expiration
Note
TLS certificate expiration alerts are only available for HTTP and TCP checks.
The TLS certificate expiration alert lets you define a threshold condition that determines when to trigger an alert for an upcoming certificate expiration for the target under monitoring. The threshold can be defined based on:
- Number of days until expiration.
Latency alerts
Note
Latency alerts are only available for HTTP, DNS, and Ping checks.
Latency alerts fire when the average latency across all probes is higher than the specified threshold. The alert can be defined based on:
- Threshold Value: Average latency (ms).
- Time range: Time range on which the average latency is calculated. Has to be greater or equal to the check frequency. Supported values are
5m,10m,15m,20m,30m,1h.
Per-check alerts status
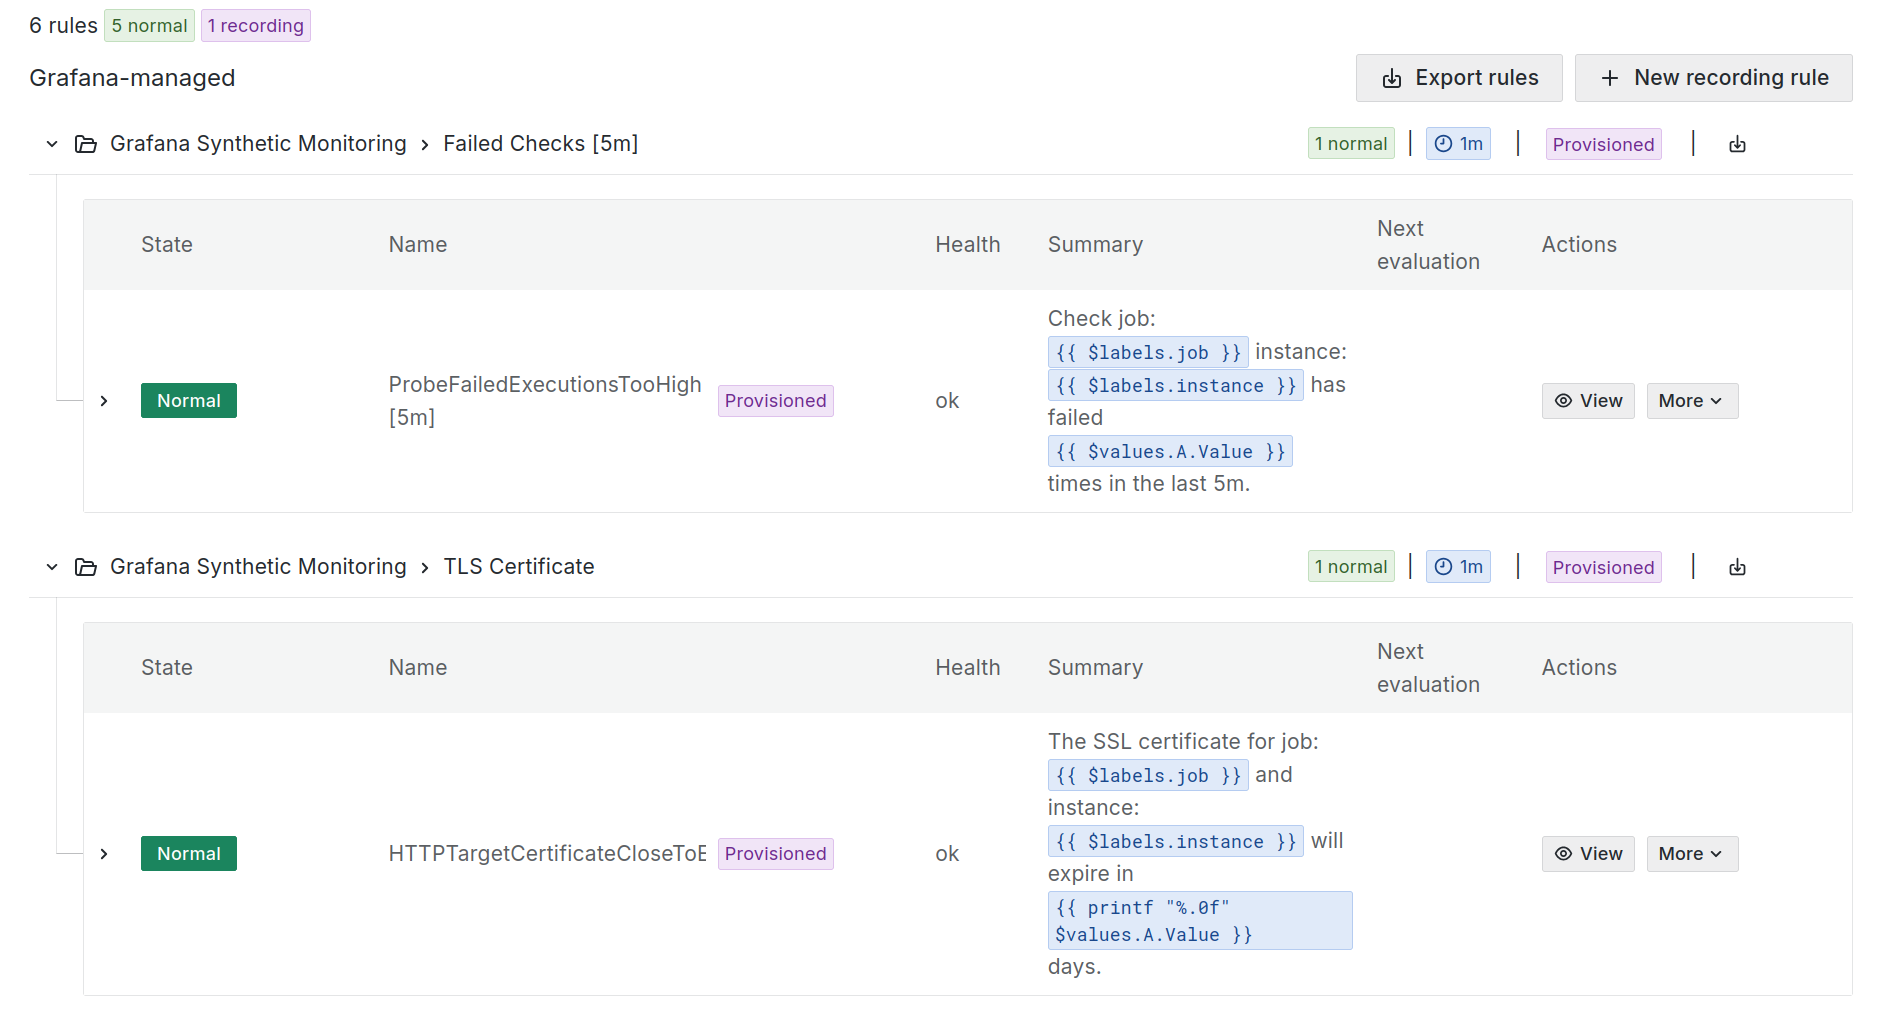
You can view per-check alerts associated with a check by hovering over the bell icon on the checks list. From there, you can access the specific alert rule definition in IRM, and see any errors associated with the alert.
How per-check alert rules work
Per-check alert rules are composed of two parts:
- A metric associated with the alert type: This is a metric reported as a result of the Synthetic Monitoring check executions. For example
probe_ssl_earliest_cert_expiry. - A metric associated with the threshold: This is a metric that identifies the threshold set by the user for each specific alert type and check combination, and that’s continuously pushed as long as the alert is enabled for the check.
Note
The threshold metric contributes to active series as long as the alert is enabled for the check. For billing details, refer to Synthetic Monitoring pricing.
These two parts are evaluated together in the alert rule, where the values of the metric for the alert type is evaluated against the specific threshold value.
Some alert types can be configured for different time ranges, for example the alert for failed checks. In these cases multiple alert rules might be created in Grafana if the alert is enabled for various checks using different time ranges.
Was this page helpful?
Related resources from Grafana Labs