
 Grafana Cloud
Observe and act
Test and validate
Performance testing
Manage projects and users
Stack limits
Grafana Cloud
Observe and act
Test and validate
Performance testing
Manage projects and users
Stack limitsView stack limits
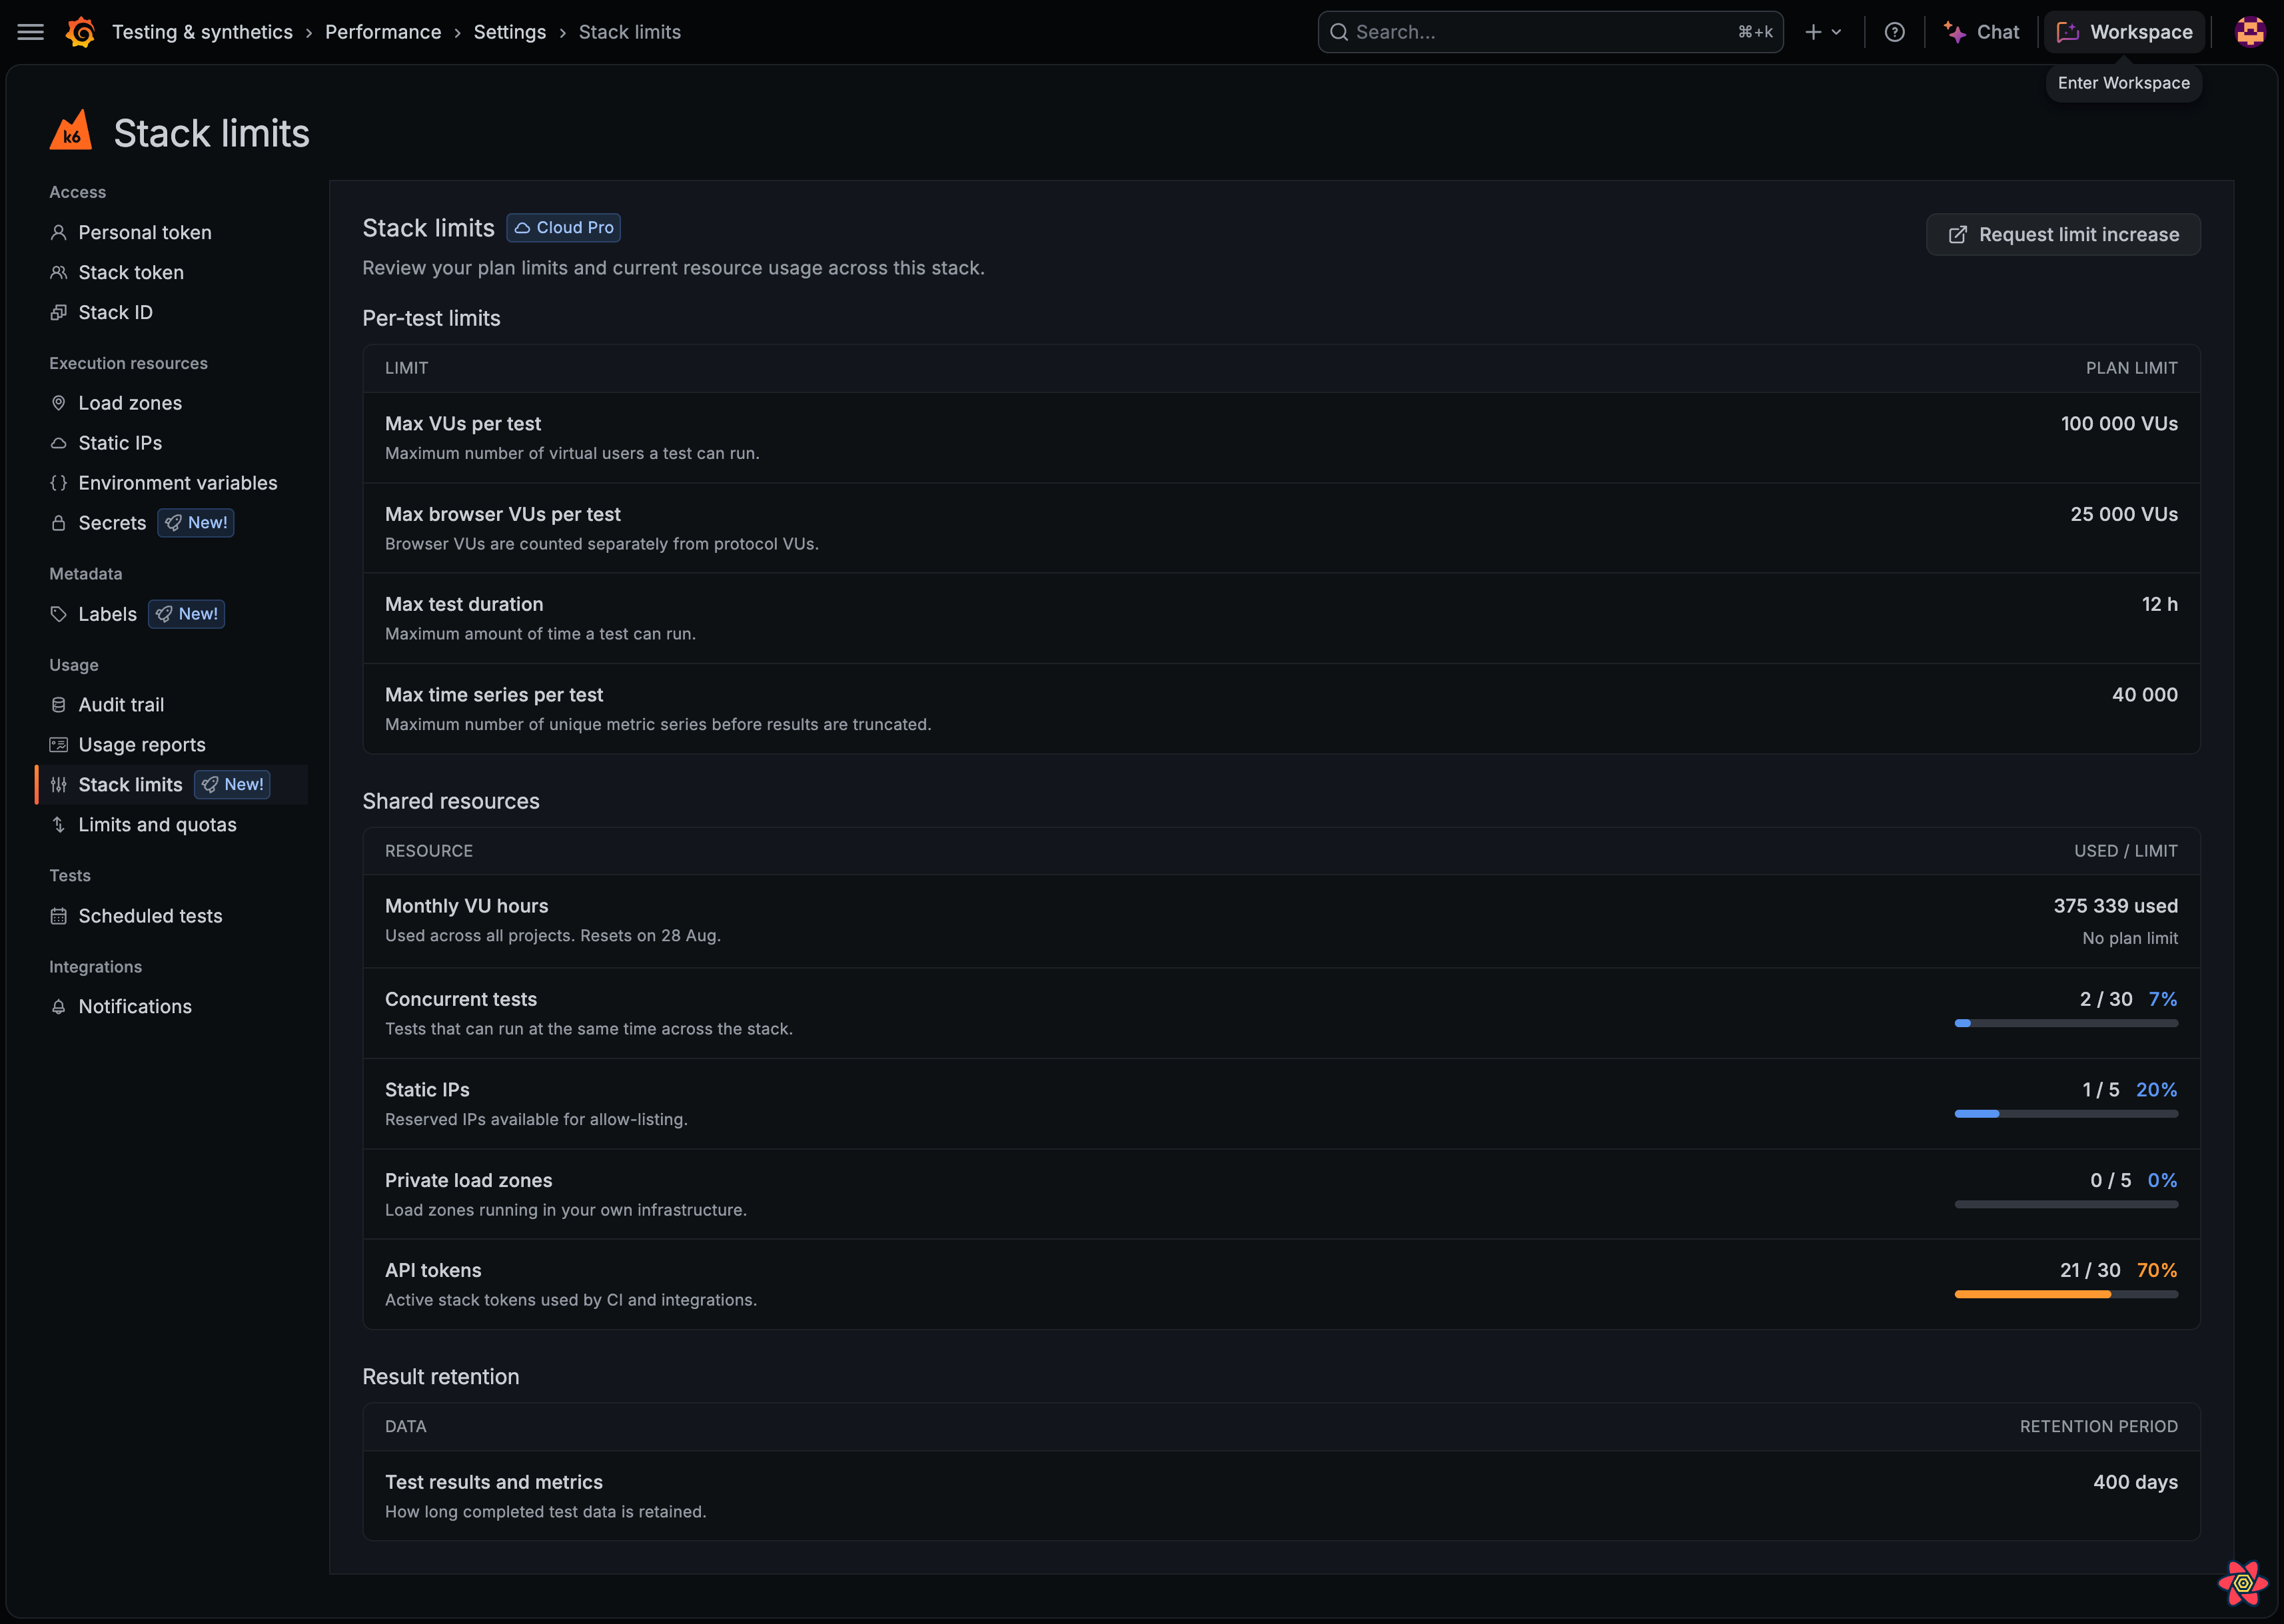
Use the Stack limits page to review the plan limits for your Grafana Cloud k6 stack. You can also see how much of your shared capacity you’re using.
Stack limits come from your Grafana Cloud subscription. They’re separate from project limits and quotas, which you set per project to control team usage.
Before you begin
- You need access to Grafana Cloud k6 on the stack.
Open stack limits
- Log in to your Grafana Cloud account.
- Go to Testing & synthetics > Performance > Settings.
- Under Usage, click Stack limits.
The page shows your plan badge (Free plan, Cloud Pro, or Advanced) and the limits that apply to the stack.
Review per-test limits
Per-test limits apply to each test run. The page shows the plan maximum for:
Review shared resources
Shared resources are stack-wide. When a resource has a plan cap, the page shows current usage, the limit, a percentage, and a progress bar.
Current usage for static IP addresses and API tokens is visible only to Grafana organization Admins. Other users can still see the plan limit for those rows.
When a shared resource reaches 100%, point to the value for guidance on freeing capacity or requesting a higher limit.
If a paid-only resource isn’t part of your plan, the page shows Not in plan.
Review result retention
Result retention shows how long k6 keeps completed test results and metrics for the stack.
Request a limit increase
Request limit increase is available on paid plans. Select it to open a Grafana support form. You need the Grafana organization Admin or Editor role to open the form.
Next steps
- To set caps for individual projects, refer to Manage project limits and quotas.
- To review past VUH consumption by project, refer to Usage reports.
Was this page helpful?
Related resources from Grafana Labs



