
 Grafana Cloud
Observe and act
Monitor applications
Database Observability
Monitor
Link traces and queries
Grafana Cloud
Observe and act
Monitor applications
Database Observability
Monitor
Link traces and queriesLink traces and database queries
Trace linkage connects your application traces to the database queries they run, so you can move between the two in either direction:
- From a trace to a query. In Explore or Traces Drilldown, a database span can show a Database Observability link. Selecting it takes you to that query in Database Observability, where you can see its samples, latency, and history.
- From a query back to a trace. When a query sample carries trace context, you can jump from the query back to the trace of the request that ran it.
Why this is useful
When an application request is slow, a trace usually shows that a database call was slow, but not why. Trace linkage lets you cross from that span into the query’s full picture in Database Observability: whether it’s habitually slow, what it runs against, and how often it executes. Going the other way, when you find a problem query, you can trace it back to the user-facing request that triggered it, instead of guessing which part of the application is responsible.
Before you begin
Trace linkage requires an application instrumented with an OpenTelemetry SDK that sends traces to Grafana Cloud.
The database spans must include:
- Query text in
db.query.textordb.statement - A supported database system in
db.system.nameordb.system:mysqlorpostgresql
What to expect
Trace linkage is best-effort correlation, not a guaranteed link on every span. Database Observability matches in two ways:
- Query text match is the default and needs no additional application changes. It matches the span’s query text against the queries Database Observability has collected.
- Exact trace match is more precise but requires SQLCommenter instrumentation. It can link to the single query execution behind a specific span using its trace ID and span ID.
The following video shows an exact trace match opening the corresponding query in Database Observability.
When Database Observability matches a span to a query, it opens the Query samples tab in the Query details view. If multiple database instances contain the query, you may first be asked to select an instance.
How to enable exact trace matching
Exact trace match is an advanced optional enhancement to trace linkage matching. Exact trace match only improves the precision of the matches, not how often a link resolves.
- Enable SQLCommenter in your application’s OpenTelemetry SDK instrumentation. SQLCommenter appends a W3C
traceparentcomment to SQL queries. - Use Alloy 1.17.0 or later. If you can’t upgrade from an earlier version, set
disable_query_redaction = truein thequery_samplesblock as a fallback.
Linking a query sample back to a trace
Database Observability shows View trace in Explore links directly on query sample tooltips. Selecting it opens Explore Traces with the trace ID and span ID from the sample’s traceparent.
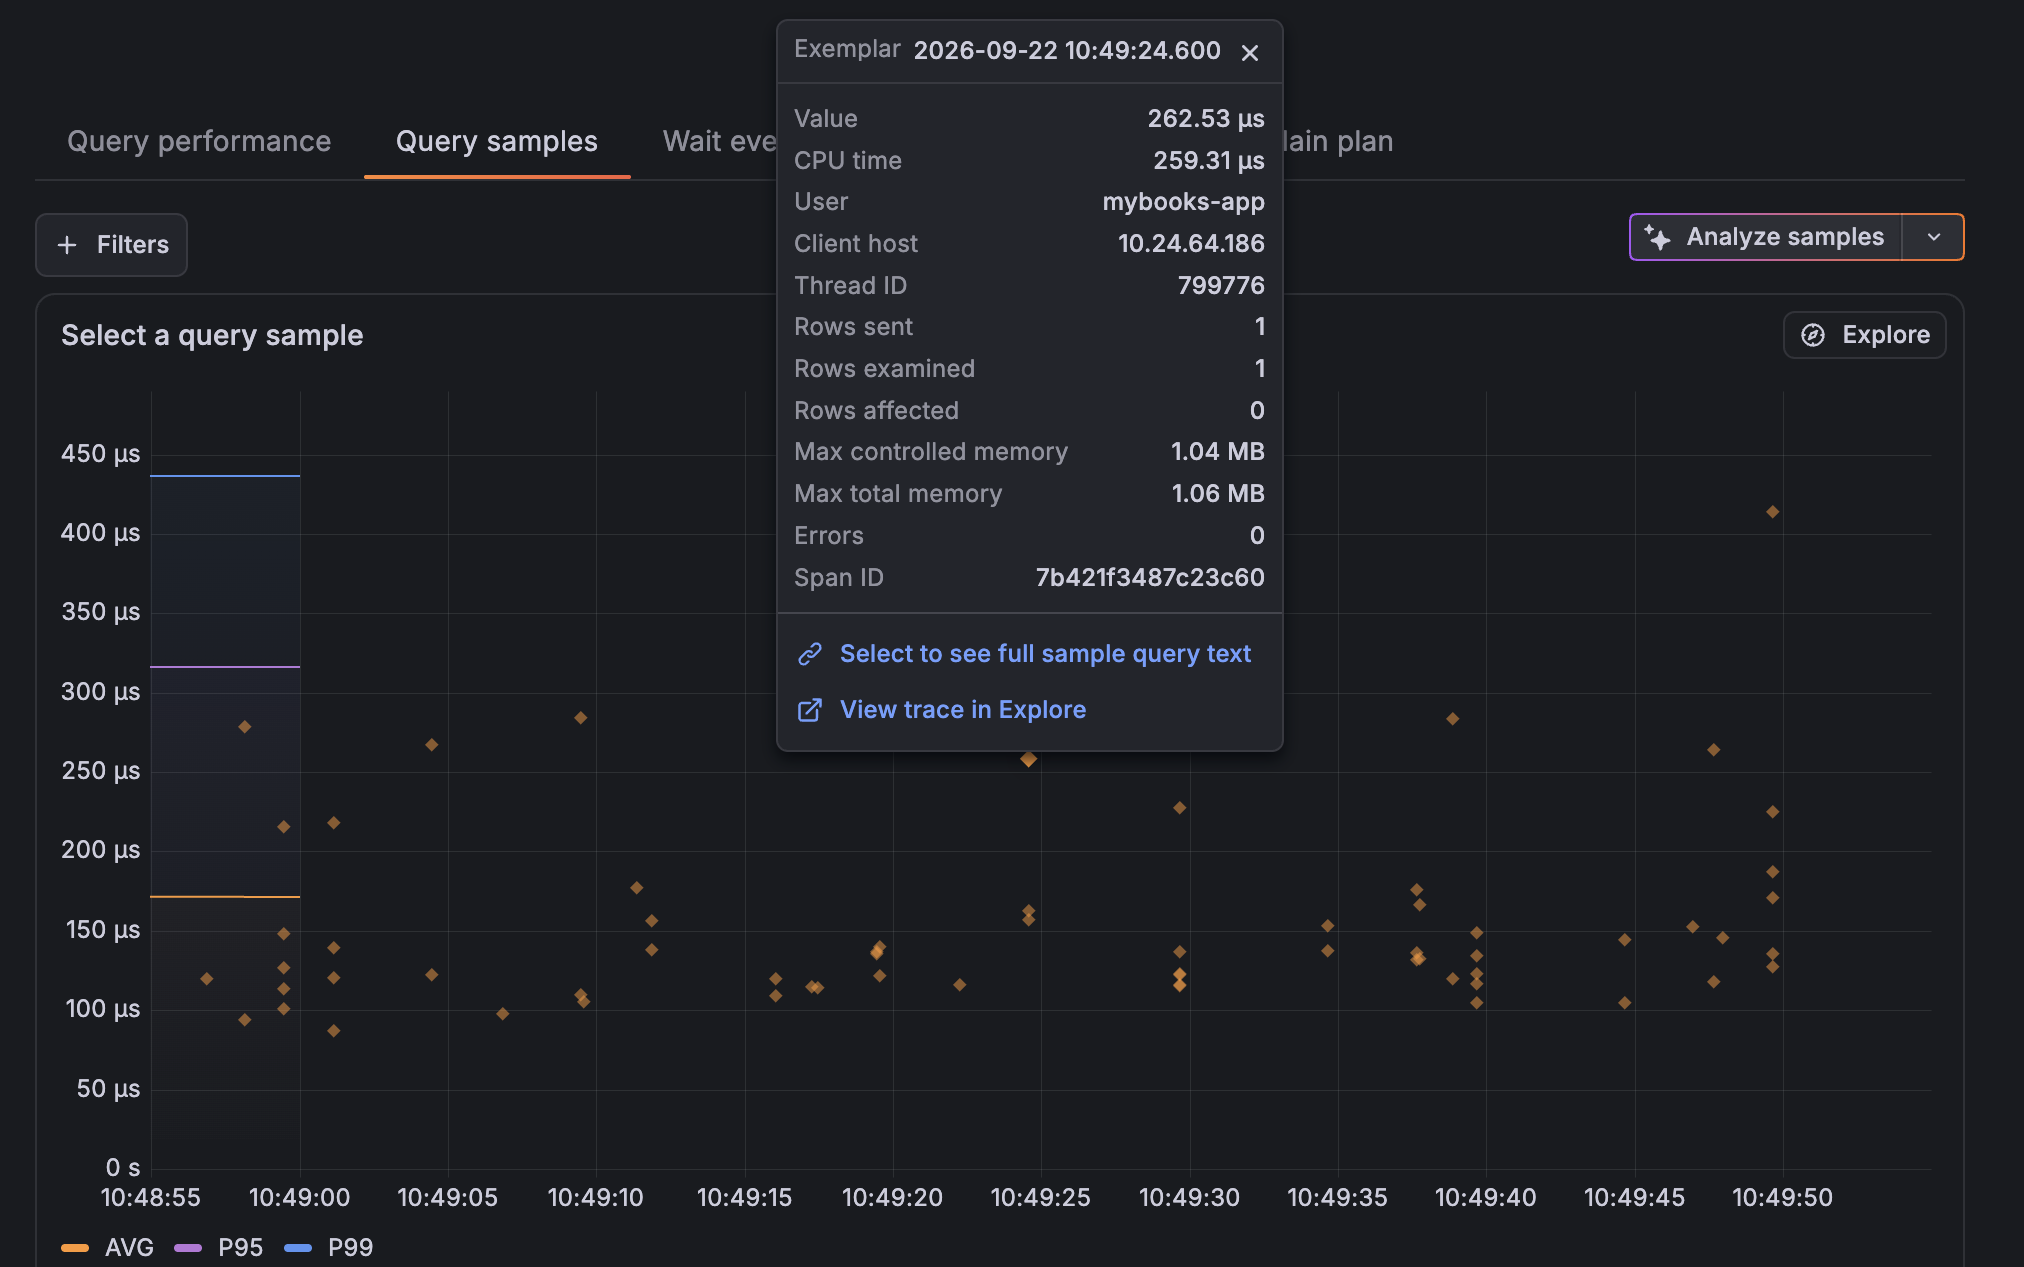
The link requires:
- a W3C
traceparentcomment appended to your SQL text with SQLCommenter - Alloy 1.17.0 or later
On older versions of Alloy, when a query sample includes a traceparent, you can copy the trace ID from the sample and search for it in Explore or Traces Drilldown.
Troubleshoot trace matching
If selecting a link doesn’t take you to a specific query, use the checks below for the type of matching you expect.
If query text matching doesn’t find a query
Query text matching relies on the queries Database Observability has already collected. If a link sends you to Queries overview instead of a specific query, check the following:
- Confirm the query text is collected. Database Observability refreshes the queries based on the sampling rate configured in Alloy, so a query it hasn’t collected yet can’t be matched. Wait for the next collection and try again. To check whether a query is available for matching, query the logs under
op="query_association"in your logs data source and confirm your query text appears. - The text must match after normalization. Matching uses normalized query text, so unusual literals or formatting can prevent a match.
If exact matching doesn’t find a sample
Exact matching only succeeds if Alloy sampled the specific execution behind the span and captured its traceparent. Alloy samples running queries periodically rather than capturing every execution, so most executions are never sampled and exact matching remains best-effort even when SQLCommenter is configured correctly.
- Confirm the
traceparentis logged. In your logs data source, query the logs underop="query_sample"and confirm the log lines include atraceparentfield. If it’s missing, SQLCommenter isn’t appending thetraceparentor Alloy is below 1.17.0. A matching log line looks like this:
level="info" datname="shop" pid="1089" leader_pid="" user="shop-api" app="" client="203.0.113.10:54321" backend_type="client backend" state="idle" xid="0" xmin="0" xact_time="" query_time="4.294ms" queryid="5810693783667443671" traceparent="00-5bd66ef5095369c7b0d1f8f4bd33716a-c532cb4098ac3dd2-01"- Lower
collect_intervalwith care. Thequery_samplesblock has acollect_intervaloption that controls how often Alloy samples queries from the database. A shorter interval samples more executions and raises the chance that the one you selected was captured, but it cannot ensure every execution is captured from the database. Shorter intervals also increase telemetry volume and add load to your database, so lowercollect_intervalgradually and watch the impact. For broader coverage, rely on query text matching.
Use Adaptive Traces to keep query spans
If you use Adaptive Traces, you can choose to retain traces that contain database query spans. Retaining those traces keeps the trace available, so you can reliably match from a query sample back to its trace.
Configure an Adaptive Traces policy of type and. The policy retains traces only when a span has both a supported database system and query text:
{
  "and_sub_policy": [
    {
      "name": "db-system-check",
      "type": "ottl_condition",
      "ottl_condition": {
        "span": [
          "attributes[\"db.system.name\"] == \"mysql\" or attributes[\"db.system.name\"] == \"postgresql\" or attributes[\"db.system\"] == \"mysql\" or attributes[\"db.system\"] == \"postgresql\""
        ],
        "error_mode": "ignore"
      }
    },
    {
      "name": "has-query-text",
      "type": "ottl_condition",
      "ottl_condition": {
        "span": [
          "attributes[\"db.query.text\"] != nil or attributes[\"db.statement\"] != nil"
        ],
        "error_mode": "ignore"
      }
    }
  ]
}
Was this page helpful?
Related resources from Grafana Labs



