

Configure the Loki data source
This document explains how to configure the Loki data source and describes the available configuration options. For general information on adding and managing data sources, refer to Data source management.
Grafana includes built-in support for Loki, so you don’t need to install a plugin.
Before you begin
Before you configure the data source, ensure you have:
- Grafana permissions: The
Organization administratorrole to add and configure data sources. Administrators can also configure the data source with YAML provisioning. - Loki server URL: The address of your Loki server, including the port. Loki listens on port
3100by default. - Authentication details: Any credentials or certificates your Loki server requires, such as a basic auth user and password or TLS certificates.
Note
Use TLS (Transport Layer Security) for an additional layer of security when working with Loki. For information on setting up TLS encryption with Loki, refer to Grafana Loki configuration parameters.
Add the Loki data source
To add the Loki data source:
- Click Connections in the left-side menu.
- Click Add new connection.
- Type
Lokiin the search bar. - Select the Loki data source.
- Click Add new data source in the upper right.
Grafana takes you to the Settings tab, where you set up your Loki configuration.
Configure the data source in the UI
The following sections describe the configuration options available for the Loki data source.
The first options set the name of your connection:
Connection
Configure how Grafana connects to your Loki server.
Note
Enter only the base URL. Don’t append API paths such as
/loki/api/v1/push. That endpoint sends logs to Loki with an agent like Grafana Alloy; it isn’t used to query Loki from the data source.If your Grafana instance runs on Grafana Cloud, a
localhostor private network address refers to Grafana servers rather than your network, so it can’t reach a self-hosted Loki. Use Private data source connect (PDC) to query Loki on a private network.
Authentication
Configure how Grafana authenticates with your Loki server. Select an authentication method and provide any required credentials.
Note
For Grafana Cloud-hosted Loki, use Basic authentication with your Grafana Cloud user ID as the user name and a Cloud Access Policy token as the password. The token’s access policy must include the
logs:readscope. Create tokens in the Grafana Cloud Portal. A token’s value is shown only once, so copy it when you create it.
Custom HTTP headers
Add custom HTTP headers to pass values that your Loki instance requires.
For a multi-tenant Loki, one configured with auth_enabled: true, add the X-Scope-OrgID header with your tenant ID so Loki knows which tenant to query. Without it, queries against a multi-tenant Loki fail with an authentication error or return no data.
Additional settings
The Additional settings section is collapsible and contains optional settings that give you more control over the data source. It’s open by default and includes advanced HTTP settings, alerting, query, and derived field options.
Advanced HTTP settings
Configure additional HTTP behavior for requests to Loki.
Secure Socks Proxy
The Secure Socks Proxy settings appear only when the secure SOCKS data source proxy is enabled in the Grafana configuration file. When enabled, you can route data source requests through a secure SOCKS proxy. For more information, refer to Configure a data source connection proxy.
Alerting
Configure how the data source works with Grafana Alerting.
To manage other alerting resources, such as the alerts these rules generate, add an Alertmanager data source. For more information on alerting with Loki, refer to Loki alerting.
Queries
Configure query behavior for the data source.
Derived fields
Use derived fields to extract new fields from your logs and create a link from the value of the field.
For example, you can link to your tracing backend directly from your logs, or link to a user profile page when a log line contains a corresponding userId. These links appear in the
log details.
You can add multiple derived fields.
Note
If you use Grafana Cloud, you can request modifications to this feature by opening a support ticket from the Grafana Cloud Portal.
Each derived field has the following options:
Caution
Using complex regular expressions in either type can affect browser performance when processing large volumes of logs. Use simpler patterns when possible.
Note
A derived field produces a single value per log line, so you can’t combine multiple labels or capture groups into one field or link.
For an internal link, the derived field only builds a link to the target data source using the extracted value. The trace must already be ingested into the target data source, such as Tempo, for the link to resolve. If a matching trace doesn’t exist, the link opens the target data source but returns no trace.
Troubleshoot interpolation
Use the debug section to see what your fields extract and how the URL interpolates. Click Show example log message to display a text area where you can enter a log message.
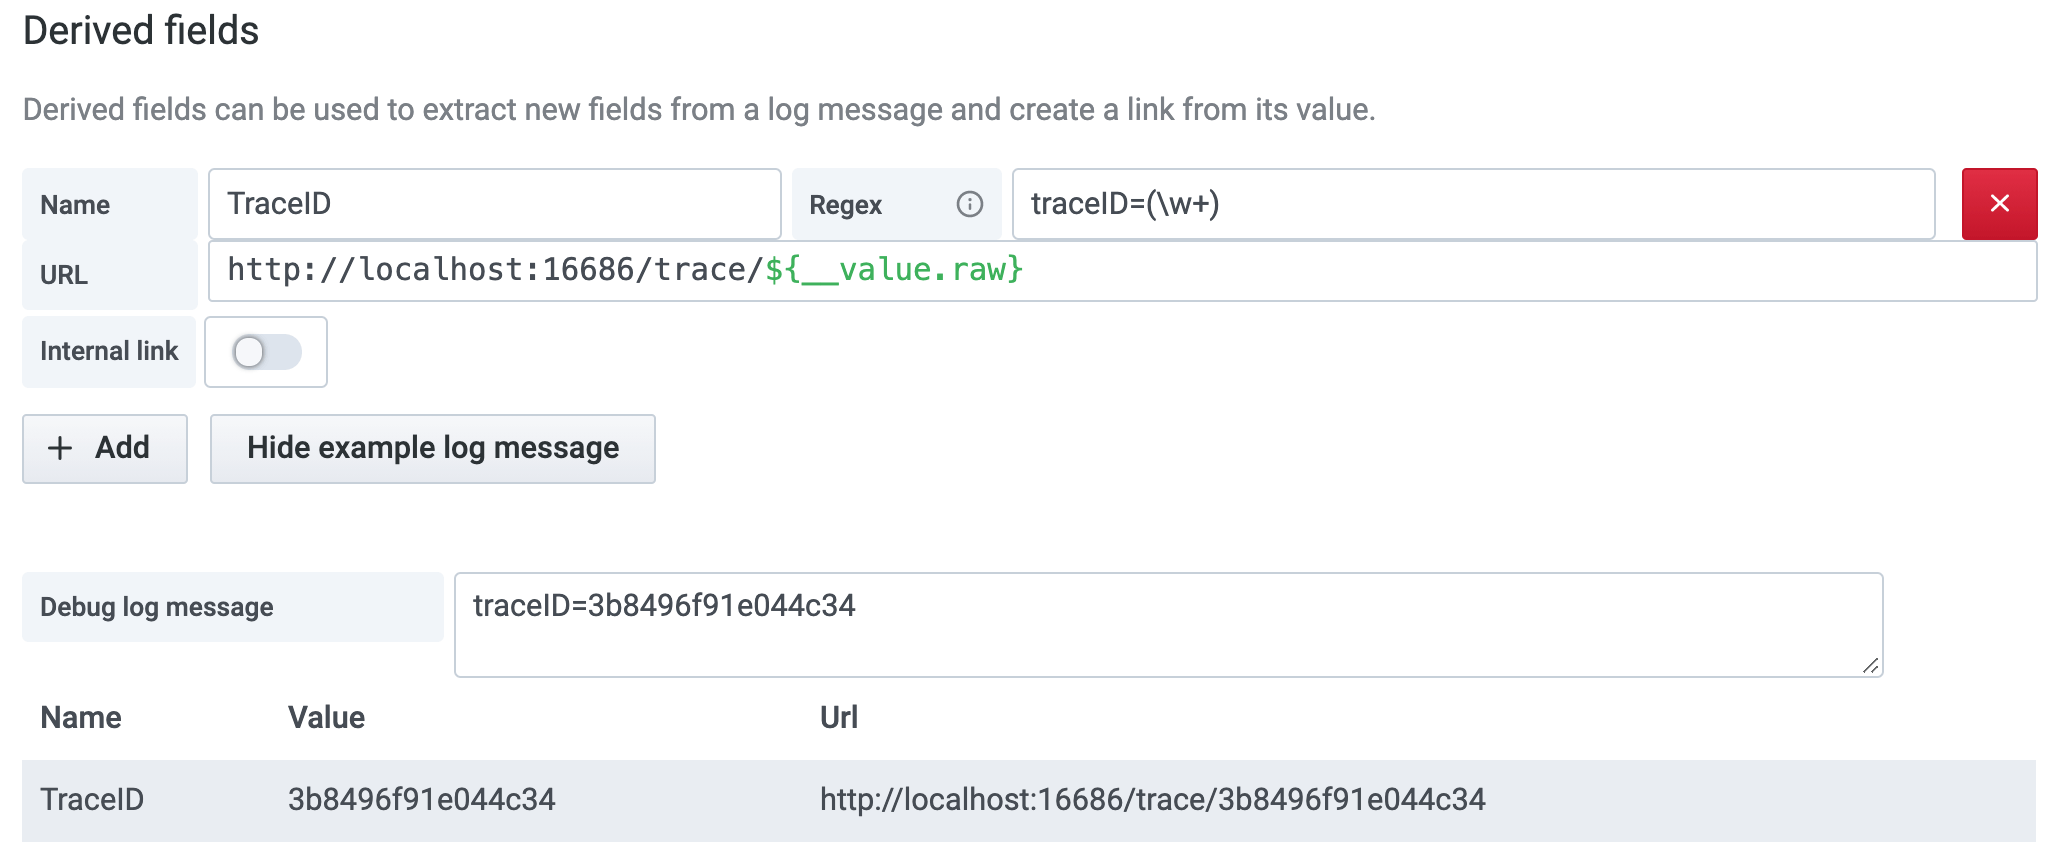
The new field with the link appears in the log details:
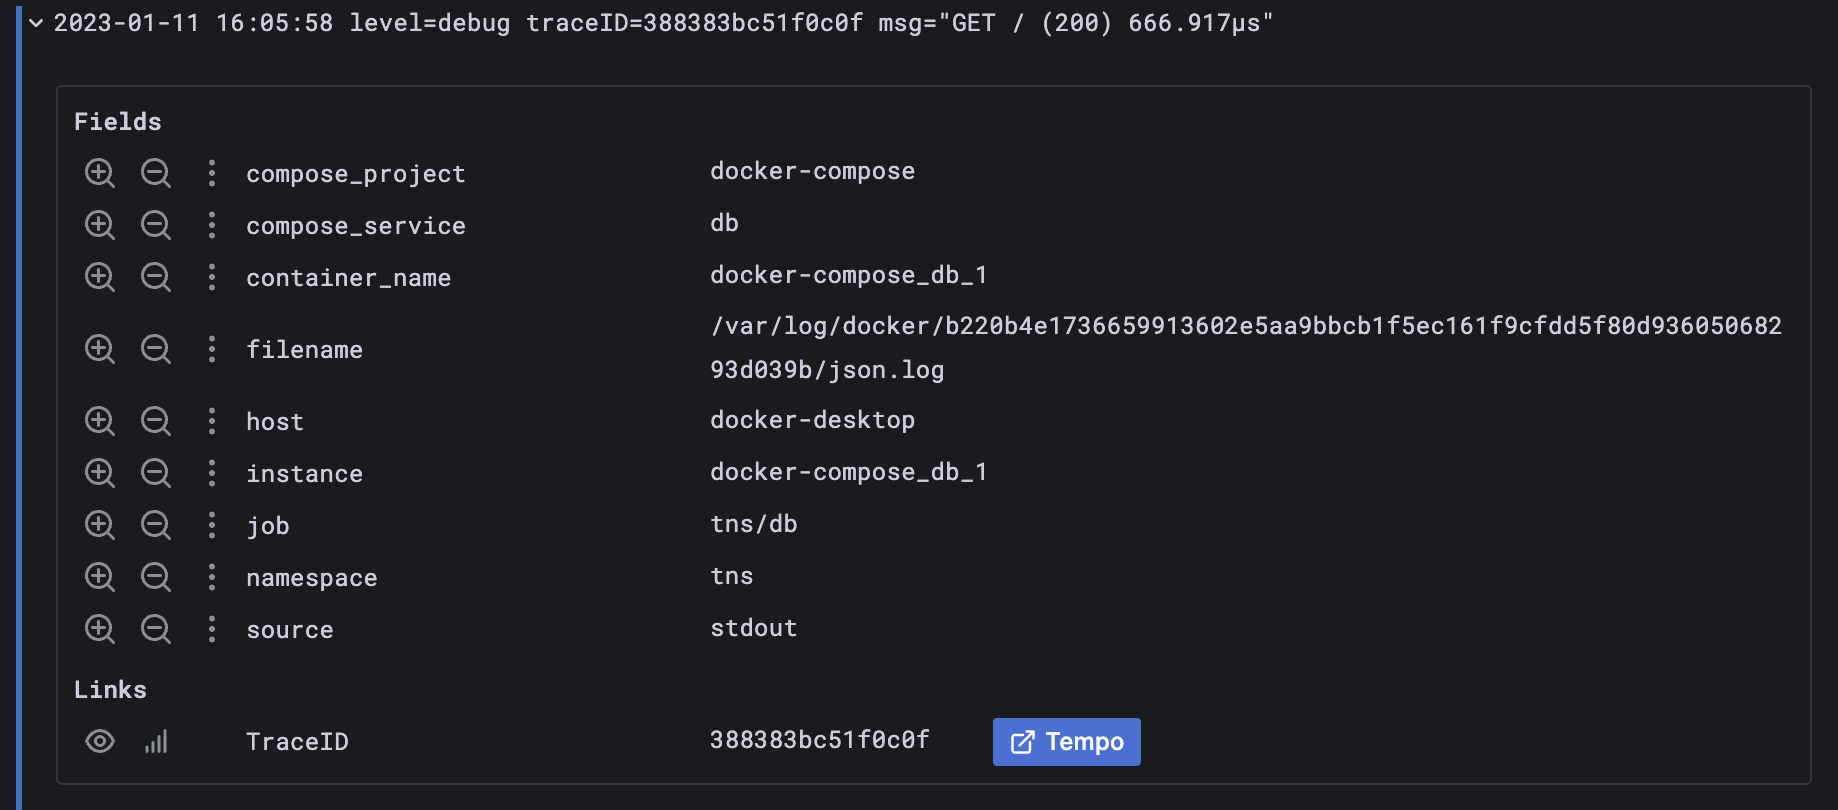
Verify the connection
Click Save & test at the bottom of the settings. Grafana attempts to connect to your Loki server and query its labels. When the test succeeds, Grafana displays a success message confirming the data source is working. If the test fails, review the error message and refer to Troubleshoot Loki issues.
Note
To troubleshoot configuration and other issues, check the log file located at
/var/log/grafana/grafana.logon Unix systems, or in<grafana_install_dir>/data/logon other platforms and manual installations.
Provision the data source
You can define and configure the data source in YAML files as part of the Grafana provisioning system. For more information about provisioning, and for available configuration options, refer to Provisioning Grafana.
Provisioning examples
The following example provisions a basic Loki data source:
apiVersion: 1

datasources:
  - name: Loki
    type: loki
    access: proxy
    url: http://localhost:3100
    jsonData:
      timeout: 60
      maxLines: 1000
Using basic authorization and a derived field:
You must escape the dollar ($) character in YAML values because it can be used to interpolate environment variables:
apiVersion: 1

datasources:
  - name: Loki
    type: loki
    access: proxy
    url: http://localhost:3100
    basicAuth: true
    basicAuthUser: my_user
    jsonData:
      maxLines: 1000
      derivedFields:
        # Field with internal link pointing to data source in Grafana.
        # datasourceUid value can be anything, but it should be unique across all defined data source uids.
        - datasourceUid: my_jaeger_uid
          matcherRegex: "traceID=(\\w+)"
          name: TraceID
          # url will be interpreted as query for the datasource
          url: '$${__value.raw}'
          # optional for URL Label to set a custom display label for the link.
          urlDisplayLabel: 'View Trace'

        # Field with external link.
        - matcherRegex: "traceID=(\\w+)"
          name: TraceID
          url: 'http://localhost:16686/trace/$${__value.raw}'
    secureJsonData:
      basicAuthPassword: test_password
Using a Jaeger data source:
In this example, the Jaeger data source’s uid value should match the Loki data source’s datasourceUid value.
datasources:
  - name: Jaeger
    type: jaeger
    url: http://jaeger-tracing-query:16686/
    access: proxy
    # UID should match the datasourceUid in derivedFields.
    uid: my_jaeger_uid
Configure with Terraform
You can configure the Loki data source using Terraform with the Grafana Terraform provider.
For more information about provisioning resources with Terraform, refer to Grafana as code using Terraform.
The following example provisions a Loki data source with a maximum line limit:
resource "grafana_data_source" "loki" {
  name = "Loki"
  type = "loki"
  url  = "http://localhost:3100"

  json_data_encoded = jsonencode({
    maxLines = 1000
  })
}
The following example uses basic authentication and defines a derived field that links to a Jaeger data source:
resource "grafana_data_source" "loki" {
  name           = "Loki"
  type           = "loki"
  url            = "http://localhost:3100"
  basic_auth_enabled  = true
  basic_auth_username = "my_user"

  json_data_encoded = jsonencode({
    maxLines = 1000
    derivedFields = [
      {
        datasourceUid   = "my_jaeger_uid"
        matcherRegex    = "traceID=(\\w+)"
        name            = "TraceID"
        url             = "$${__value.raw}"
        urlDisplayLabel = "View Trace"
      }
    ]
  })

  secure_json_data_encoded = jsonencode({
    basicAuthPassword = "<LOKI_PASSWORD>"
  })
}
Replace the placeholders with your own values:
<LOKI_PASSWORD>: The password for the basic authentication user.
For all available configuration options, refer to the Grafana provider data source resource documentation.
Was this page helpful?
Related resources from Grafana Labs



