Grafana Cloud
Observe and act
Alert and measure reliability
SLO
Additional configuration
Use gcx to manage SLOs
Use gcx to manage SLO resources
gcx is a command-line interface (CLI) that you and coding agents can use to manage Grafana resources. It provides two ways to manage SLO resources:
gcx slocommands to list, inspect, monitor, and delete SLO definitions and SLO reports. You and coding agents can use them to check the health of your SLOs and view how the SLI changes over time.gcx resourcescommands to export and provision SLO definitions and SLO reports as manifest files. Use them to create and update SLOs and keep them in version control.
Before you begin
Authenticate
gcxwith the preferred method for your Grafana Cloud stack.To check which configuration
gcxuses, run:gcx config view
Manage resources with gcx slo
Use gcx slo to inspect and manage SLO definitions and SLO reports:
Coding agents can also use gcx slo to understand the state of your system, such as which SLOs are breaching their objectives and how their error budgets change over time.
The gcx slo definitions and gcx slo reports commands support the same operations and arguments. The following examples use SLO definitions:
List all SLO definitions.
gcx slo definitions list┌───────────────────────┬──────────────────┬────────┬────────┬─────────┐ │ UUID │ NAME │ TARGET │ WINDOW │ STATUS │ ├───────────────────────┼──────────────────┼────────┼────────┼─────────┤ │ gxqieubrb1s3d1ex6meoh │ Latency SLO │ 99.00% │ 28d │ updated │ │ a835ucvmpqa1gd7szlsuk │ Availability SLO │ 99.90% │ 7d │ updated │ └───────────────────────┴──────────────────┴────────┴────────┴─────────┘Get a single SLO definition by its UUID. The output is YAML by default. Use
-o jsonfor JSON. Redirect the output to a file to read or edit it:gcx slo definitions get <UUID> -o yaml > slo.yamlShow the status of all SLO definitions, or pass a UUID to show a single SLO. The status includes the current SLI, the error budget, and the health of each SLO:
gcx slo definitions status┌──────────────────┬──────┬───────────┬────────┬─────────┬────────┬────────┐ │ NAME │ UUID │ OBJECTIVE │ WINDOW │ SLI │ BUDGET │ STATUS │ ├──────────────────┼──────┼───────────┼────────┼─────────┼────────┼────────┤ │ Latency SLO │ * │ 99.00% │ 28d │ 89.85% │ 66.2% │ OK │ │ Availability SLO │ * │ 99.90% │ 7d │ 100.00% │ 100.0% │ OK │ └──────────────────┴──────┴───────────┴────────┴─────────┴────────┴────────┘Use
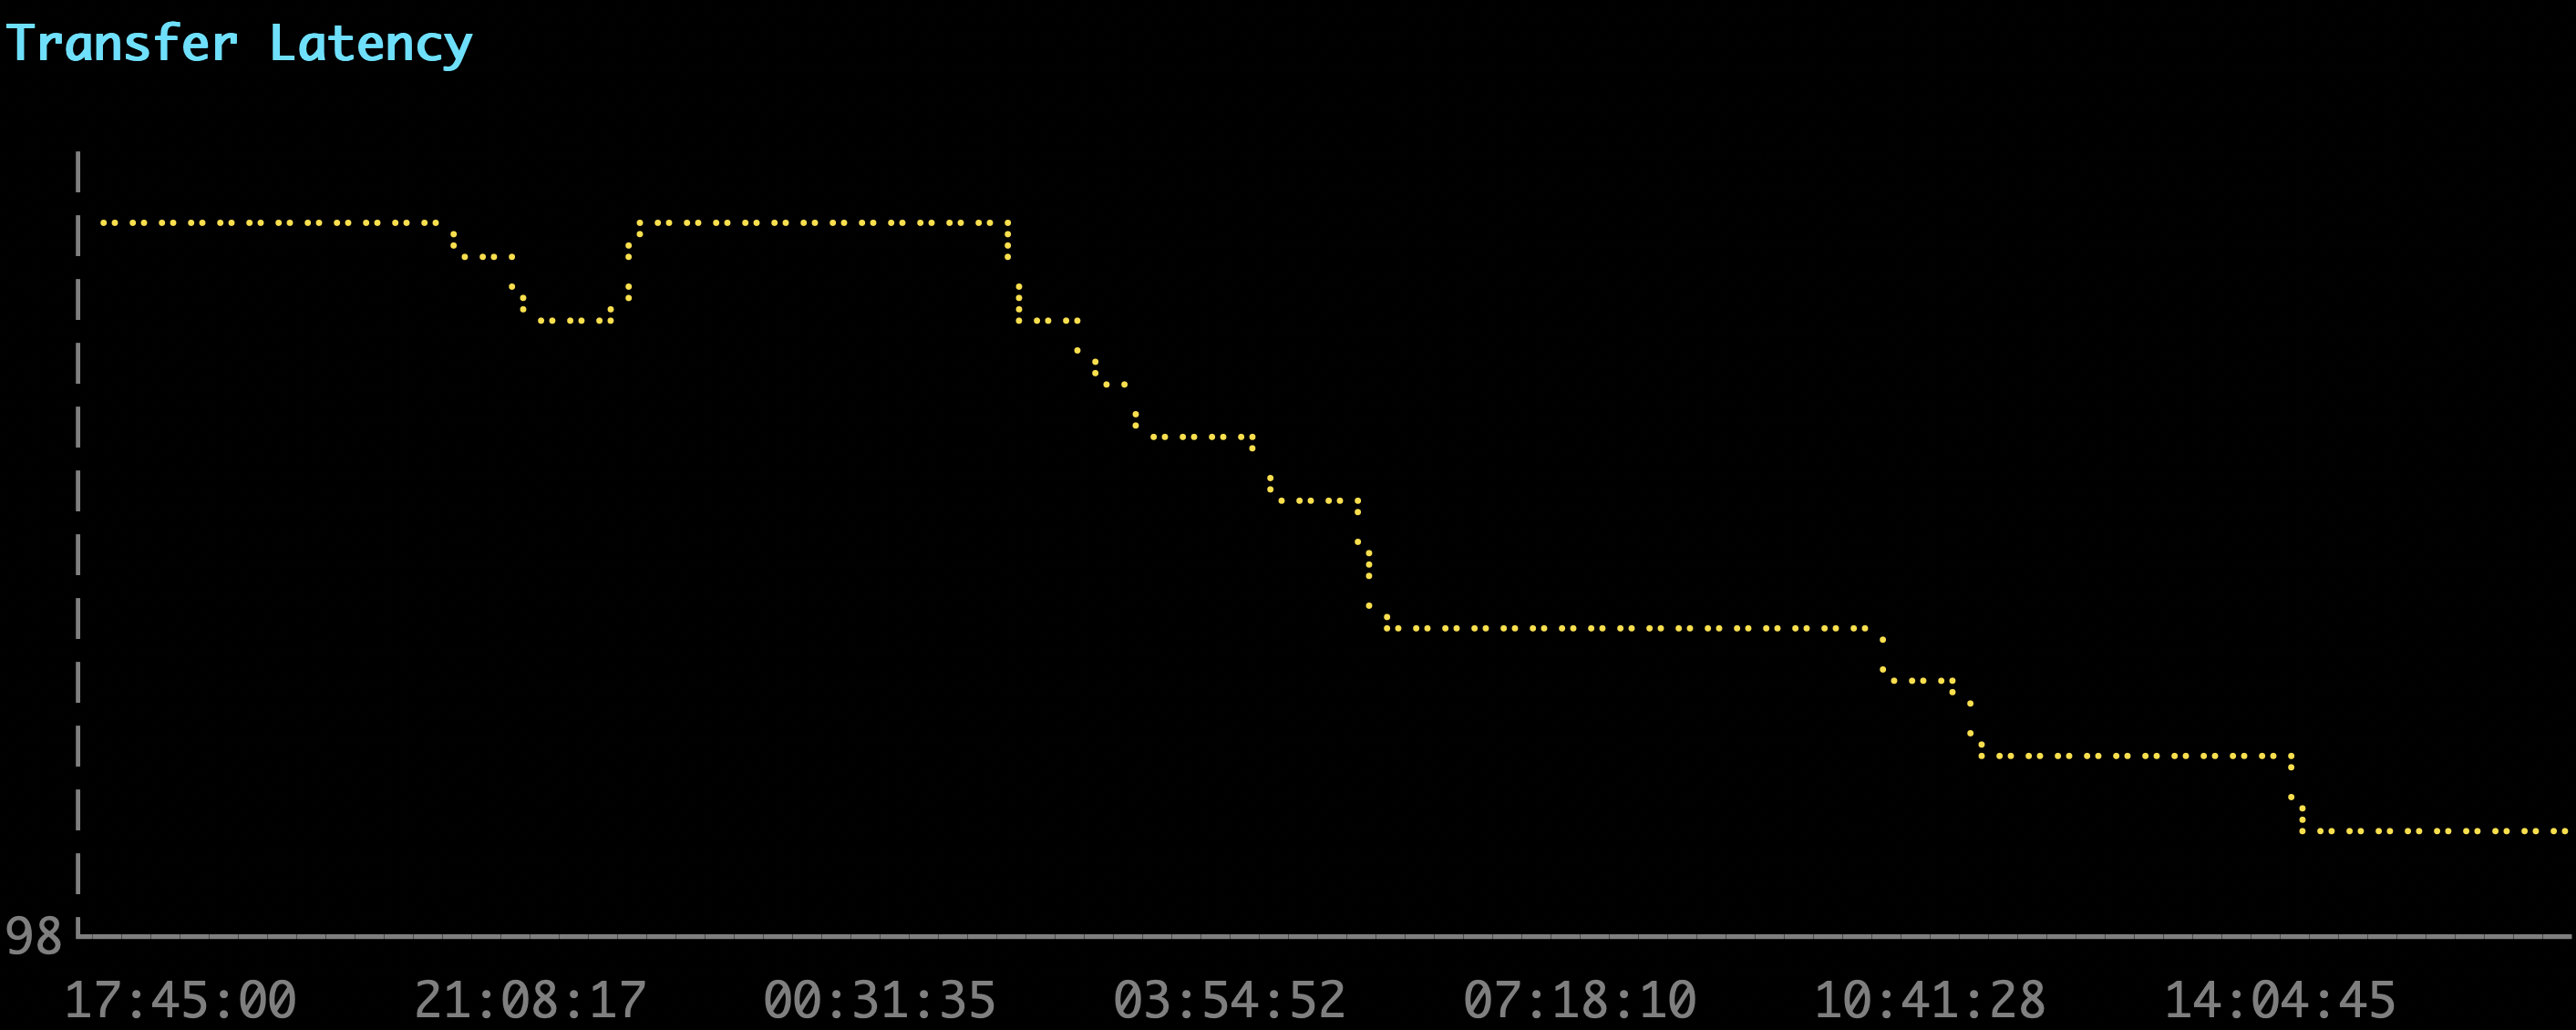
-o wideto include the burn rate and the 1-hour and 1-day SLI columns:┌──────────────────┬──────┬───────────┬────────┬─────────┬────────┬───────────┬─────────┬─────────┬────────┐ │ NAME │ UUID │ OBJECTIVE │ WINDOW │ SLI │ BUDGET │ BURN_RATE │ SLI_1H │ SLI_1D │ STATUS │ ├──────────────────┼──────┼───────────┼────────┼─────────┼────────┼───────────┼─────────┼─────────┼────────┤ │ Latency SLO │ * │ 99.00% │ 28d │ 89.85% │ 66.2% │ 0.35x │ 89.95% │ 89.66% │ OK │ │ Availability SLO │ * │ 99.90% │ 7d │ 100.00% │ 100.0% │ 0.00x │ 100.00% │ 100.00% │ OK │ └──────────────────┴──────┴───────────┴────────┴─────────┴────────┴───────────┴─────────┴─────────┴────────┘Render the timeline of the SLI as a line chart. By default, it shows the last 7 days:
gcx slo definitions timeline --since 24h![Line chart of the SLI over time, rendered by the gcx slo definitions timeline command]()
To set an exact range, use
--from,--to, and--step, for example--from now-24h --to now --step 5m.Delete one or more SLO definitions by their UUIDs:
gcx slo definitions delete <UUID>gcxasks for confirmation before it deletes the SLO definition. To skip the prompt, add--force.
Manage resources with gcx resources
Use gcx resources to export SLO definitions and SLO reports as manifest files, and to create, update, or provision them from those files.
gcx resources supports the following SLO resource types. To list them, run:
gcx resources list-types --no-schema -o text | grep sloslo.ext.grafana.app v1alpha1 reports
slo.ext.grafana.app v1alpha1 slosUse pull to export existing SLO definitions and SLO reports to a local directory:
gcx resources pull slos reports --path ./slo-config/By default, gcx resources pull writes JSON and names each file after metadata.name, which is the UUID.
Use push to provision the SLO definitions and SLO reports saved in the directory:
gcx resources push slos reports --path ./slo-config/To push one resource, add its metadata.name to the selector:
gcx resources push slos/<UUID> --path ./slo-config/Note
Pushing an existing resource updates it.
Was this page helpful?
Related resources from Grafana Labs