

Send Claude Platform traces
Note
OpenTelemetry ingestion in Agent Observability is currently in public preview. Grafana Labs offers limited support, and breaking changes might occur prior to the feature being made generally available.
OpenTelemetry export from the Claude Platform is now in public beta. It exports traces for Messages API requests and Claude Managed Agents sessions. Send Messages API traces to Grafana Cloud to see each request in Agent Observability, with token usage, cost, and evaluations, without changing your code.
Before you begin
Before you start, make sure you have:
- Agent Observability enabled on your Grafana Cloud stack. Refer to Set up Agent Observability.
- The Admin role in your Claude Console organization.
Add a Grafana Cloud destination
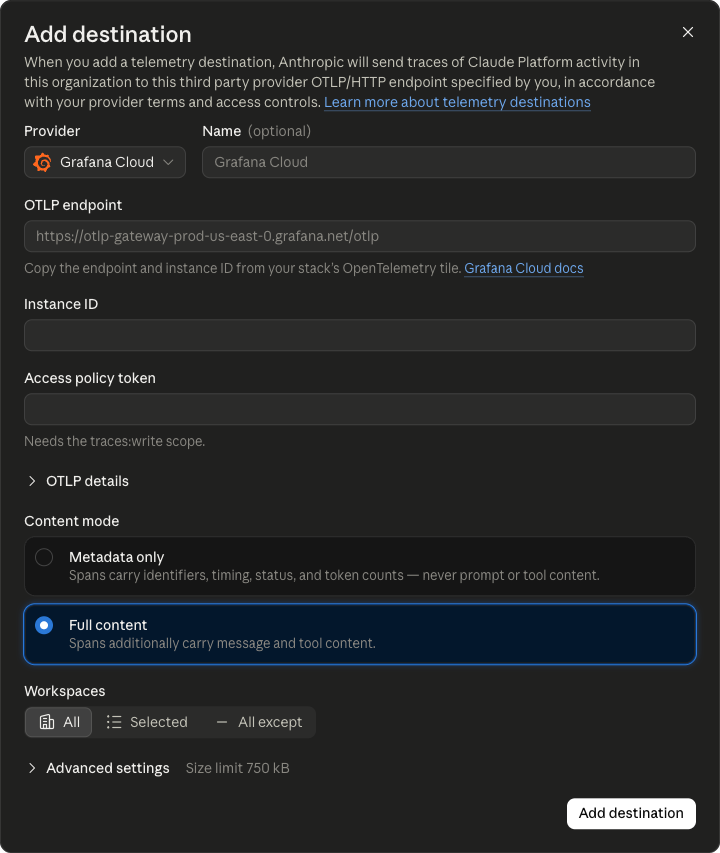
Add your Grafana Cloud stack as a telemetry destination in the Claude Console.
- In the Grafana Cloud portal, open your stack and copy the OTLP endpoint URL and the Instance ID from the OpenTelemetry card. Refer to OpenTelemetry card on the Grafana Cloud portal.
- Create a Cloud Access Policy token with the
traces:writescope. Refer to Cloud access policy. - In the Claude Console, open the OpenTelemetry settings page and click Add destination.
- Select Grafana Cloud as the Provider.
- Enter the OTLP endpoint, the Instance ID, and the token as the Access policy token.
- Under Content mode, select Full content to see prompts and responses. Metadata only sends token counts and timing without content.
- Choose which workspaces send traces: all, selected ones, or all except selected ones.
- Click Add destination.
For more about the export, refer to Export OpenTelemetry traces from the Claude API in the Claude documentation.
Group requests into conversations
Agent Observability groups the requests of one trace into one conversation.
By default, each request is its own trace.
To keep a multi-turn conversation together, send the same W3C traceparent header, with the sampled flag set, on each of its requests.
The Claude SDK sets traceparent for you when you call it inside one of your own spans.
Verify data
Send a Messages API request, then check the export:
- In the Claude Console, check that the Delivery column for your destination shows Healthy.
- Open Conversations in Agent Observability. The request appears with its model, token usage, cost, and stop reason. With Full content, it also shows the prompt and response.
Was this page helpful?
Related resources from Grafana Labs


