
Analyze results with Synthetic Monitoring
When Synthetic Monitoring runs your checks, it stores the results in Grafana Cloud as Prometheus metrics and Loki logs. Synthetic Monitoring provides a centralized dashboard where you can get an overview of your checks’ execution, individual results, and trends, as well as individual dashboards for each check.
These check results are designed to detect potential issues in the system under test and provide insights into common performance indicators such as uptime, error rate, and latency.
Get an overview of all your checks
The main Synthetic Monitoring page displays the status of all your checks over a specified period.
This dashboard provides an overview of how your checks are performing, including the results of key common check metrics. These results can help you identify specific checks, discover anomalies, and navigate to more detailed analyses.

On this page, you can find the list of check results and a summary of their status. You can also:
- Visualize the error rate of probes by locations.
- See the percentage of errors for individual checks.
- Compare the latency across the distinct checks.
You can use the various filters to find checks by region, probes, check types, alert status, or custom labels.
From this main page, or the checks page, you can navigate to the results of individual checks.
Analyze check results
On the Check Results Dashboard, you can see the results of individual checks, with options to filter by specific probes, alert status, and time ranges.
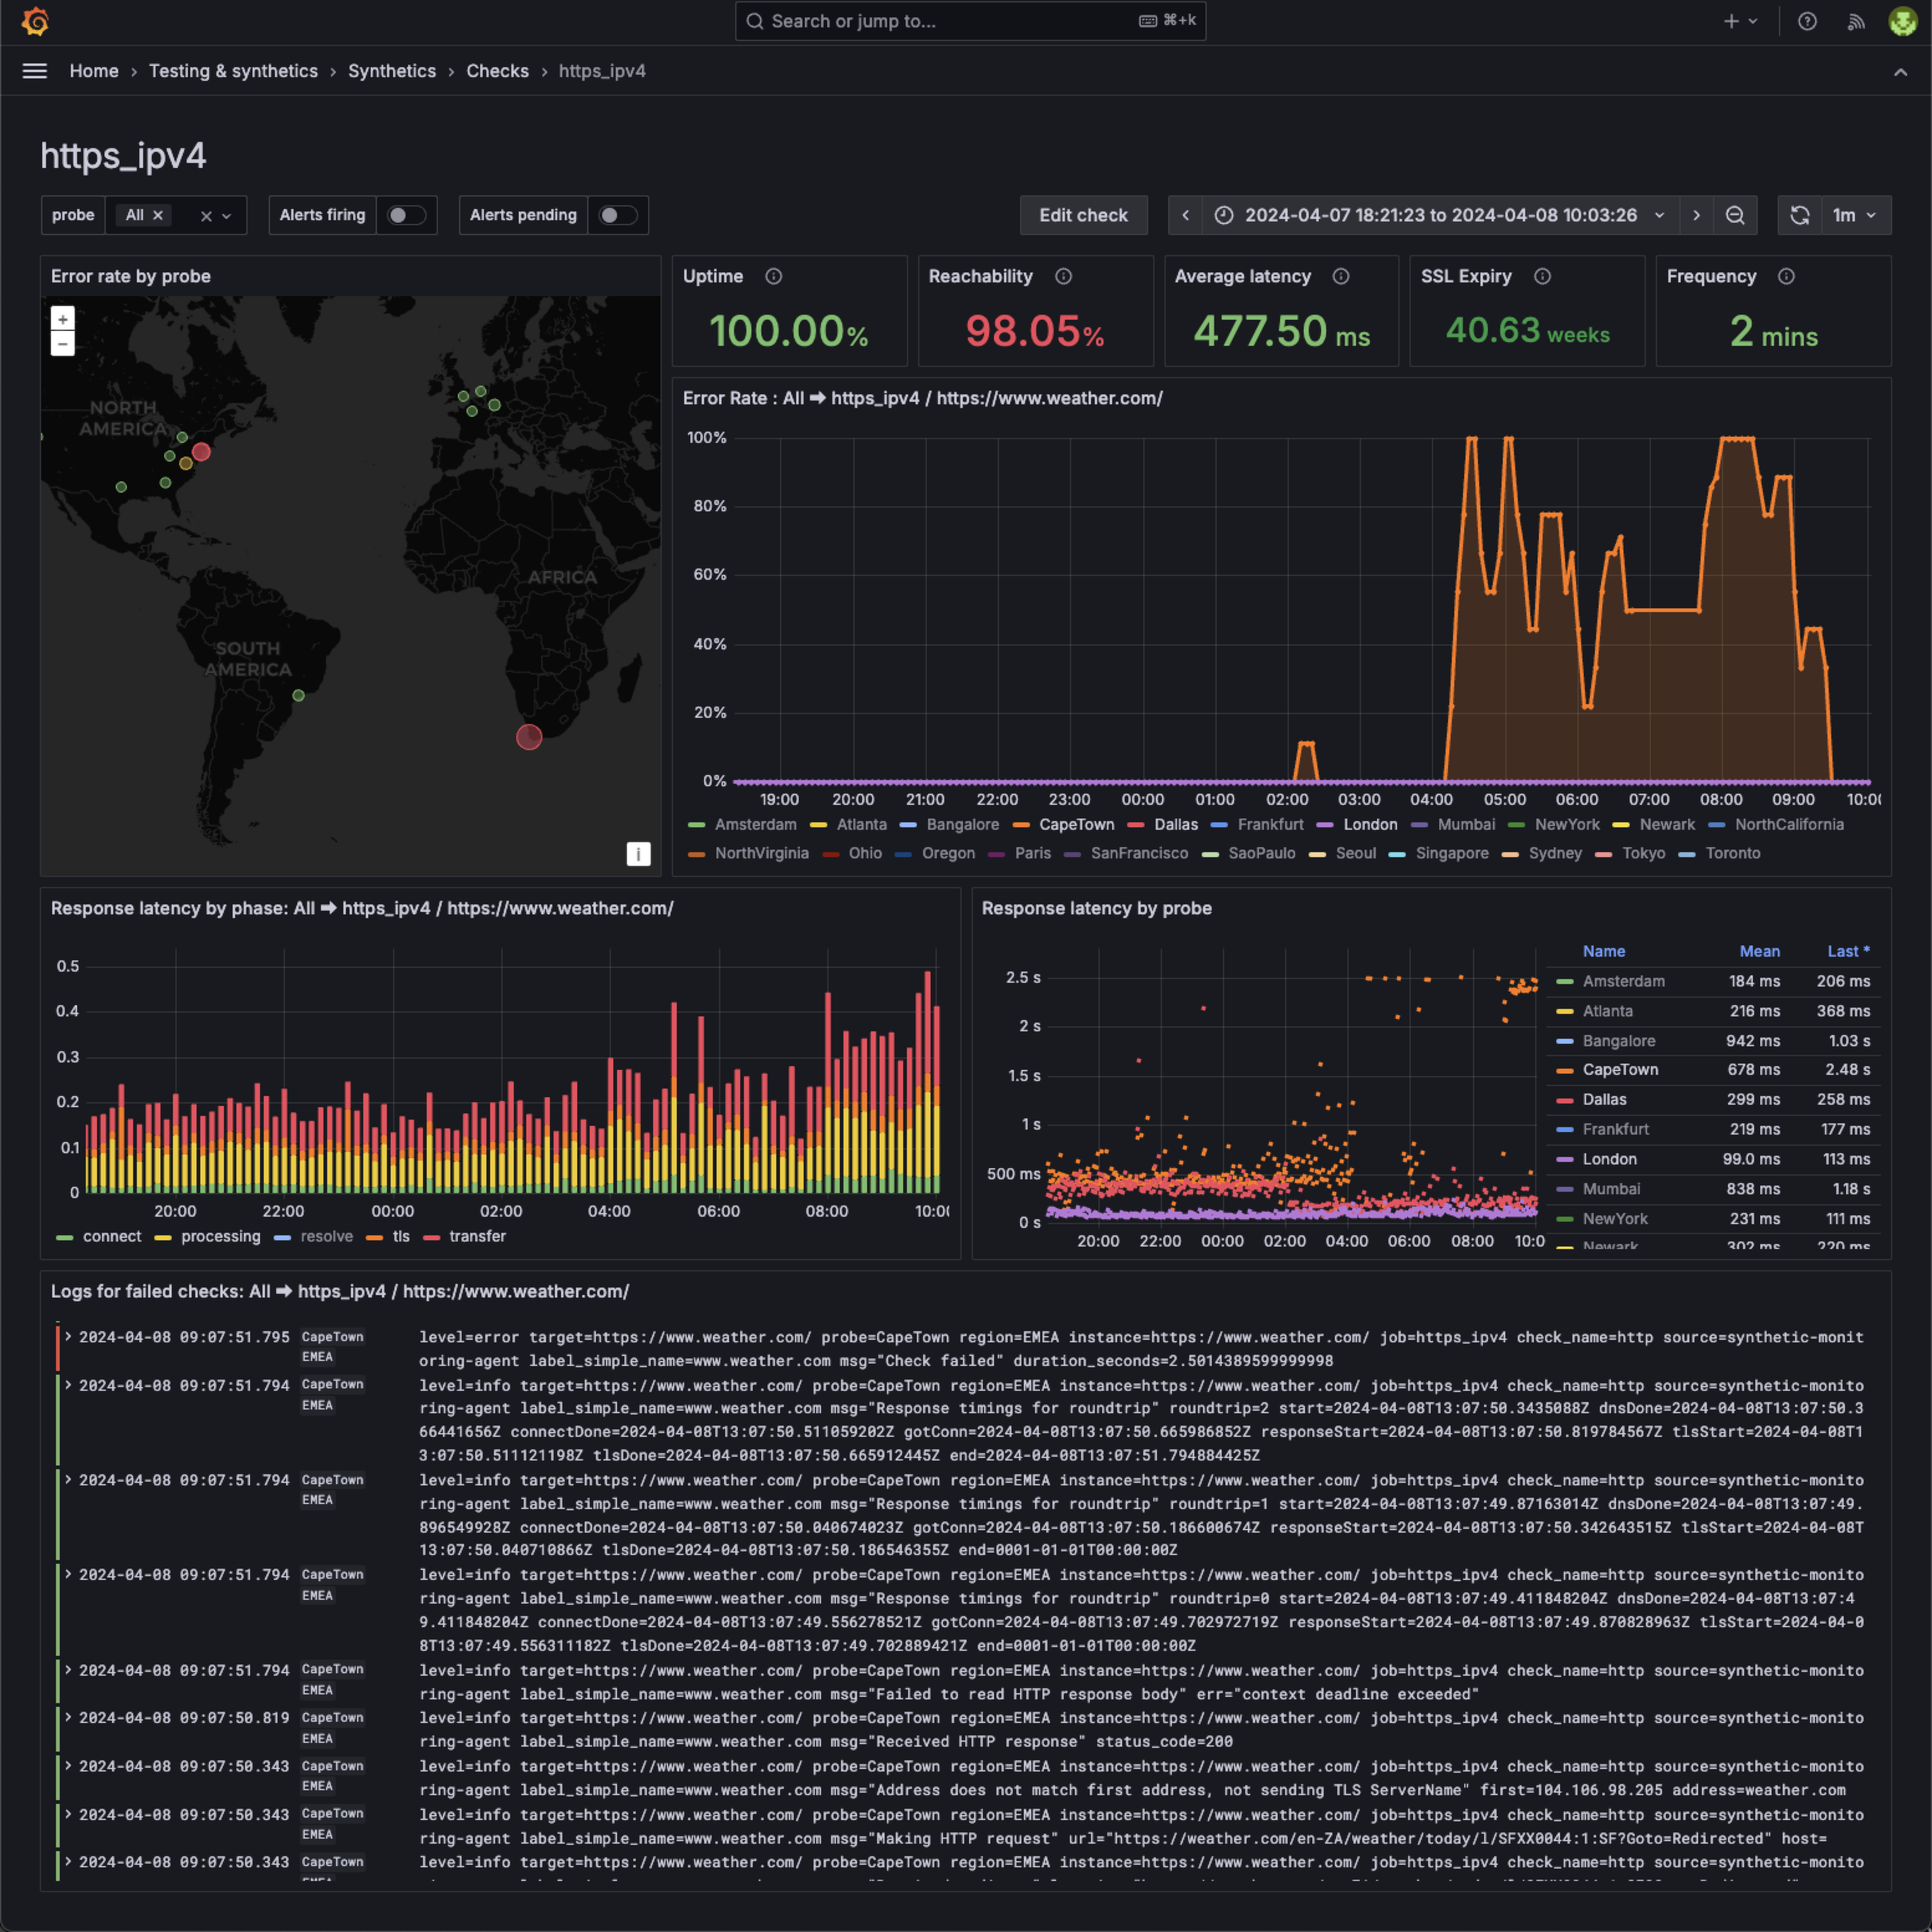
The dashboard displays probe logs and relevant indicators to all check types, such as latency, uptime, and reachability, as well as custom panels for each check type.
Explore your check metrics
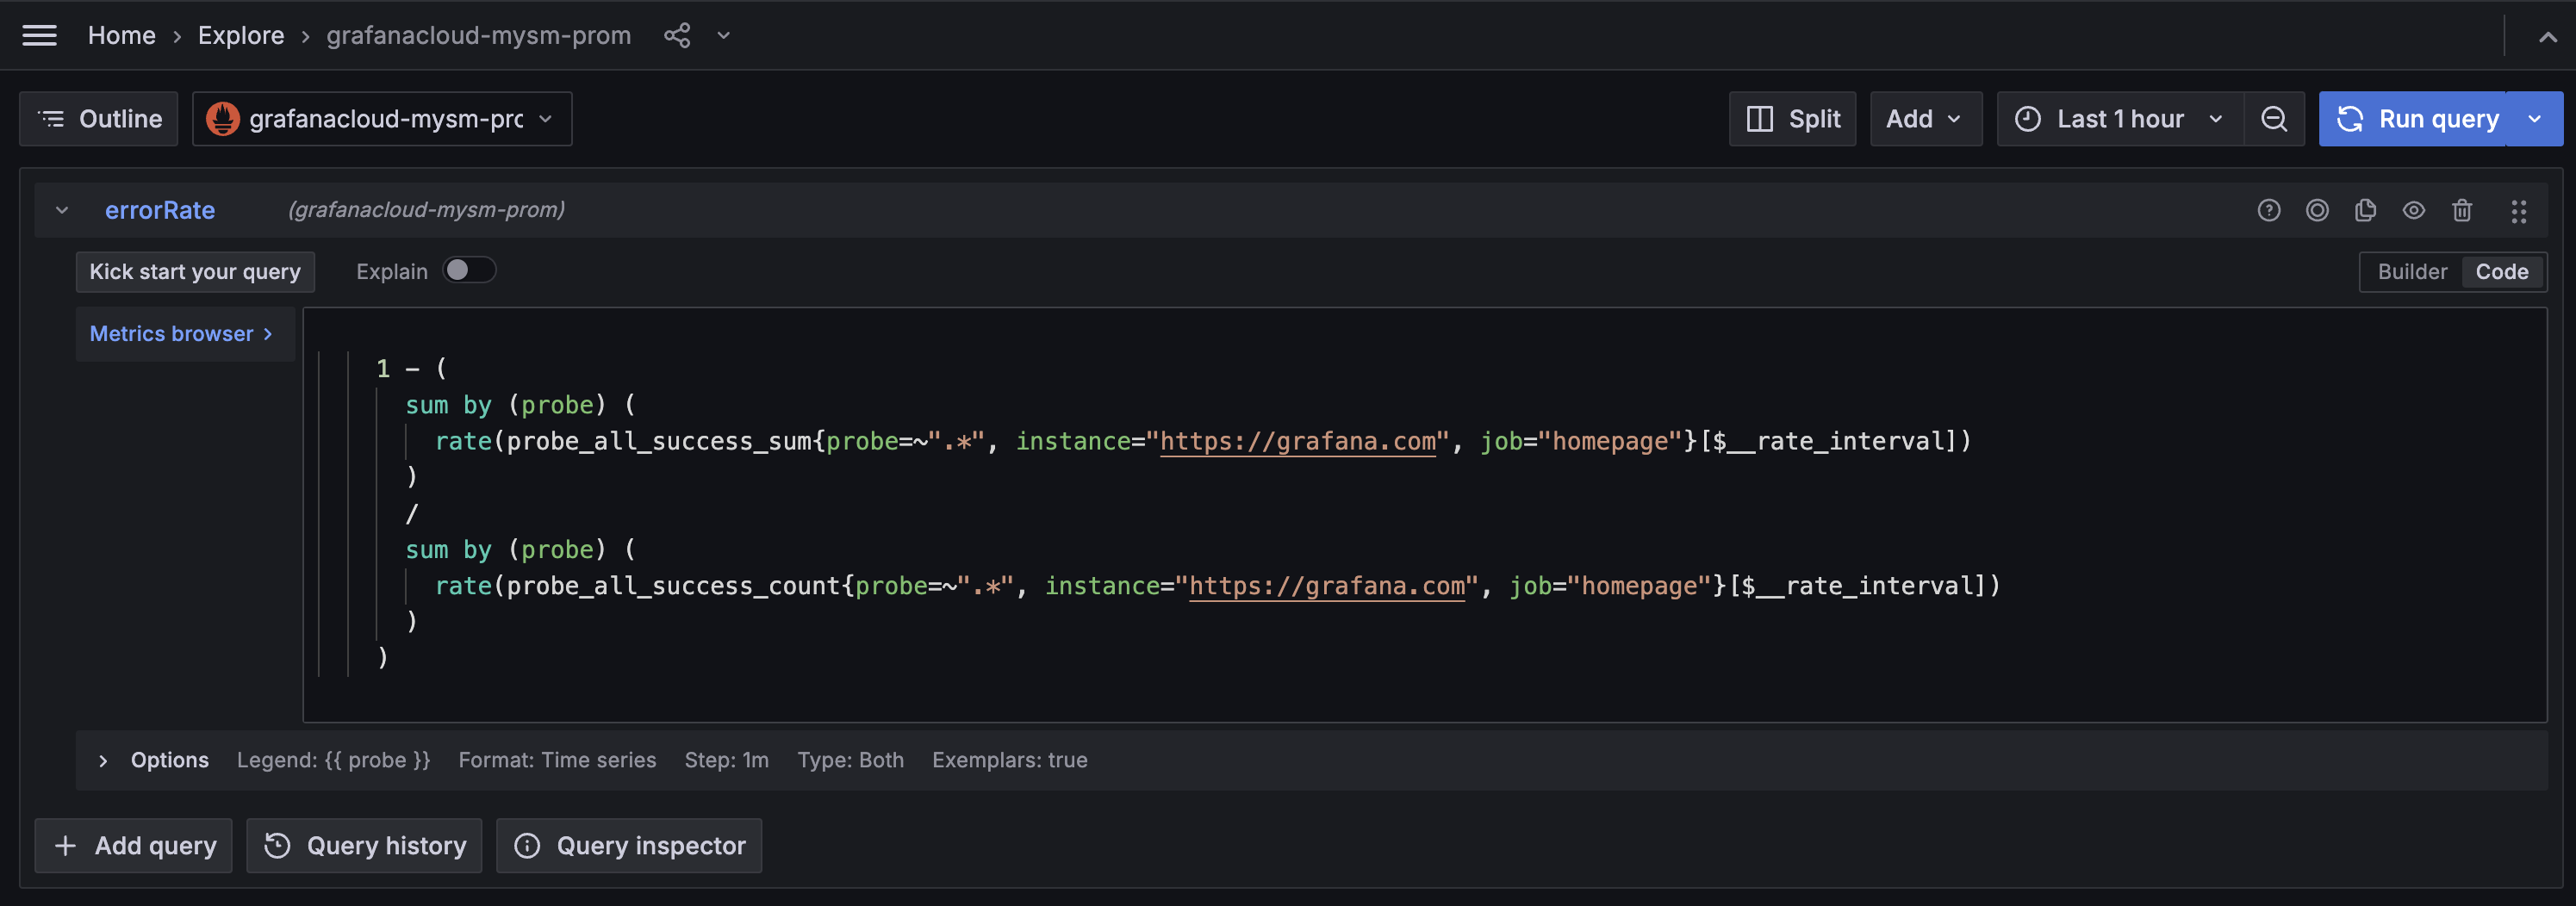
You can use Grafana Explore to play around with check metrics to build custom panels, dashboards, and alerts.
To learn more about all the existing metrics for the various check types, refer to Check metrics.
You can also discover the distinct metrics by exploring the Synthetic Monitoring dashboards:
- Navigate to the main dashboard or one dashboard displaying check results.
- Head over to a panel whose query you want to view.
- Click the action menus (three dots) in the top-right corner of the panel.
- Click Explore.
- You can now view and play with the query that builds the selected panel.
Note
Query changes in Explore do not apply to the Synthetic Monitoring dashboards.
Was this page helpful?
Related resources from Grafana Labs


