
 Grafana Cloud
Observe and act
Monitor infrastructure
Cloud Provider Observability
Azure observability
Preconfigured dashboards and alerts
Grafana Cloud
Observe and act
Monitor infrastructure
Cloud Provider Observability
Azure observability
Preconfigured dashboards and alertsPreconfigured dashboards and alerts for Azure metrics
Cloud Provider Observability provides the following preconfigured dashboards and alerts. The dashboards appear automatically in the Azure observability section of Cloud Provider Observability in Grafana Cloud after you configure a scrape job. Preconfigured alerts require a one-time installation.
Preconfigured dashboards
Preconfigured dashboards are available for the following Azure resources.
This dashboard offers insights into Application Gateway performance, including:
- Request throughput and response times
- Backend connection metrics
- Healthy and unhealthy host counts
- Failed request counts
- Current connections
- Bytes sent and received
Use this dashboard to:
- Monitor application delivery performance
- Identify backend health issues
- Detect request failures and investigate causes
- Track connection patterns and capacity
- Optimize Application Gateway configuration based on traffic patterns For detailed metrics information, refer to Microsoft.Network/applicationgateways.
This dashboard provides visibility into Azure Container Apps performance, capacity, and runtime behavior, including:
- CPU usage (percentage and nanocores)
- Memory usage (percentage and working set bytes)
- Replica counts and scaling activity
- Active revisions
- Container restart counts
- Network traffic (received and transmitted bytes)
Use this dashboard to:
- Monitor CPU and memory utilization across container app revisions
- Understand scaling behavior by tracking replicas over time
- Identify unstable workloads using container restart metrics
- Compare resource usage between active revisions
- Observe network traffic patterns for running container apps
- Troubleshoot performance and capacity issues in production workloads
For detailed metrics information, refer to Microsoft.App/containerApps.
This dashboard displays MySQL Flexible Server performance and resource consumption metrics, including:
- CPU and memory utilization (average and maximum)
- Storage usage and IOPS
- Query rate and query type breakdown (SELECT, INSERT, UPDATE, and DELETE)
- Active and aborted connections
- Slow query counts
- Network throughput (ingress and egress)
- Deadlocks, lock timeouts, and InnoDB row lock time
Use this dashboard to:
- Monitor CPU, memory, and storage utilization for capacity planning
- Track query and connection rates to understand workload patterns
- Identify slow queries and aborted connections that affect performance
- Investigate deadlocks and lock contention affecting throughput
- Detect storage constraints before they impact operations
For detailed metrics information, refer to Microsoft.DBforMySQL/flexibleServers.
This dashboard displays Event Hub streaming metrics, including:
- Incoming and outgoing messages
- Throttled requests
- Successful requests
- Throughput units usage
- Capture metrics (if enabled)
- Error counts
Use this dashboard to:
- Monitor event streaming throughput and performance
- Identify throttling issues that need capacity increases
- Track message processing rates
- Detect errors in event ingestion or delivery
- Plan Event Hub scaling based on traffic patterns
For detailed metrics information, refer to Microsoft.EventHub/Namespaces.
This dashboard provides Azure Front Door CDN and application delivery metrics, including:
- Request counts and response codes
- Backend health percentage
- Latency measurements
- Web Application Firewall (WAF) request counts
- Cache hit ratios
- Bandwidth usage
Use this dashboard to:
- Monitor global application delivery performance
- Track backend health across regions
- Analyze response code patterns to identify issues
- Monitor WAF activity and security threats
- Optimize cache configuration for better performance
For detailed metrics information, refer to Microsoft.Cdn/profiles.
This dashboard provides Load Balancer monitoring, including:
- Data path availability
- Health probe status
- SNAT (Source Network Address Translation) connection counts
- Byte and packet counts
- Frontend and backend health
Use this dashboard to:
- Monitor load balancer availability and health
- Track backend pool health status
- Detect SNAT port exhaustion
- Analyze traffic distribution across backends
- Troubleshoot connectivity issues
For detailed metrics information, refer to Microsoft.Network/loadBalancers.
This dashboard displays PostgreSQL database performance metrics, including:
- Connection counts: Active, idle, and failed connections
- CPU and memory utilization
- Storage usage and IOPS
- Transaction and query metrics
- Replication lag (if applicable)
Use this dashboard to:
- Monitor database connection health and capacity
- Track resource utilization for capacity planning
- Identify storage constraints before they impact operations
- Analyze query performance and identify slow queries
- Monitor replication health in high-availability configurations
For detailed metrics information, refer to Microsoft.DBforPostgreSQL/flexibleServers.
This dashboard provides Service Bus messaging metrics, including:
- Active message counts
- Dead-letter message counts
- Incoming and outgoing messages
- Successful and failed requests
- Throttled requests
- Connection counts
Use this dashboard to:
- Monitor message queue and topic health
- Identify messages moving to dead-letter queues requiring investigation
- Track message processing throughput
- Detect throttling indicating capacity constraints
- Troubleshoot connection and request failures
For detailed metrics information, refer to Microsoft.ServiceBus/Namespaces.
This dashboard displays information about Azure SQL Database performance and resource consumption, including:
- DTU (Database Transaction Unit) consumption: Shows the percentage of allocated DTUs being used
- Storage usage: Indicates how much database storage is consumed
- CPU usage: Displays CPU percentage used by database operations
- Worker usage: Shows the number of concurrent workers handling requests
- Connection metrics: Tracks successful and failed connection attempts
- Data I/O usage: Measures read and write operations
- Deadlock count: Shows the number of deadlocks occurring
Use this dashboard to:
- Monitor DTU consumption and determine when to scale database resources
- Track storage usage to prevent running out of space
- Identify high CPU queries that need optimization
- Detect connection failures that might indicate authentication or network issues
- Investigate deadlocks and optimize affected queries
- Plan database scaling based on resource utilization patterns
For detailed metrics information, refer to Microsoft.Sql/servers/databases.
This dashboard provides insights into Azure SQL Elastic Pool performance, including:
- eDTU usage across the pool
- Storage consumption by all databases in the pool
- CPU percentage used by the pool
- Data I/O performance
- Session and worker counts
Use this dashboard to:
- Monitor resource sharing across multiple databases in the pool
- Identify databases consuming disproportionate resources
- Determine when to scale the elastic pool
- Optimize resource allocation across pooled databases
For detailed metrics information, refer to Microsoft.Sql/servers/elasticpools.
These dashboards provide insights into Azure Storage services:
Blob Storage metrics include:
- Transaction counts and success rates
- Availability percentage
- Ingress and egress (data in/out)
- Average latency for operations
- Blob capacity and count
Queue Storage metrics include:
- Message counts
- Queue depth
- Transaction metrics
- Availability
- Latency measurements
Use these dashboards to:
- Monitor storage availability and performance
- Track data transfer patterns and optimize costs
- Identify performance issues with high latency
- Monitor queue depths to detect processing bottlenecks
- Plan storage capacity based on growth trends
For detailed metrics information, refer to:
This dashboard provides comprehensive monitoring for Azure Virtual Machines, including:
- CPU utilization: Displays the percentage of CPU being used by the virtual machine
- Memory metrics: Shows available and used memory
- Disk I/O: Indicates read and write operations per second
- Network traffic: Provides information about network bytes sent and received
- VM availability: Shows the health status of the virtual machine
Use this dashboard to:
- Monitor CPU and memory utilization to identify resource constraints
- Detect when virtual machines are unavailable or unresponsive
- Identify high disk I/O that might indicate performance bottlenecks
- Track network traffic patterns and potential network issues
- Plan capacity upgrades based on resource usage trends
For detailed metrics information, refer to Microsoft.Compute/virtualMachines.
This dashboard displays Virtual Network metrics, including:
- VNet peering connection metrics
- Subnet IP address utilization
- Network policy metrics
- Packet counts
- Bytes transmitted
Use this dashboard to:
- Monitor VNet peering connection health
- Track subnet IP address exhaustion
- Identify connectivity issues between peered networks
- Plan subnet capacity before running out of IP addresses
- Troubleshoot network communication problems
For detailed metrics information, refer to Microsoft.Network/virtualNetworks.
View Azure preconfigured dashboards
After you configure metrics, preconfigured dashboards appear automatically in the Cloud Provider Observability app. You don’t need to install them.
Note
If you are not assigned a Grafana Cloud basic role, you must have the
Datasources:Readerfixed role to see dashboard data. For more information on assigning roles, refer to Assign RBAC roles.
To view a preconfigured dashboard:
- Click the Services tab.
- Use the Service or Source filters to help you find the source or service you want to see.
- Optionally, click the Services with firing alerts checkbox to limit the services displayed to only those with firing alerts.
- Locate the specific service in the list, and click the name of the service in the Service column of the table to open the preconfigured dashboard for that service. If a Service’s name is not a link it means there is not a preconfigured dashboard for that service. To add a link to the Service’s name for a dashboard, refer to Dashboards and views settings.
- Optionally, click the Configure button to add a dashboard to the Service name.
- Optionally, click the Explore button to view links for custom dashboards, drilldown metrics, or to explore metrics. Refer to Dashboards and views settings for more information on adding custom dashboards.
Install Azure preconfigured alerts
Preconfigured alerts require a one-time installation.
Note
If you are assigned the Viewer Grafana Cloud basic role or are not assigned a Grafana Cloud basic role, you must have the
Alerting:Rules Writer,Alerting:Set provisioning status, andFolders:Writerfixed roles to install alerts and access folders. For more information on assigning roles, refer to Assign RBAC roles.
To install preconfigured alerts:
- After you configure metrics, click the Configuration tab.
- Scroll down to the Alerts Installation section and click Install.
To view preconfigured alerts, click the Alerts tab.
Filter dashboards
You can use the filters on any dashboard to refine your data. Filters are appropriate for each dashboard, and may include:
- Data source
- Job
- Resource group
- Subscription name
- Resource name
- Bucket name
- Instance
- Namespace
Additionally, use the time range selector to change time period of your data.
View predictions
For the preconfigured dashboards that include drilldown information for specific instances, Cloud Provider Observability includes machine learning predictions. Predictions can help you ensure resources are available during spikes in usage, as well as help you decrease the amount of unused resources due to over provisioning. To use prediction tools, first enable LLM features for your Grafana instance.
You can view the prediction model for various metrics by clicking the Predict button in the top right corner of the panel.
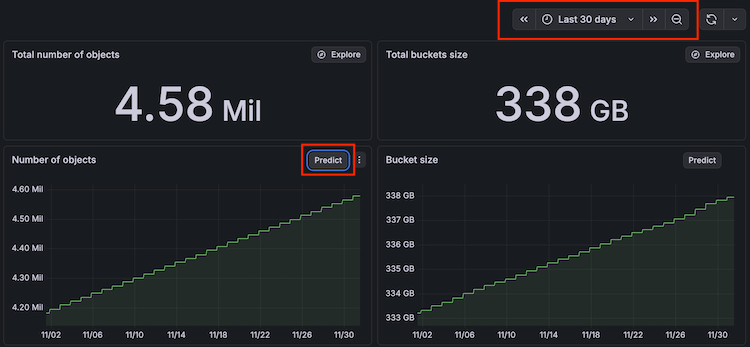
Use the time range filter to adjust the time range to show more advanced predictions. The time range you select must be at least two hours to use the prediction tool.
For more information on the terminology included and how machine learning works in the prediction graph, refer to the Query Metrics page in the AI and machine learning documentation.
Access Database Observability
For preconfigured dashboards that include drilldown information for Azure Database for MySQL and PostgreSQL instances, Cloud Provider Observability integrates with Database Observability.
You can move between infrastructure metrics on a cloud database instance and query-level performance in Database Observability.
Note
This integration requires configuring the
cloud_providerblock in Grafana Alloy. Refer to Add cloud provider integrations for setup instructions.
To navigate to Database Observability from a cloud database instance page in Cloud Provider Observability:
- On the instance page, click the MySQL or PostgreSQL dropdown in the upper right.
- Select a database instance from the list to open Queries Overview in Database Observability, filtered to that instance and schema.
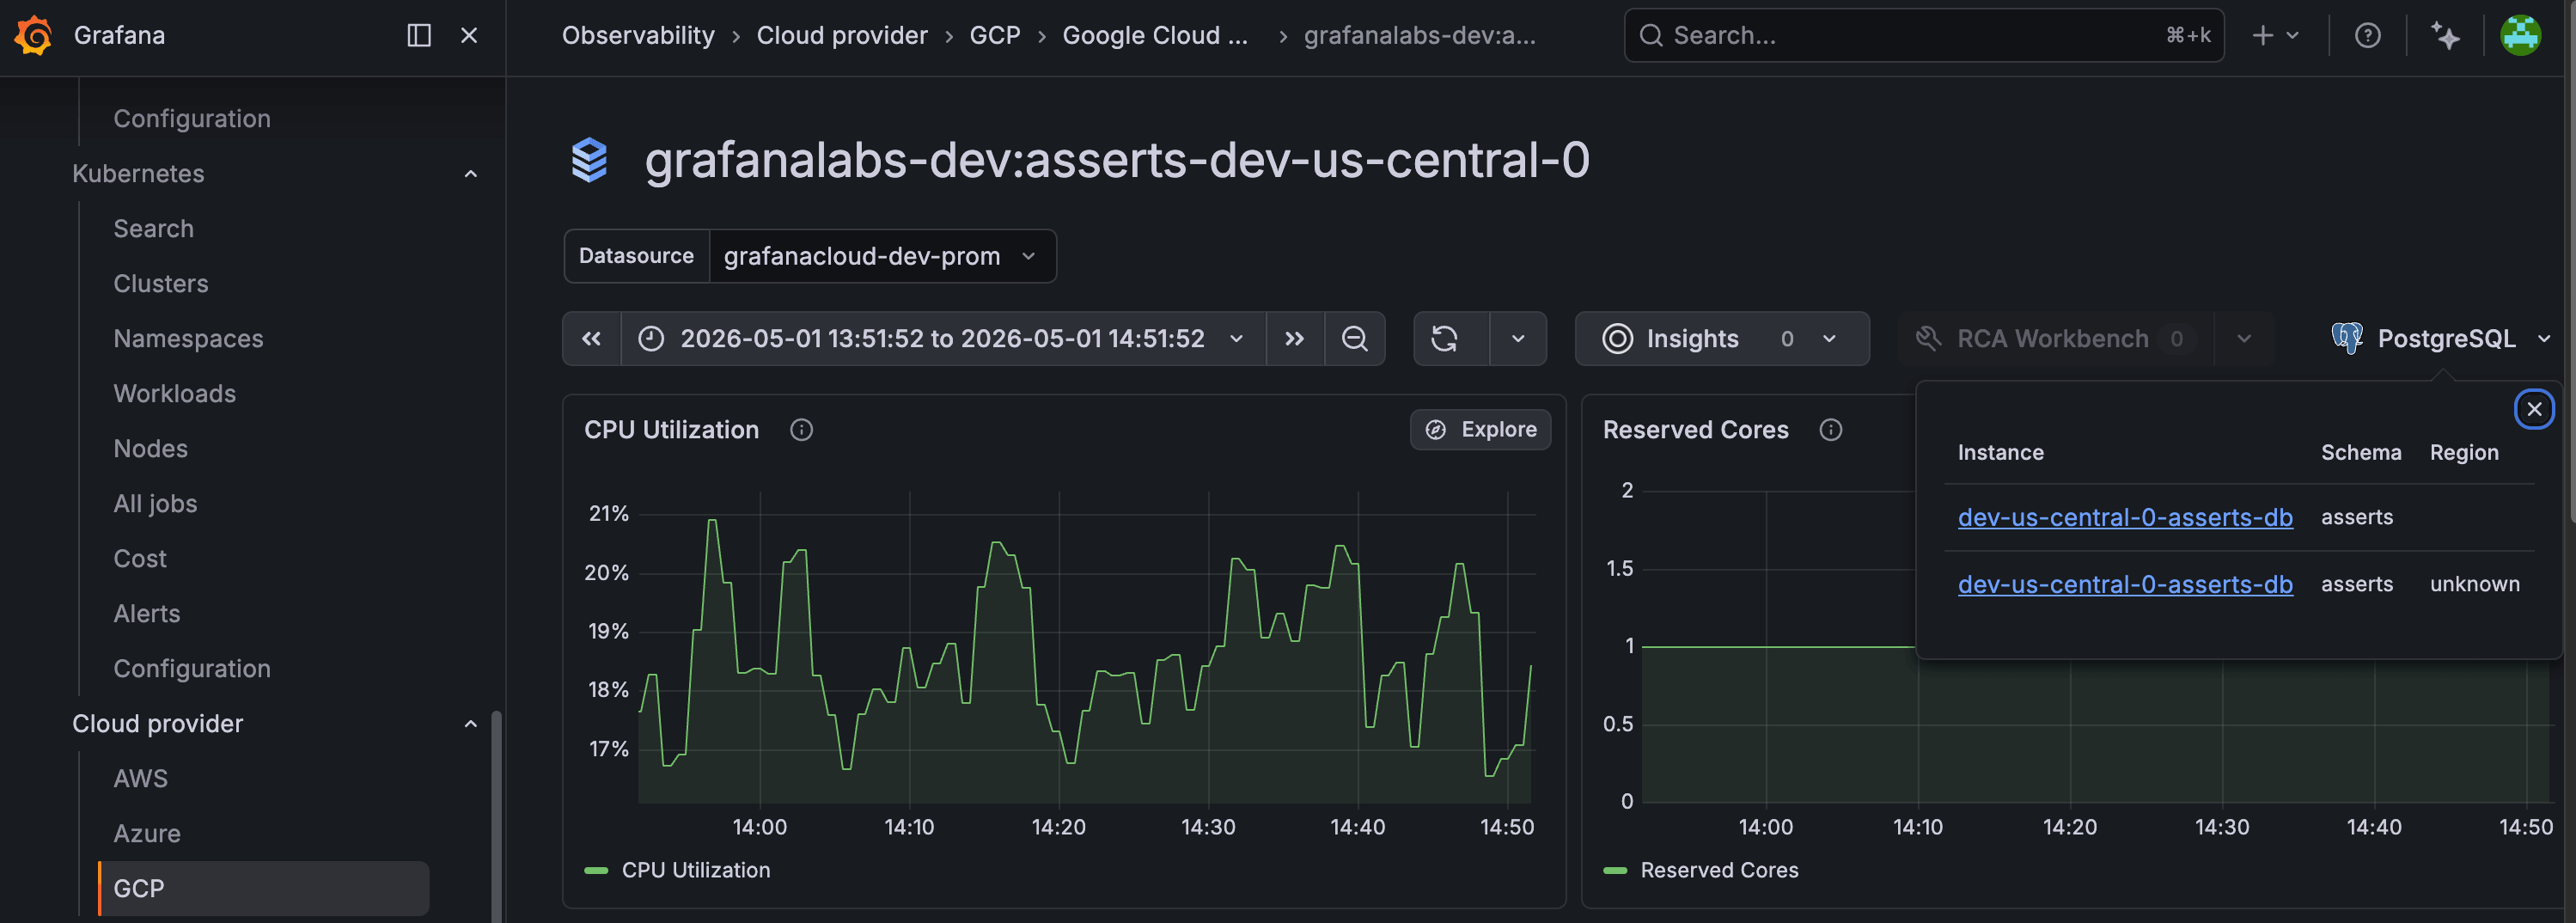
To return to Cloud Provider Observability from Queries Overview in Database Observability, use either of the following options:
- Instance column: In the query table, click an instance name in the Instance column. In the side panel, review infrastructure metrics for that instance, such as CPU utilization and read/write latency. Click Open in AWS, Open in Azure, or Open in GCP to open the matching Cloud Provider instance dashboard.
- Back to button: At the bottom of Queries Overview, click Back to (the label matches your cloud service, for example Back to RDS Instance or Back to Google Cloud SQL).
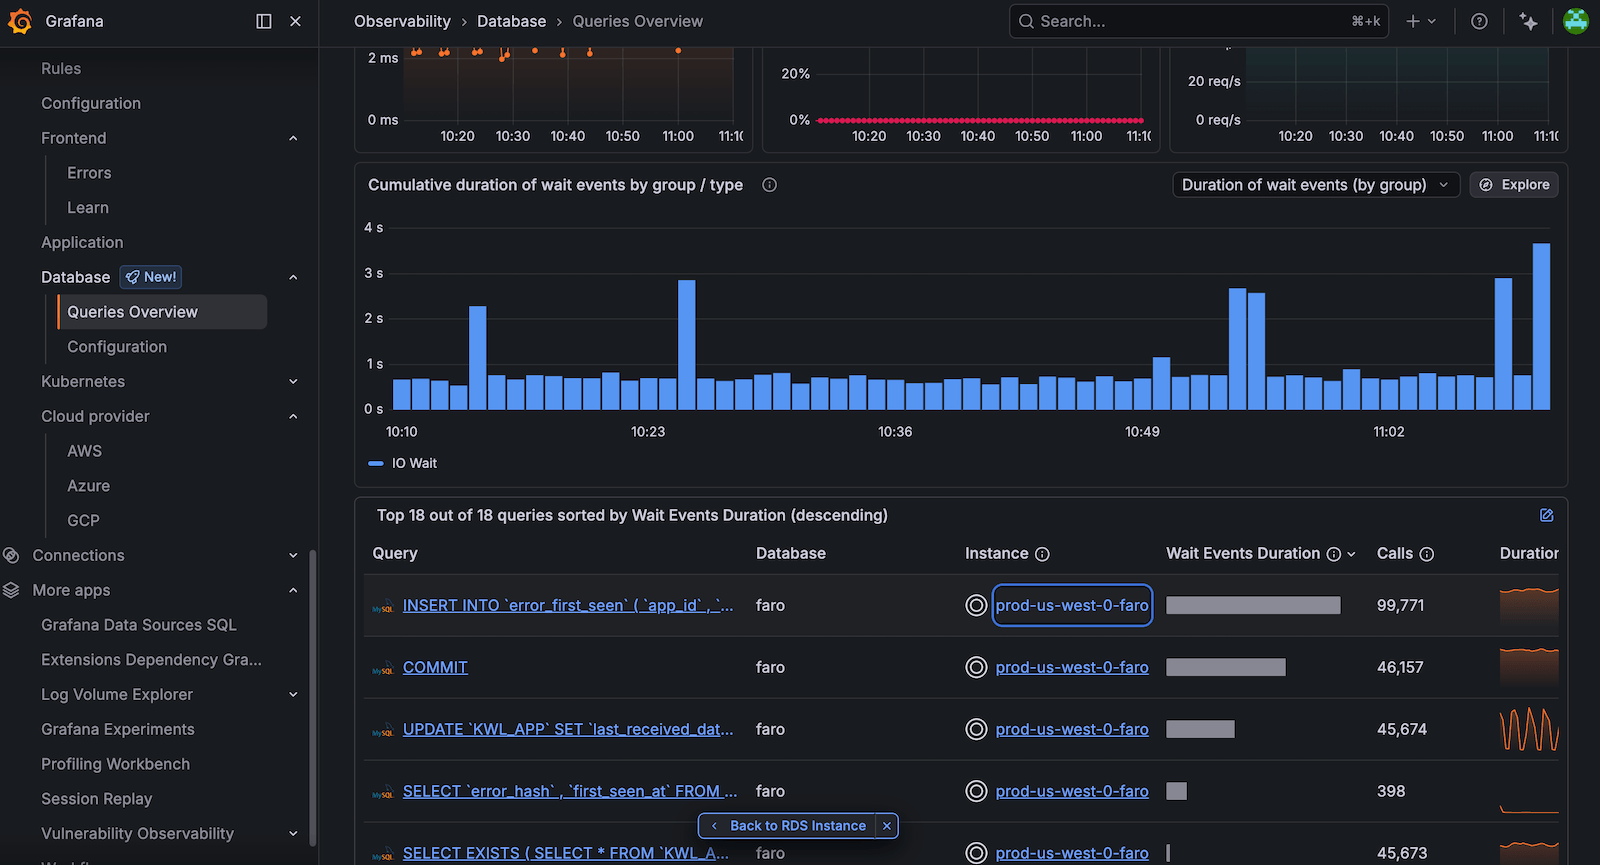
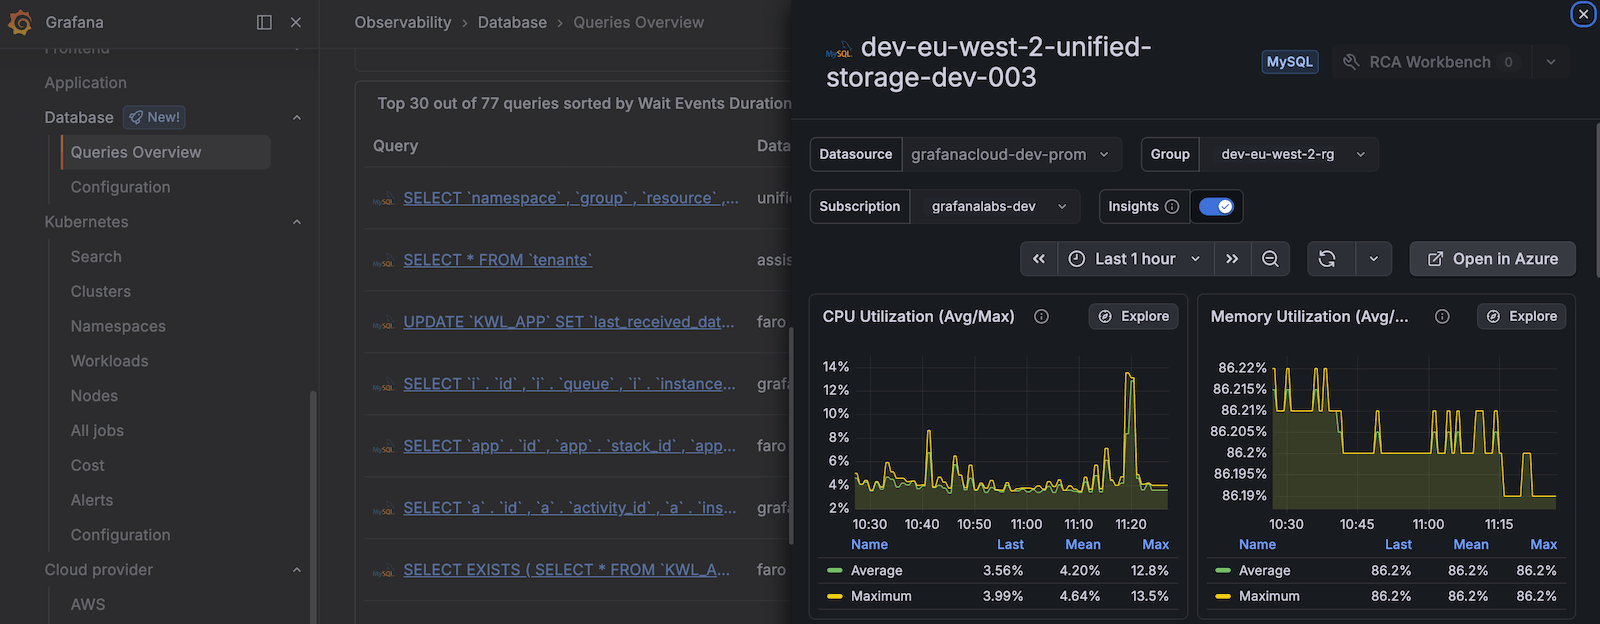
For more information on monitoring query performance and infrastructure metrics together, refer to View query performance.
Preconfigured alerts
Cloud Provider Observability provides preconfigured alerts that you can use right away to begin proactively monitoring and troubleshooting issues with your Azure resources.
Alerts are organized by severity level to help you prioritize your response. Critical alerts require immediate attention, warning alerts should be addressed soon, and info alerts provide awareness of conditions that may need investigation.
Critical alerts
Critical alerts indicate severe issues that require immediate attention to prevent service disruption or data loss.
Description: Virtual machine is unavailable
What this means: The specified virtual machine is not functioning or has crashed. This indicates the VM is completely unresponsive and may be impacting applications or services running on it.
What to do:
- Check the VM status in the Azure portal to determine if it’s stopped, deallocated, or in a failed state.
- Review the VM boot diagnostics and serial console logs for errors.
- Attempt to restart the VM if it’s in a stopped state.
- If the restart fails, you may need to redeploy the VM or restore from a backup.
- Consider implementing availability sets or availability zones to prevent single points of failure.
Description: Virtual machine CPU utilization is too high
What this means: The specified virtual machine is under heavy load with sustained high CPU usage. This can lead to degraded application performance and may eventually cause the VM to become unresponsive.
What to do:
- Identify which processes are consuming the most CPU by connecting to the VM and checking task manager or top/htop.
- Determine if the high CPU is expected (legitimate workload) or unexpected (runaway process, malware).
- If it’s a legitimate workload, consider scaling up to a larger VM size with more CPU cores.
- If it’s a runaway process, troubleshoot and fix the application or service causing the issue.
- Implement auto-scaling if workload patterns are predictable.
Description: Database has high DTU consumption
What this means: The database is consuming a high percentage of allocated Database Transaction Units (DTUs), which measure combined CPU, memory, and I/O resources. Sustained high DTU consumption can cause queries to slow down or fail.
What to do:
- Check active queries in the database to identify resource-intensive operations.
- Review and optimize slow queries using query performance insights.
- Check for missing indexes that might be causing table scans.
- Consider scaling up the database to a higher service tier with more DTUs.
- Implement query optimization strategies like adding indexes, rewriting queries, or archiving old data.
Description: Database has high storage usage
What this means: The database storage is nearing capacity. Running out of storage space can prevent new data from being written and may cause application failures.
What to do:
- Identify which tables are consuming the most space.
- Archive or delete old, unnecessary data.
- Check for large log files that can be truncated or backed up.
- Scale up the storage capacity to a higher tier.
- Implement data retention policies to automatically remove old data.
- Consider using Azure SQL Database elastic pools if you have multiple databases.
Description: Database has high worker thread usage
What this means: The database has a high number of concurrent worker threads handling queries and requests. This can indicate too many simultaneous operations, blocking, or long-running queries that prevent other queries from executing.
What to do:
- Look for long-running queries that are consuming worker threads.
- Review the number of concurrent queries and requests being sent to the database.
- Check for blocking sessions using database management views.
- Identify and resolve deadlocks if present.
- Optimize queries to run faster and release worker threads sooner.
- Consider increasing the service tier if concurrent workload is legitimate.
Description: Database tempdb log space is low
What this means: The tempdb system database is running low on log space. tempdb is used for temporary objects, internal operations, and sorting. Running out of tempdb space can cause queries to fail and impact all databases on the server.
What to do:
- Look for active sessions that might be using
tempdbintensively using database management views. - Identify stored procedures or queries that create large temporary tables or objects.
- Check for long-running or memory-intensive queries that rely heavily on
tempdb. - Consider optimizing queries to reduce
tempdbusage. - Monitor for explicit temporary table usage that can be eliminated.
- Scale up to a higher service tier if
tempdbspace is consistently insufficient.
Description: Virtual Network peering connection failures
What this means: The success rate of the specified Virtual Network (VNet) peering connections has fallen below the defined threshold. This indicates connectivity failures between peered virtual networks, which can disrupt communication between resources in different VNets.
What to do:
- Investigate potential VNet peering misconfigurations in the Azure portal.
- Check for network security group (NSG) rules that might be blocking traffic.
- Verify that the peering status is “Connected” for both sides of the peering.
- Check for address space overlaps between peered VNets.
- Review service health in Azure to determine if there are platform-level network issues.
- Monitor network latency between peered VNets for performance problems.
Description: Virtual Network subnet IP exhaustion
What this means: The IP addresses for the specified subnet on the specified Virtual Network have dropped below the critical threshold. This can cause connectivity issues for new resources that require IP allocations, preventing you from deploying additional resources to the subnet.
What to do:
- Identify resources in the subnet that are no longer needed and can be removed.
- Check for leaked IP addresses from deleted resources that weren’t properly released.
- Resize the subnet by expanding the address range (requires careful planning).
- Create a new subnet with a larger address space and migrate resources.
- Optimize IP usage by consolidating resources or using private endpoints where possible.
- Consider implementing IP Address Management (IPAM) practices to track usage.
Warning alerts
Warning alerts indicate issues that should be addressed soon to prevent them from becoming critical problems.
Description: Database has high number of system failed connections
What this means: The database is experiencing a high rate of failed connection attempts at the system level. This can prevent applications from accessing the database and indicates potential infrastructure or configuration problems.
What to do:
- Check for network connectivity problems between the application and database.
- Review firewall rules to ensure the application IP addresses are allowed.
- Verify that the database service is running and accepting connections.
- Check for high resource consumption (CPU, memory) on the database that might be preventing new connections.
- Review connection string configurations in your applications.
- Monitor for distributed denial of service (DDoS) attacks or unusual connection patterns.
Description: Database has high user CPU usage
What this means: User queries are consuming a high percentage of CPU resources. Unlike DTU consumption, this specifically measures CPU used by user queries rather than system operations.
What to do:
- Identify the top CPU-consuming queries using query performance insights or database management views.
- Review execution plans for inefficient queries.
- Look for missing indexes that cause table scans.
- Optimize queries by rewriting them or adding appropriate indexes.
- Consider implementing query result caching where applicable.
- Scale up to a higher service tier if optimization isn’t sufficient.
Description: Database has high number of user failed connections
What this means: User applications are experiencing a high rate of failed connection attempts. This differs from system connection failures and typically indicates authentication, authorization, or application configuration problems.
What to do:
- Check for authentication problems like incorrect credentials or expired passwords.
- Review network configuration errors between applications and the database.
- Verify that firewall rules allow connections from your application sources.
- Check for connection string errors in application configurations.
- Look for resource constraints like max concurrent connections being reached.
- Monitor Azure Active Directory authentication if using AAD for database access.
Info alerts
Info alerts provide awareness of conditions that may require investigation but are not urgent. These help you identify trends and potential issues before they become problems.
Description: Database has high data I/O usage
What this means: The database is experiencing high read or write activity. While this may be normal for your workload, sustained high I/O can indicate inefficient queries or missing indexes that cause excessive data access.
What to do:
- Review queries with high read or write activity using query performance insights.
- Check for missing indexes that result in full table scans.
- Look for inefficient indexes that aren’t being used or cause excessive writes.
- Assess the volume of transactions and data modifications.
- Consider implementing read replicas to offload read operations.
- Evaluate if a higher service tier with better I/O performance is needed.
Description: Database has high deadlock count
What this means: The database is experiencing frequent deadlocks, where two or more queries are waiting for each other to release locks on resources. Deadlocks cause queries to fail and require retry logic in applications.
What to do:
- Check the database deadlock logs to identify which queries are involved.
- Review the deadlock graphs to understand the lock contention pattern.
- Optimize affected queries to access resources in a consistent order.
- Consider reducing transaction isolation levels if appropriate for your application.
- Minimize the time transactions hold locks by keeping transactions short.
- Implement retry logic in applications to handle deadlock failures gracefully.
Manage alerts
To view alerts, navigate to the Alerts tab.
To see a recommendation for alert resolution, click the tooltip in the row of the Summary column.
In the Alert column, click the alert to view the dashboard for that service.
Was this page helpful?
Related resources from Grafana Labs



