
 Grafana Cloud
Observe and act
Monitor infrastructure
Kubernetes Monitoring
Triage your infrastructure
Use Assistant health checks
Grafana Cloud
Observe and act
Monitor infrastructure
Kubernetes Monitoring
Triage your infrastructure
Use Assistant health checksUse Assistant health checks
Note
Assistant health checks is currently in public preview. Grafana Labs offers limited support, and breaking changes might occur prior to the feature being made generally available.
Grafana Assistant runs a health check at the top of every Kubernetes detail page. Assistant health checks gives you a plain-language summary of issues that the Assistant detects, so you can catch problems while you navigate instead of scanning every panel.
The Assistant health check shows:
- A health indicator of the current state: Healthy or Unhealthy
- A one-sentence summary of what the Assistant detected

Investigate with the Assistant health check
To investigate a finding, click the chat icon on the far right side. The Grafana Assistant panel opens and explains what is happening and any next steps. You can ask follow-up questions of Grafana Assistant without re-explaining what you’re looking at, because it receives the context of the page you’re on.
Refresh the check
Click the refresh icon to re-run the health check immediately. Use this to confirm a fix worked, or to get an updated status without waiting for the next page refresh.
Manage preference for health checks
Click the Manage assistant preferences link to open the Manage app tab. Here you can control how the health check behaves within Kubernetes Monitoring.
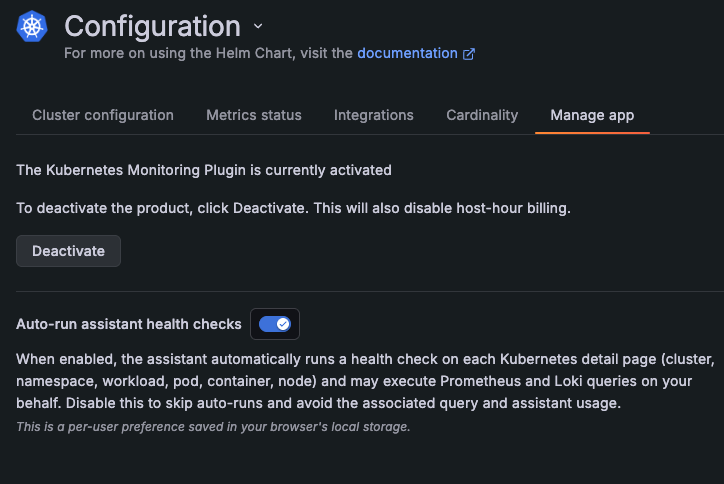
The Auto-run assistant health checks toggle in Configuration > Manage app controls whether the health check runs automatically on every Kubernetes detail page.
- When the toggle is on, the Assistant health check executes Prometheus and Loki queries in the background on every Cluster, namespace, workload, Pod, container, and Node detail page, then displays the banner.
- When the toggle is off, the check doesn’t run automatically. You can still refresh it manually or open Grafana Assistant from a panel to ask about a page.
You may want to turn off the auto-run health check to reduce background query load and Assistant usage, or if you prefer to control when a health check is run.
The preference is saved in your browser’s local storage, so it’s a per-user, per-browser preference. This doesn’t affect teammates or other browsers.
Was this page helpful?
Related resources from Grafana Labs



