
 Grafana Cloud
Observe and act
Monitor infrastructure
Kubernetes Monitoring
Triage your infrastructure
Troubleshoot with built-in tools
Grafana Cloud
Observe and act
Monitor infrastructure
Kubernetes Monitoring
Triage your infrastructure
Troubleshoot with built-in toolsTroubleshoot with built-in tools
Kubernetes Monitoring includes built-in tools to help you investigate issues without leaving the app. Use Grafana Assistant for in-context help, view logs and events from any detail page, profile workloads to find expensive code paths, and jump into root cause analysis, Application Observability, Explore, traces, or your Cloud provider when you need to go deeper.
Use Grafana Assistant
Click on the Grafana Assistant icon in any panel that contains it to learn more about the panel. This feature opens the Assistant window where you can ask additional questions about the panel itself or your data displayed in the panel.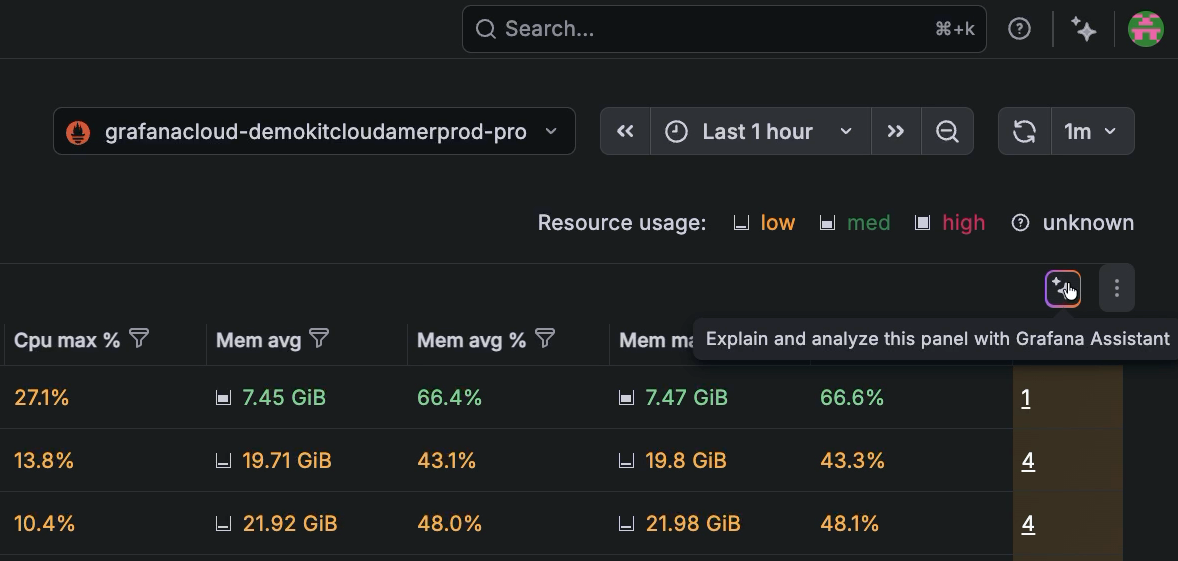
Wherever you open Grafana Assistant in Kubernetes Monitoring, it receives the context of the page you’re on. This includes:
- The page you’re viewing, such as the Nodes list or a workload detail page
- The object you have open, such as the Cluster, namespace, workload, Pod, container, or Node
- The filters you’ve applied
- The time range shown on the page
- The Prometheus and Loki data sources that Kubernetes Monitoring queries
Because of this, you can ask about a Pod that’s restarting without naming the Pod, its namespace, or the time range you’re looking at.
The Assistant also runs an automatic health check at the top of every Kubernetes detail page. Refer to Use Assistant health checks.
View logs and events
Logs Drilldown is embedded within Kubernetes Monitoring. Instead of going through logs for every Pod, you start with a service (the logical unit your team owns). Logs Drilldown aggregates logs for that service so you can immediately spot whether the problem is one Pod or the whole service. That tells you whether to fix a Pod or the infrastructure.
From Cluster to container, you can click on the Logs or Events tab of any detail page to analyze logs without writing complex queries. For more information, refer to Labels and Fields and Log Patterns.
With Grafana Play, you can explore and see how it works, learning from practical examples to accelerate your development. This feature can be seen on the Logs tab of this namespace details page.
Profile applications with continuous profiling
When a workload or Pod shows high CPU or memory usage, it’s common to ask which part of the code is responsible. Profiling captures which applications in your code are responsible for that resource usage. Kubernetes Monitoring integrates Continuous profiling directly into the detail pages for Workload and Pod. You can investigate performance issues related to applications and determine the cause.
Profiling section
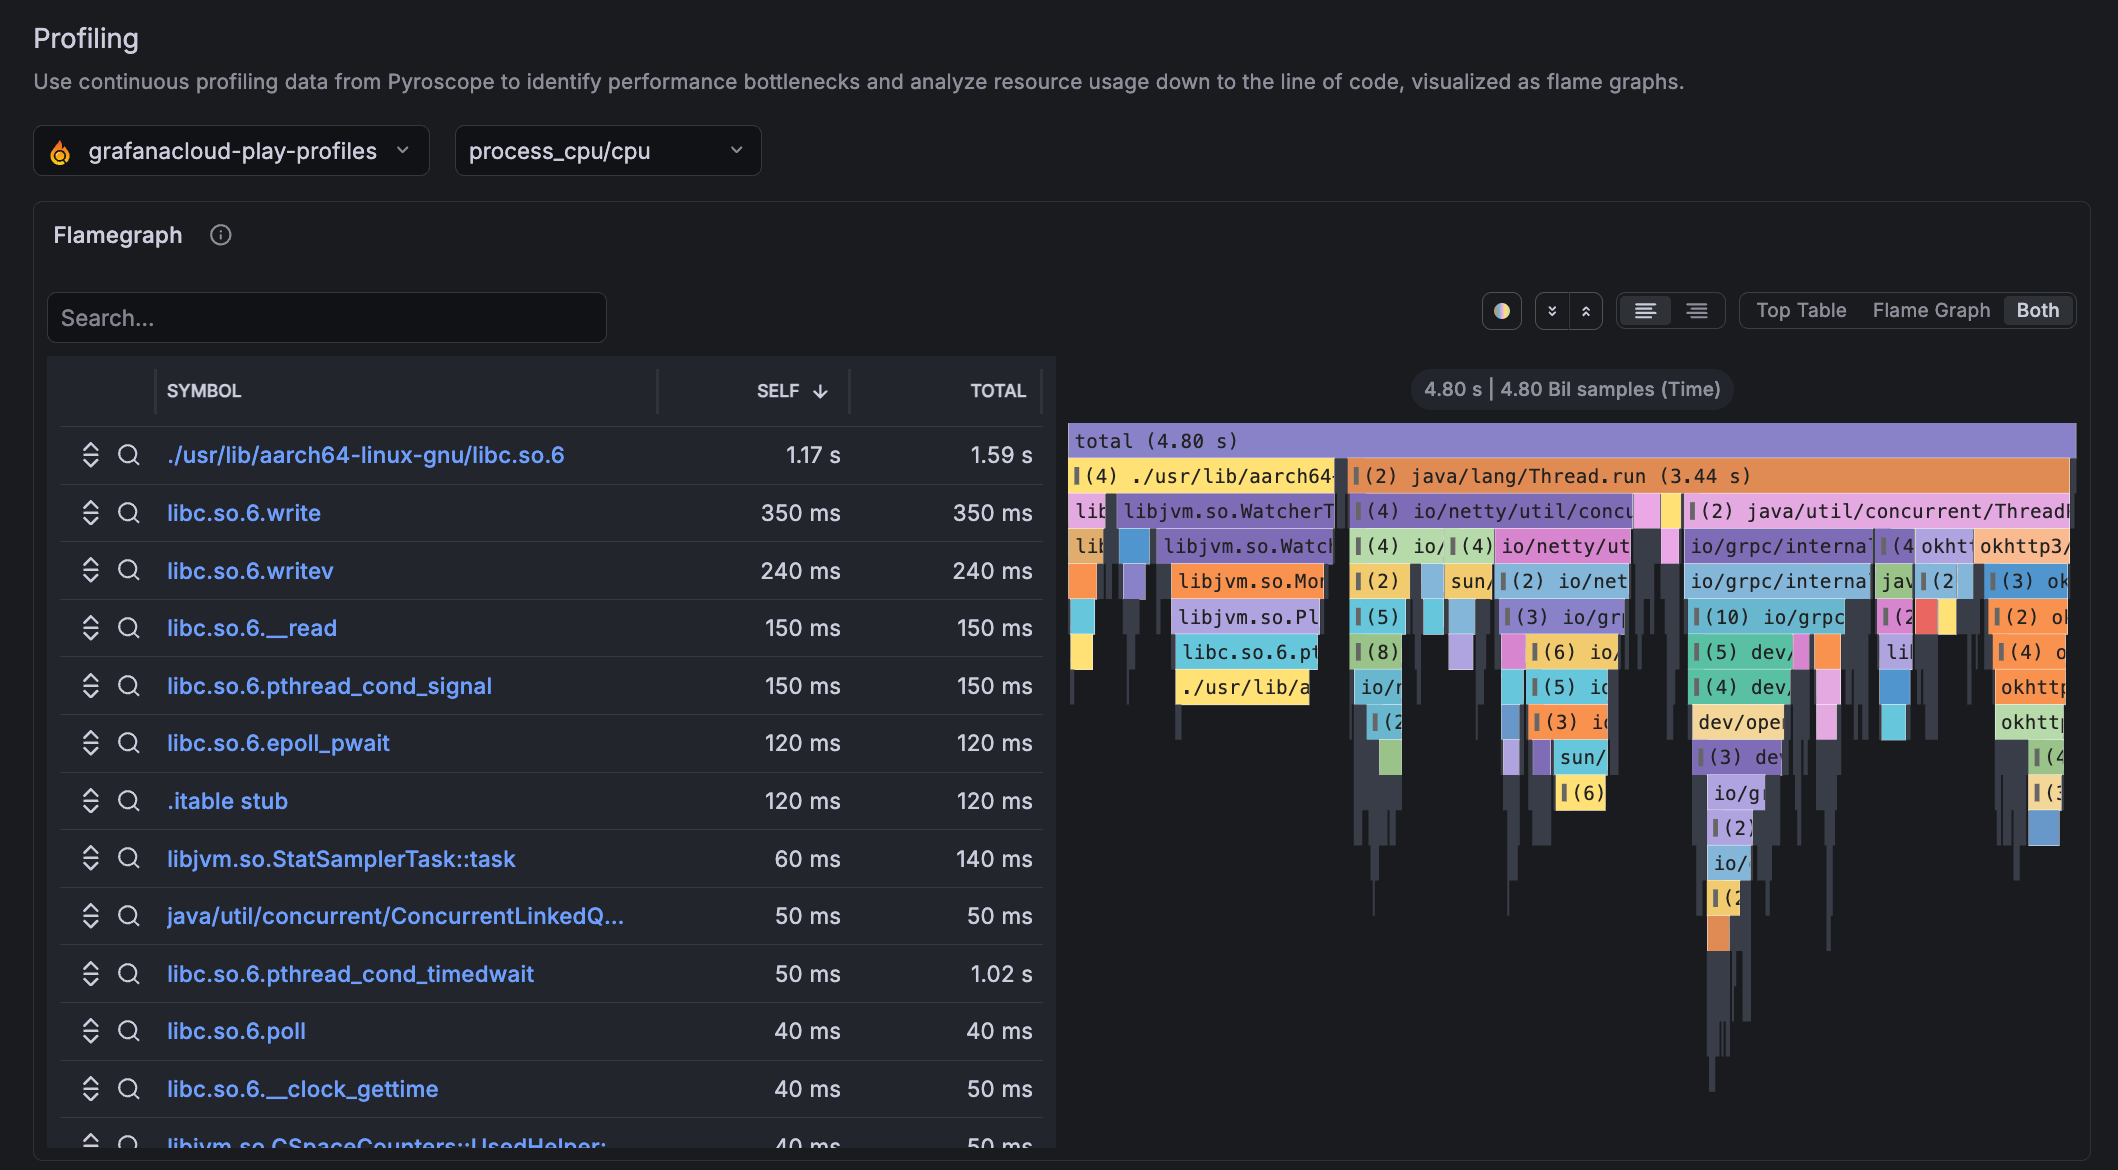
The Profiling section of Workload and Pod detail pages displays a flame graph that shows which applications in your code are consuming the most CPU or memory. A flame graph visualizes this data as stacked bars. Each bar represents a function.
The width of each bar shows how much time or resources that function consumed. Wider bars point to the code paths that are worth your time to optimize.
Data used by flame graphs
Profiling data requires instrumentation on the application side. The flame graph works with the Pyroscope instance in Grafana Cloud. To see profiling data, one of the following ingestion methods must be used for profiling data to appear:
Configure using the Kubernetes Monitoring Helm chart. This chart directs Alloy to collect profiles in the Cluster using eBPF. No application code changes are required. You can also add annotations to your Pods and Alloy to scrape pprof endpoints automatically. These two options differ in which collection layer they use: pprof is a pull-over-HTTP model; eBPF is a kernel hook model.
Refer to Customize the Helm chart configuration for setup steps.
Pyroscope SDKs. Applications push profiles directly to Grafana Cloud Pyroscope. SDKs are available for Go, Java, Python, .NET, Ruby, Node.js, and Rust.
Refer to Send profile data for setup steps.
Troubleshoot missing profiles
The Profiles section appears on all Workload and Pod detail pages but displays “No profiling data available” if there is no profiling data in Pyroscope. If you see missing or unexpected profile data, refer to Troubleshooting.
Resolve issues with built-in tools
Navigate from Kubernetes Monitoring to other capabilities in Grafana Cloud to analyze, troubleshoot, and solve issues.
Access root cause analysis tool
Note
To access root cause analysis tools, enable Knowledge Graph on your stack. If Knowledge Graph is not enabled, Kubernetes Monitoring displays a banner with a link to enable it.
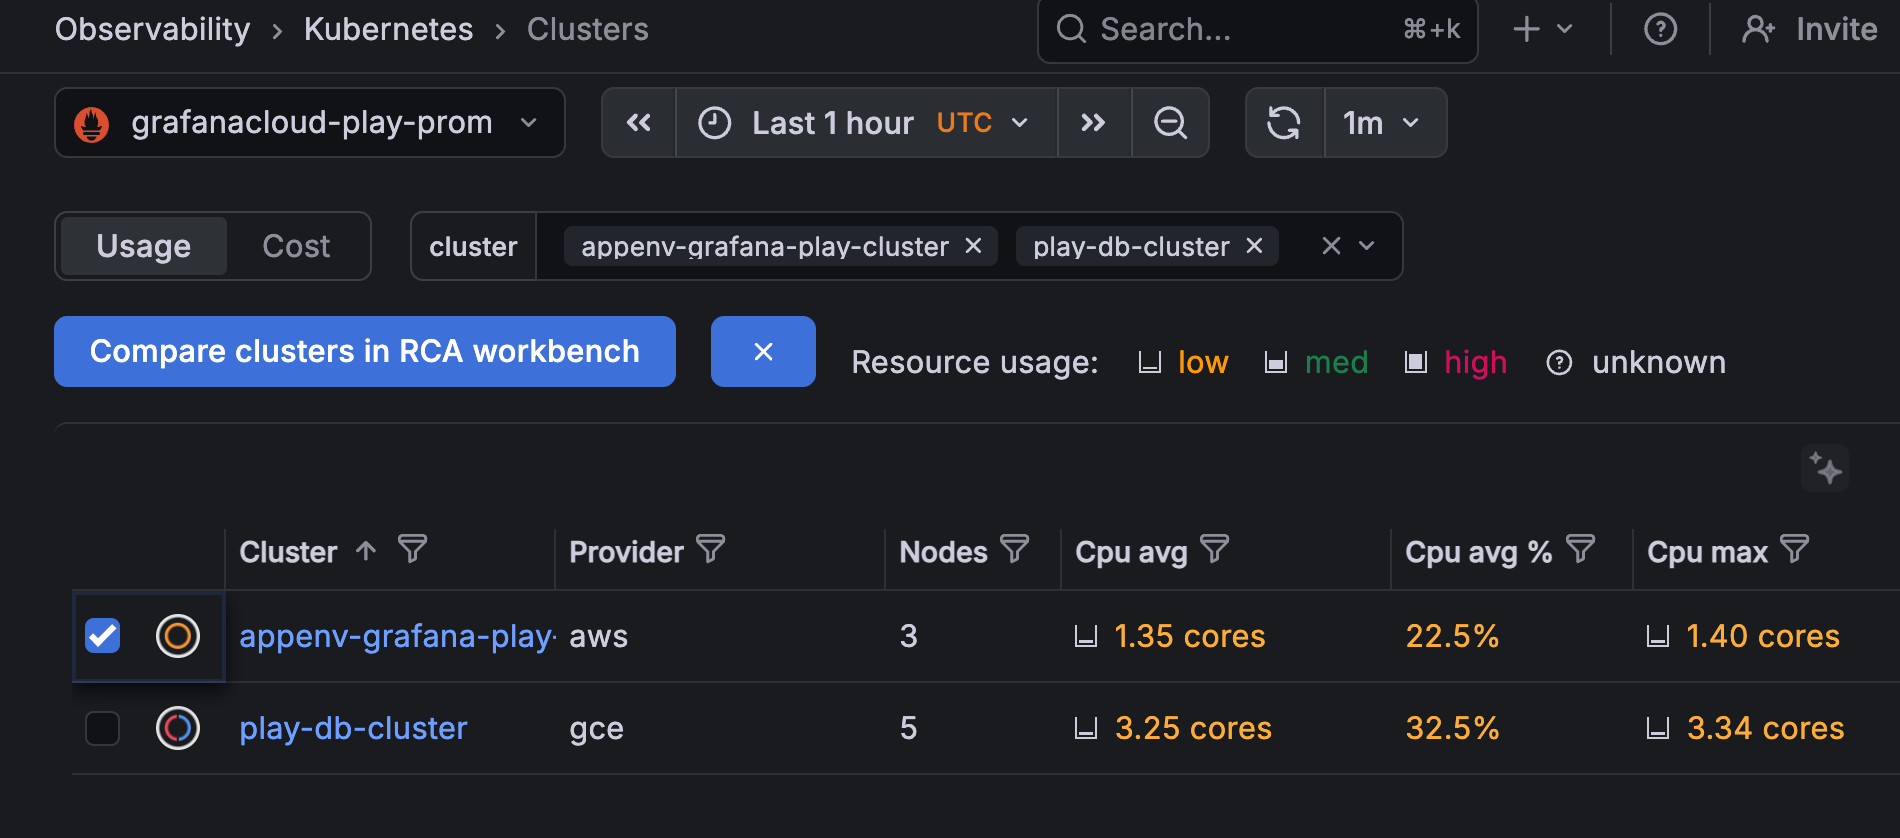
Access RCA workbench by any of these methods:
- Hover over RCA workbench button on the upper right of the screen, and click Open RCA workbench.

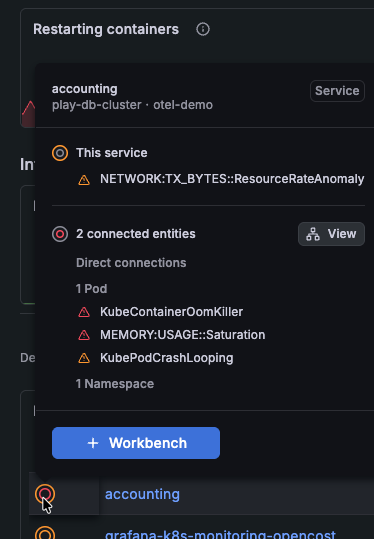
Hovering to reveal the Open RCA Workbench button - Hover over the ring icon, and click + Workbench.

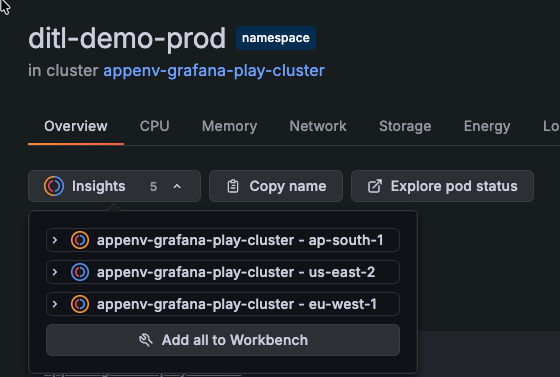
Hovering over the ring icon - Click the Insights button, then click Add all to Workbench.

Insights button
View insights on optimization panels
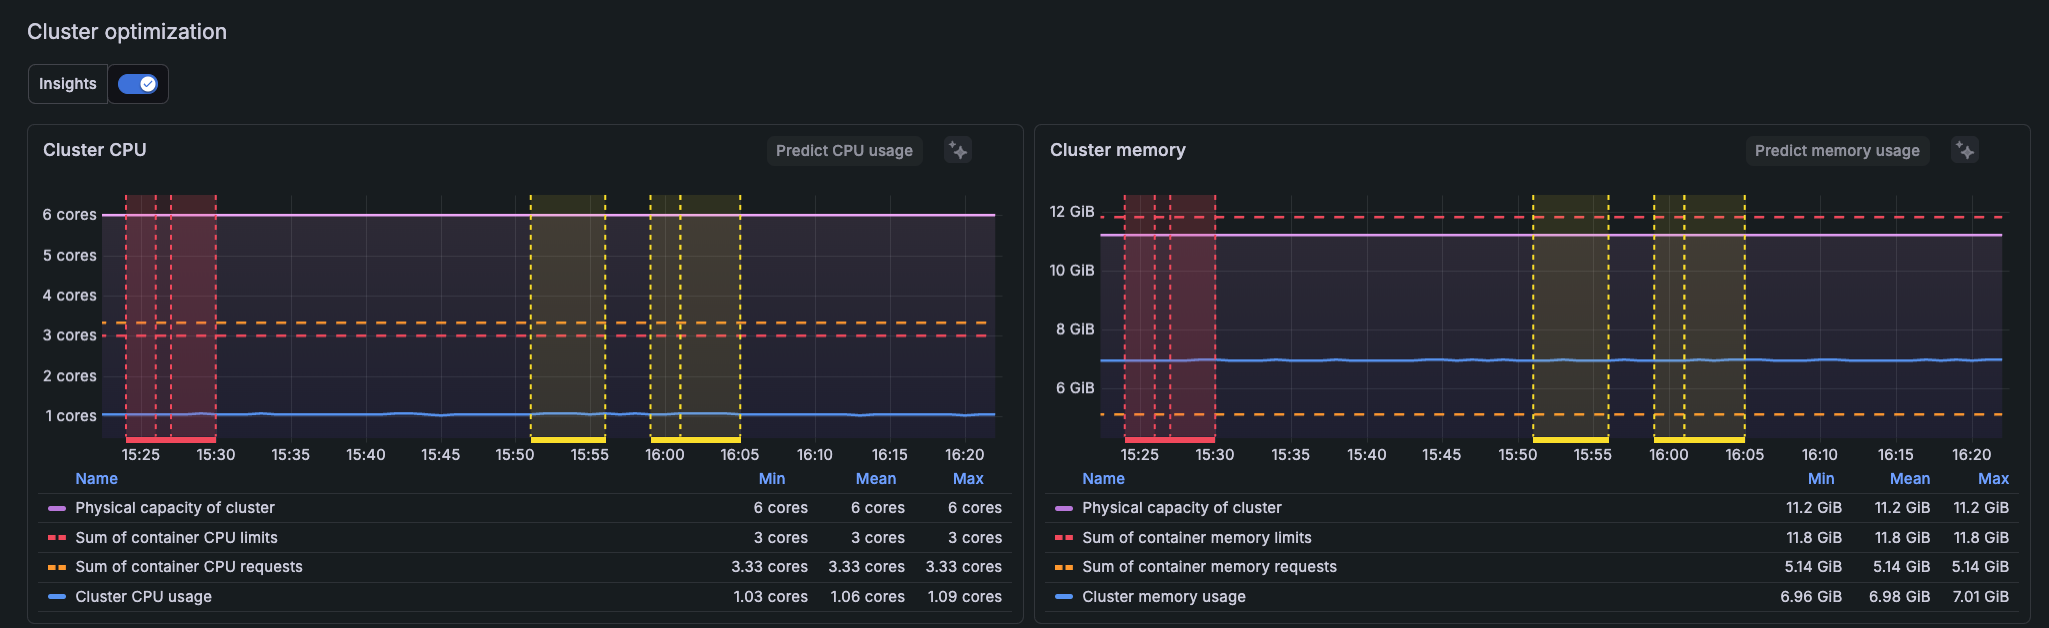
When you investigate a resource problem, you often need to know not just what usage looked like, but when it became a concern. Instead of reading the graph and guessing where the trouble started, you can view the optimization section of any detail page (other than the container page). Switch on the Insights toggle to see highlights annotated on the graph that mark saturation insights on the resource.
A yellow highlight means usage approaches the configured threshold. Red means a critical insight, where usage meets or exceeds the critical threshold. You can use these highlights to find when CPU or memory was under pressure, and then click Predict CPU or Predict Mem Usage to see a usage forecast.
To navigate to the entity graph or workbench, hover over the bottom line on the graph.
To review or change resource thresholds, refer to Manage thresholds.
Jump to the application layer
On the detail page for a Pod or workload, hover over View application layer, then click Go to Application Observability to navigate directly to more data, such as the service health.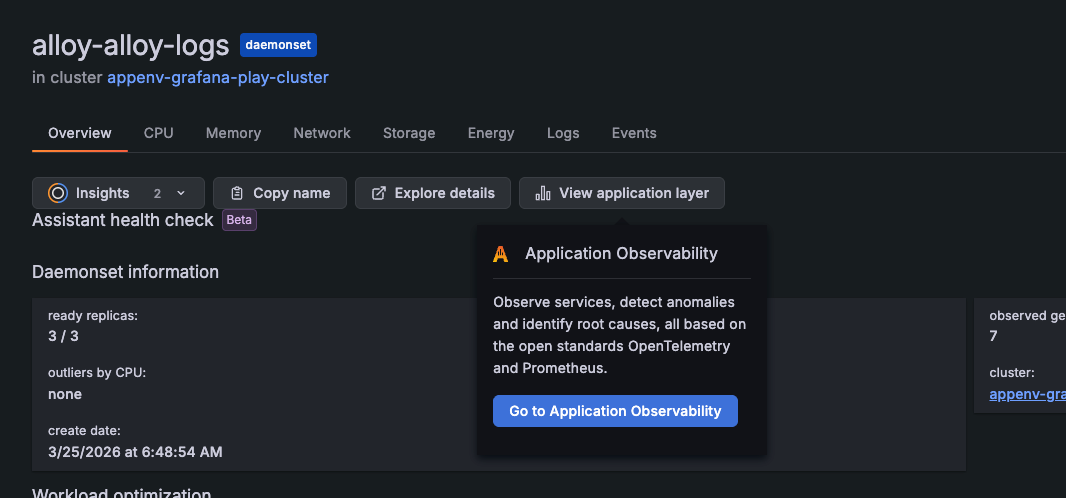
To return to Kubernetes Monitoring, click the browser back button.
View queries to troubleshoot with Explore
To further query data, use any of the Explore buttons available throughout the interface (such as Explore namespaces or Explore alerts). You see a view that provides additional query tools for troubleshooting.
Use debug metrics
For any panel, you can open Debug Metrics to see the metrics used for the panel.
Navigate to traces
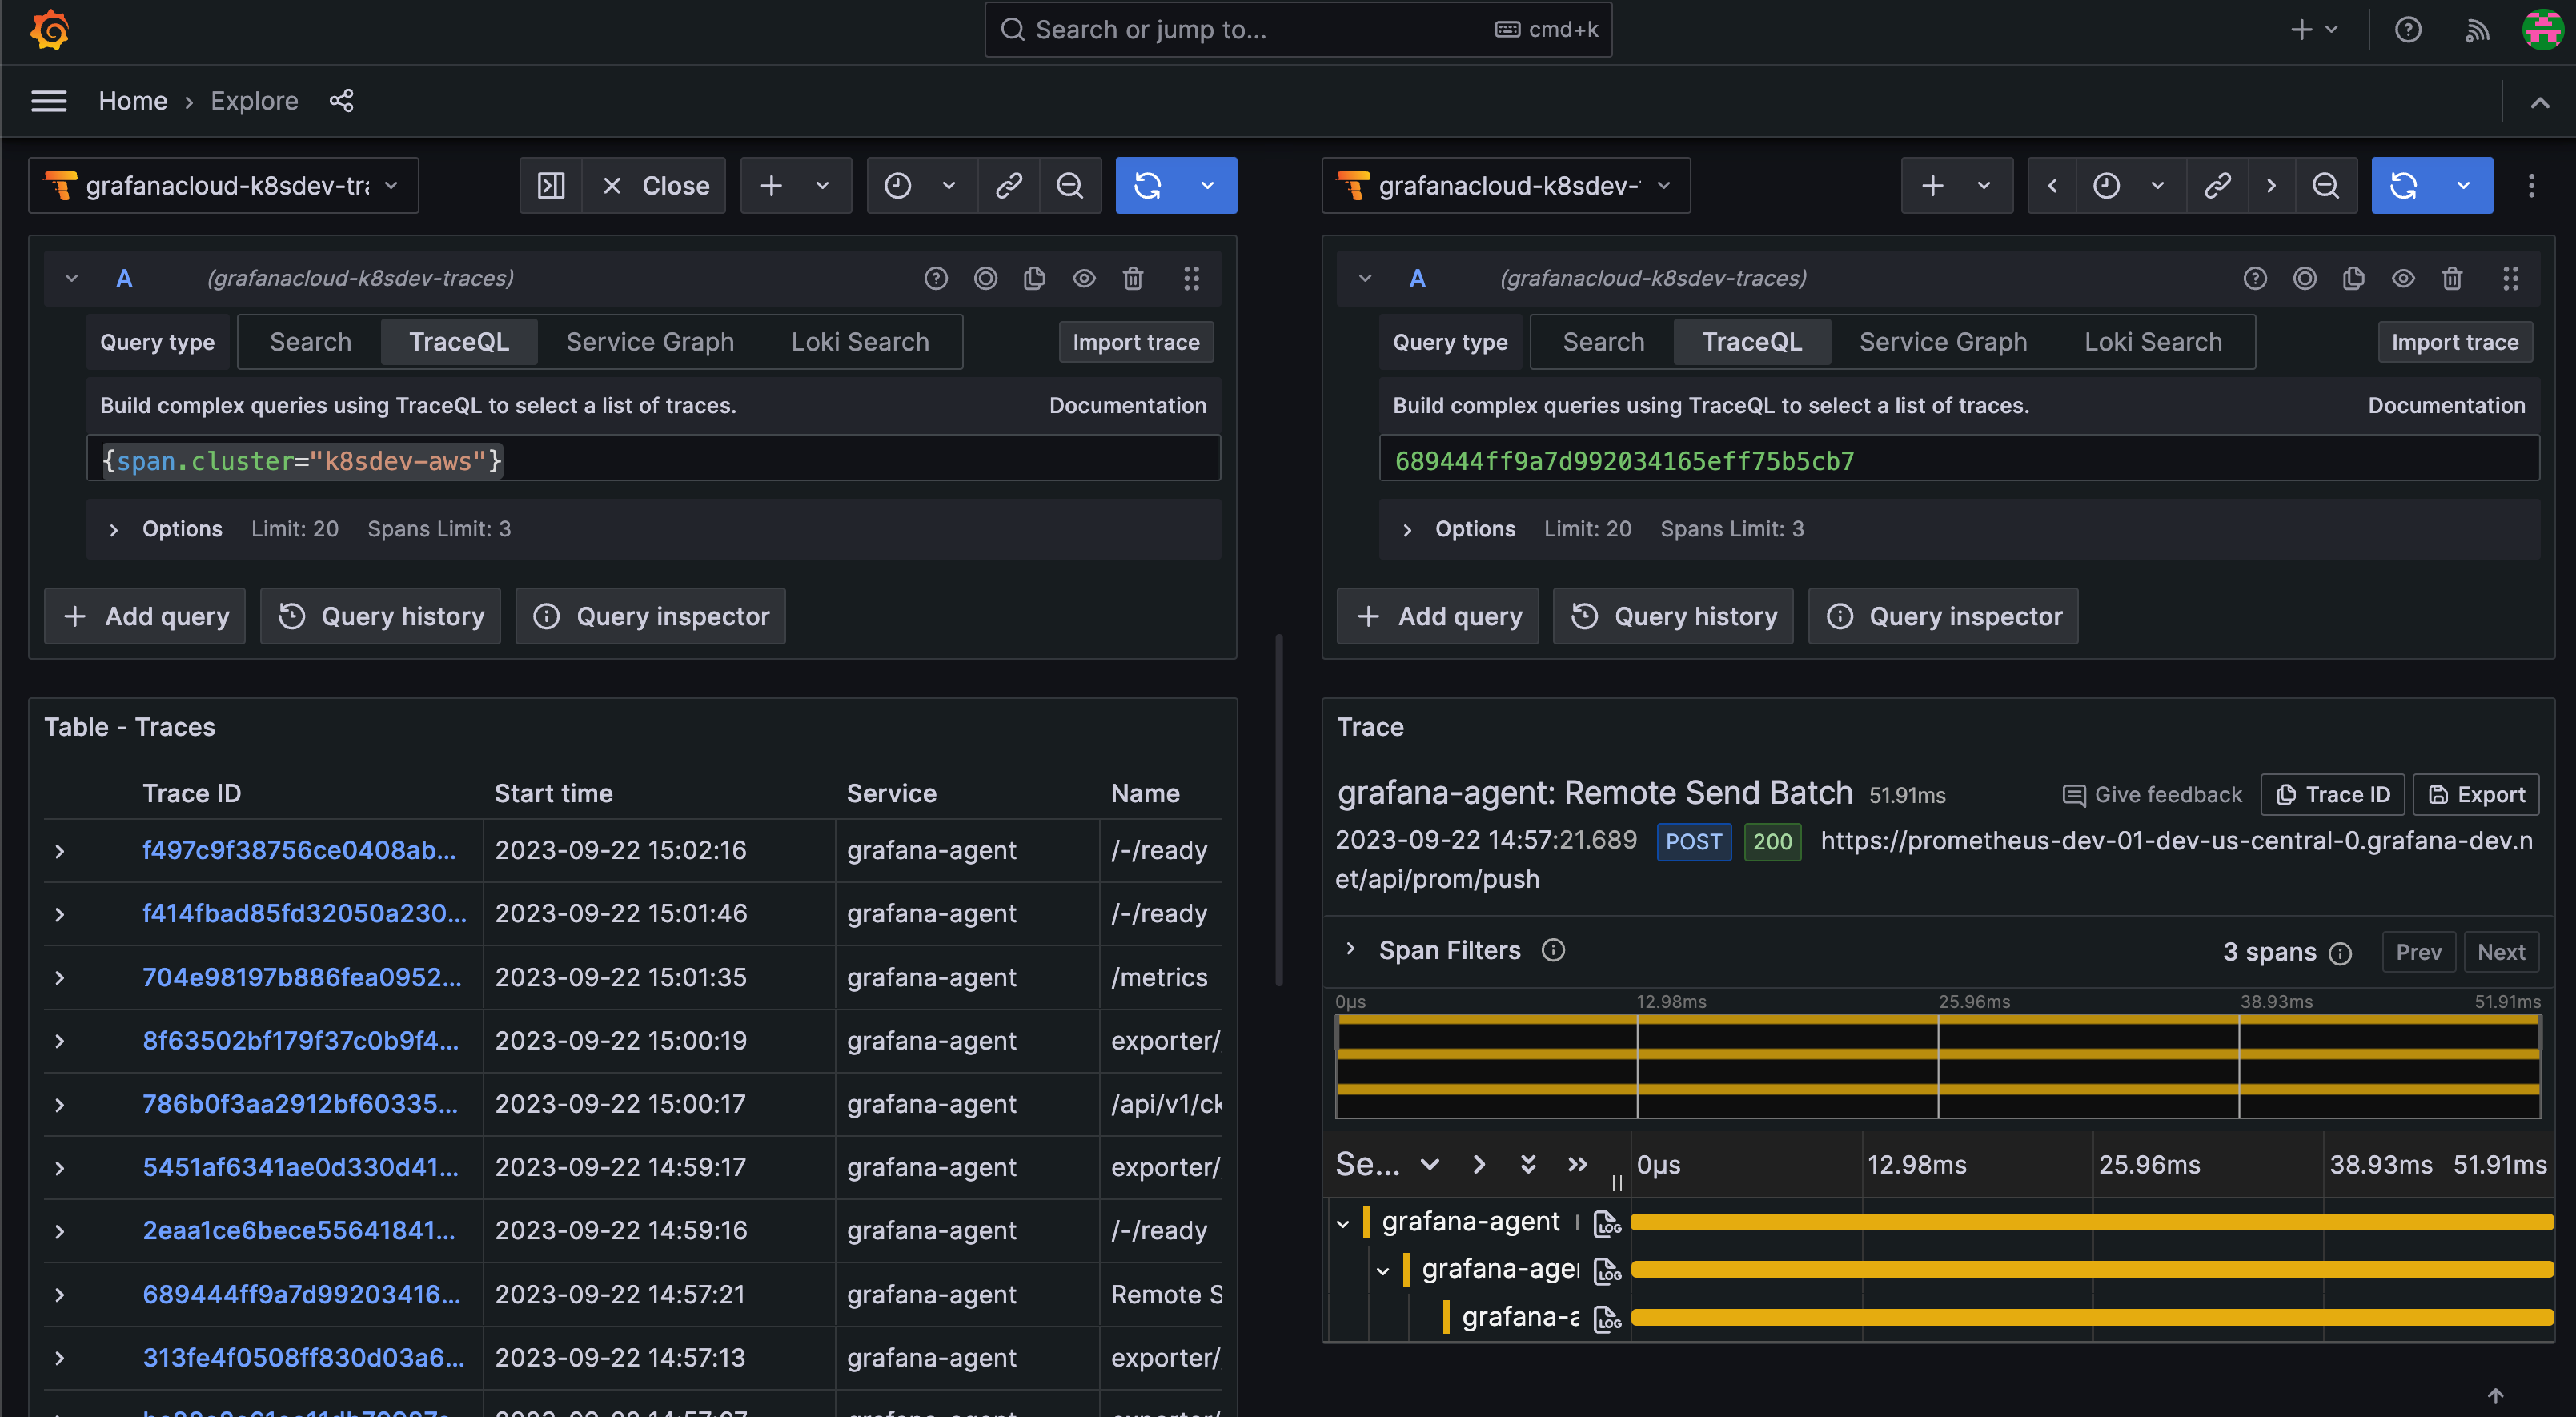
If you choose to enable traces when you configure Kubernetes Monitoring, you can easily click to see them.
Click the main menu icon.
Click Explore.
Choose the Tempo data source.
With the TraceQL tab selected, enter your search query.
Click Run query.
A table of traces appears.
Click a trace to see the detail.
Note
If you use Istio service mesh and traces don’t appear, check how the Kubernetes Service exposes the gRPC endpoint. Istio identifies a port as gRPC when the port sets
appProtocol: grpc, or when the port name (spec.ports[].name) isgrpcor starts withgrpc-. If both are set,appProtocoltakes precedence. Helm chart v4 setsappProtocol: grpcon the port it creates for the OTLP gRPC receiver, so check this only if you define your own receiver ports. For more information, refer to Traces missing with Istio service mesh.
Access Nodes in Cloud provider accounts
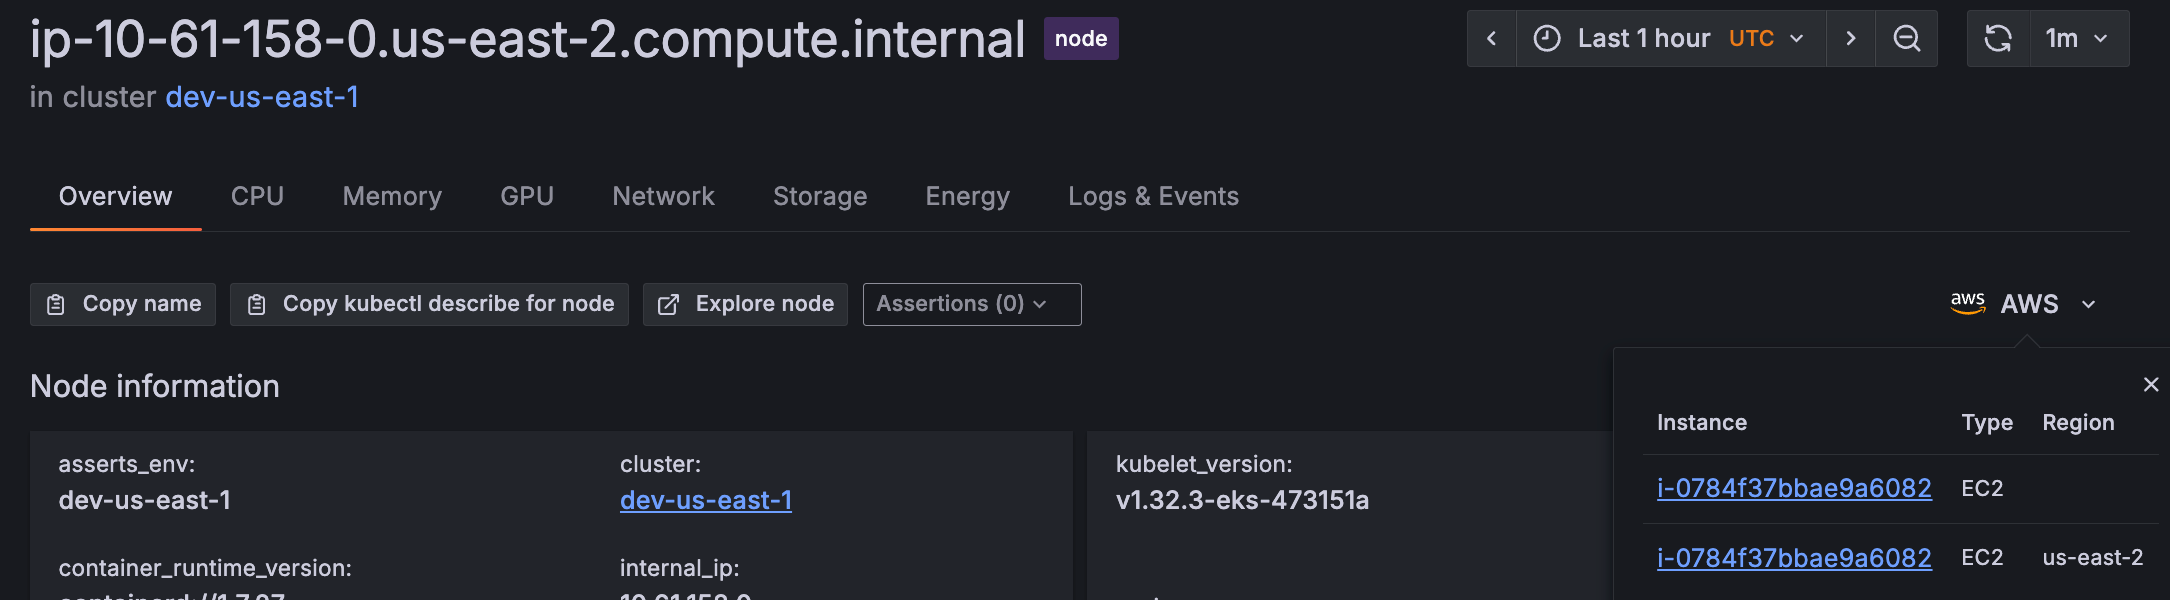
You can navigate to the EC2 dashboard for Nodes managed by AWS from Kubernetes Monitoring. For example:
- Find the EC2 Node by going to Search and searching for the Node name.
- In the search results, click the Node name to open the Node detail page.
- On the far right-side of the screen, open the AWS drop-down to see the link to the EC2 instance.

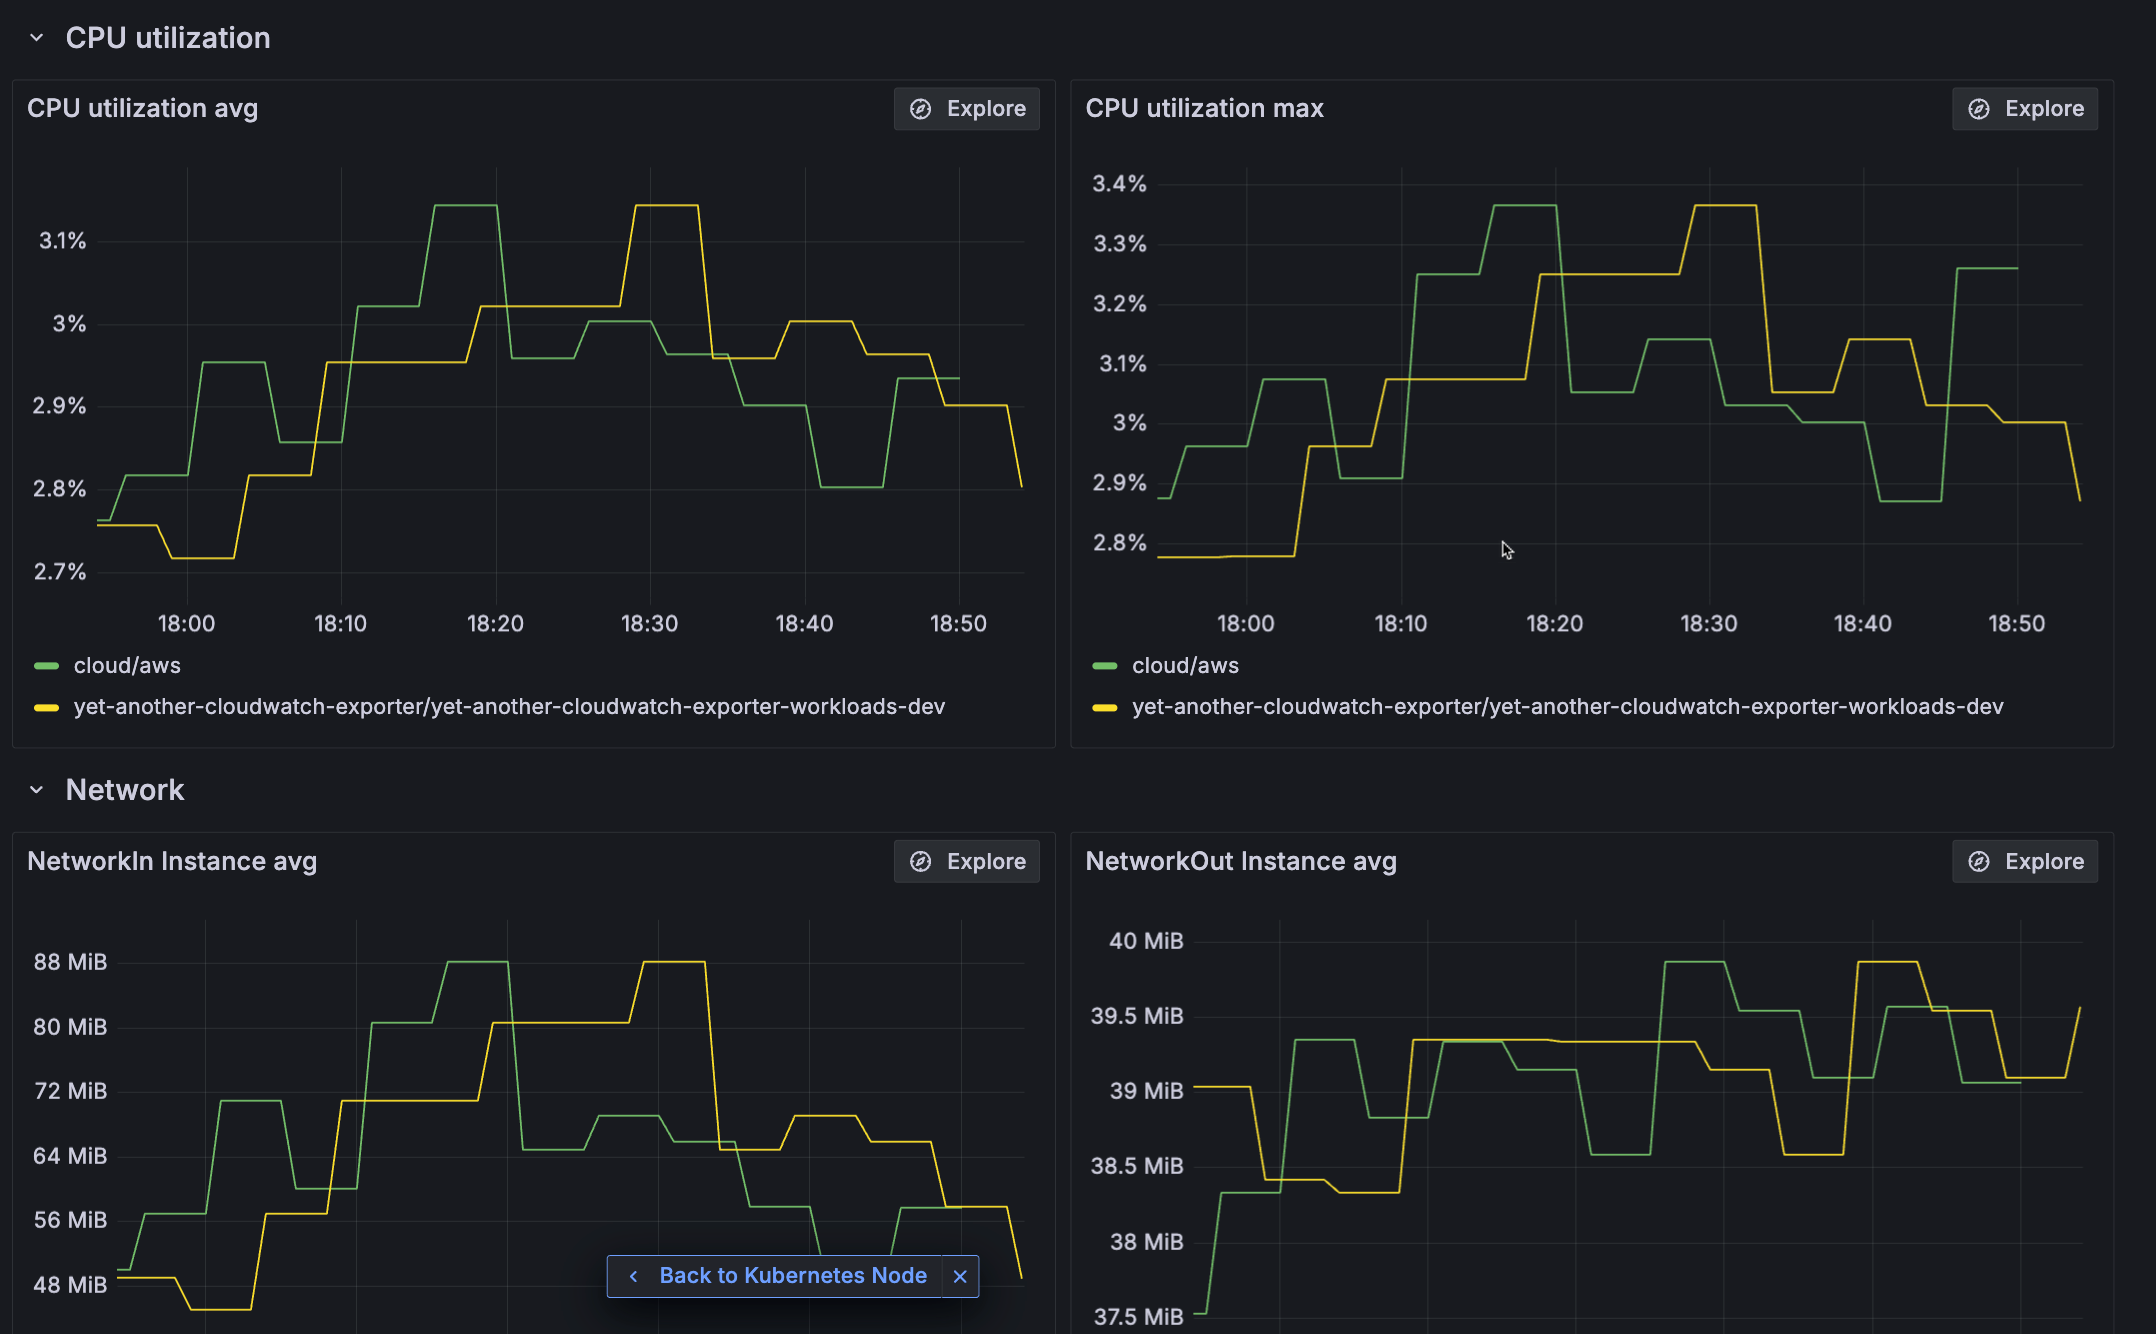
AWS drop-down menu - Click the instance link to open the EC2 overview. Here you can find AWS-specific metadata and other data provided by CloudWatch metrics.

Dashboard for AWS EC2 instance - To return to the Kubernetes Monitoring view of the Node, click Back to Kubernetes Node.
Was this page helpful?
Related resources from Grafana Labs



