
 Grafana Cloud
Observe and act
Monitor infrastructure
Kubernetes Monitoring
Triage your infrastructure
Grafana Cloud
Observe and act
Monitor infrastructure
Kubernetes Monitoring
Triage your infrastructureTriage your infrastructure
The Kubernetes Overview page is where you start when something feels wrong. It’s also where you check to confirm everything is healthy before it becomes a problem. The page refreshes at a 1-minute cadence, so you see near real-time Cluster state.
Get Cluster-wide issues
Use the Overview page to:
- Confirm the scope of an issue before you start triage. Is this one Cluster or many? One namespace or all?
- Spot resource pressure across namespaces before drilling into specific workloads.
- Detect failing or crashlooping Pods without knowing which namespace to look in first.
- Drill into a specific Cluster, namespace, or Deployment from a single starting point.
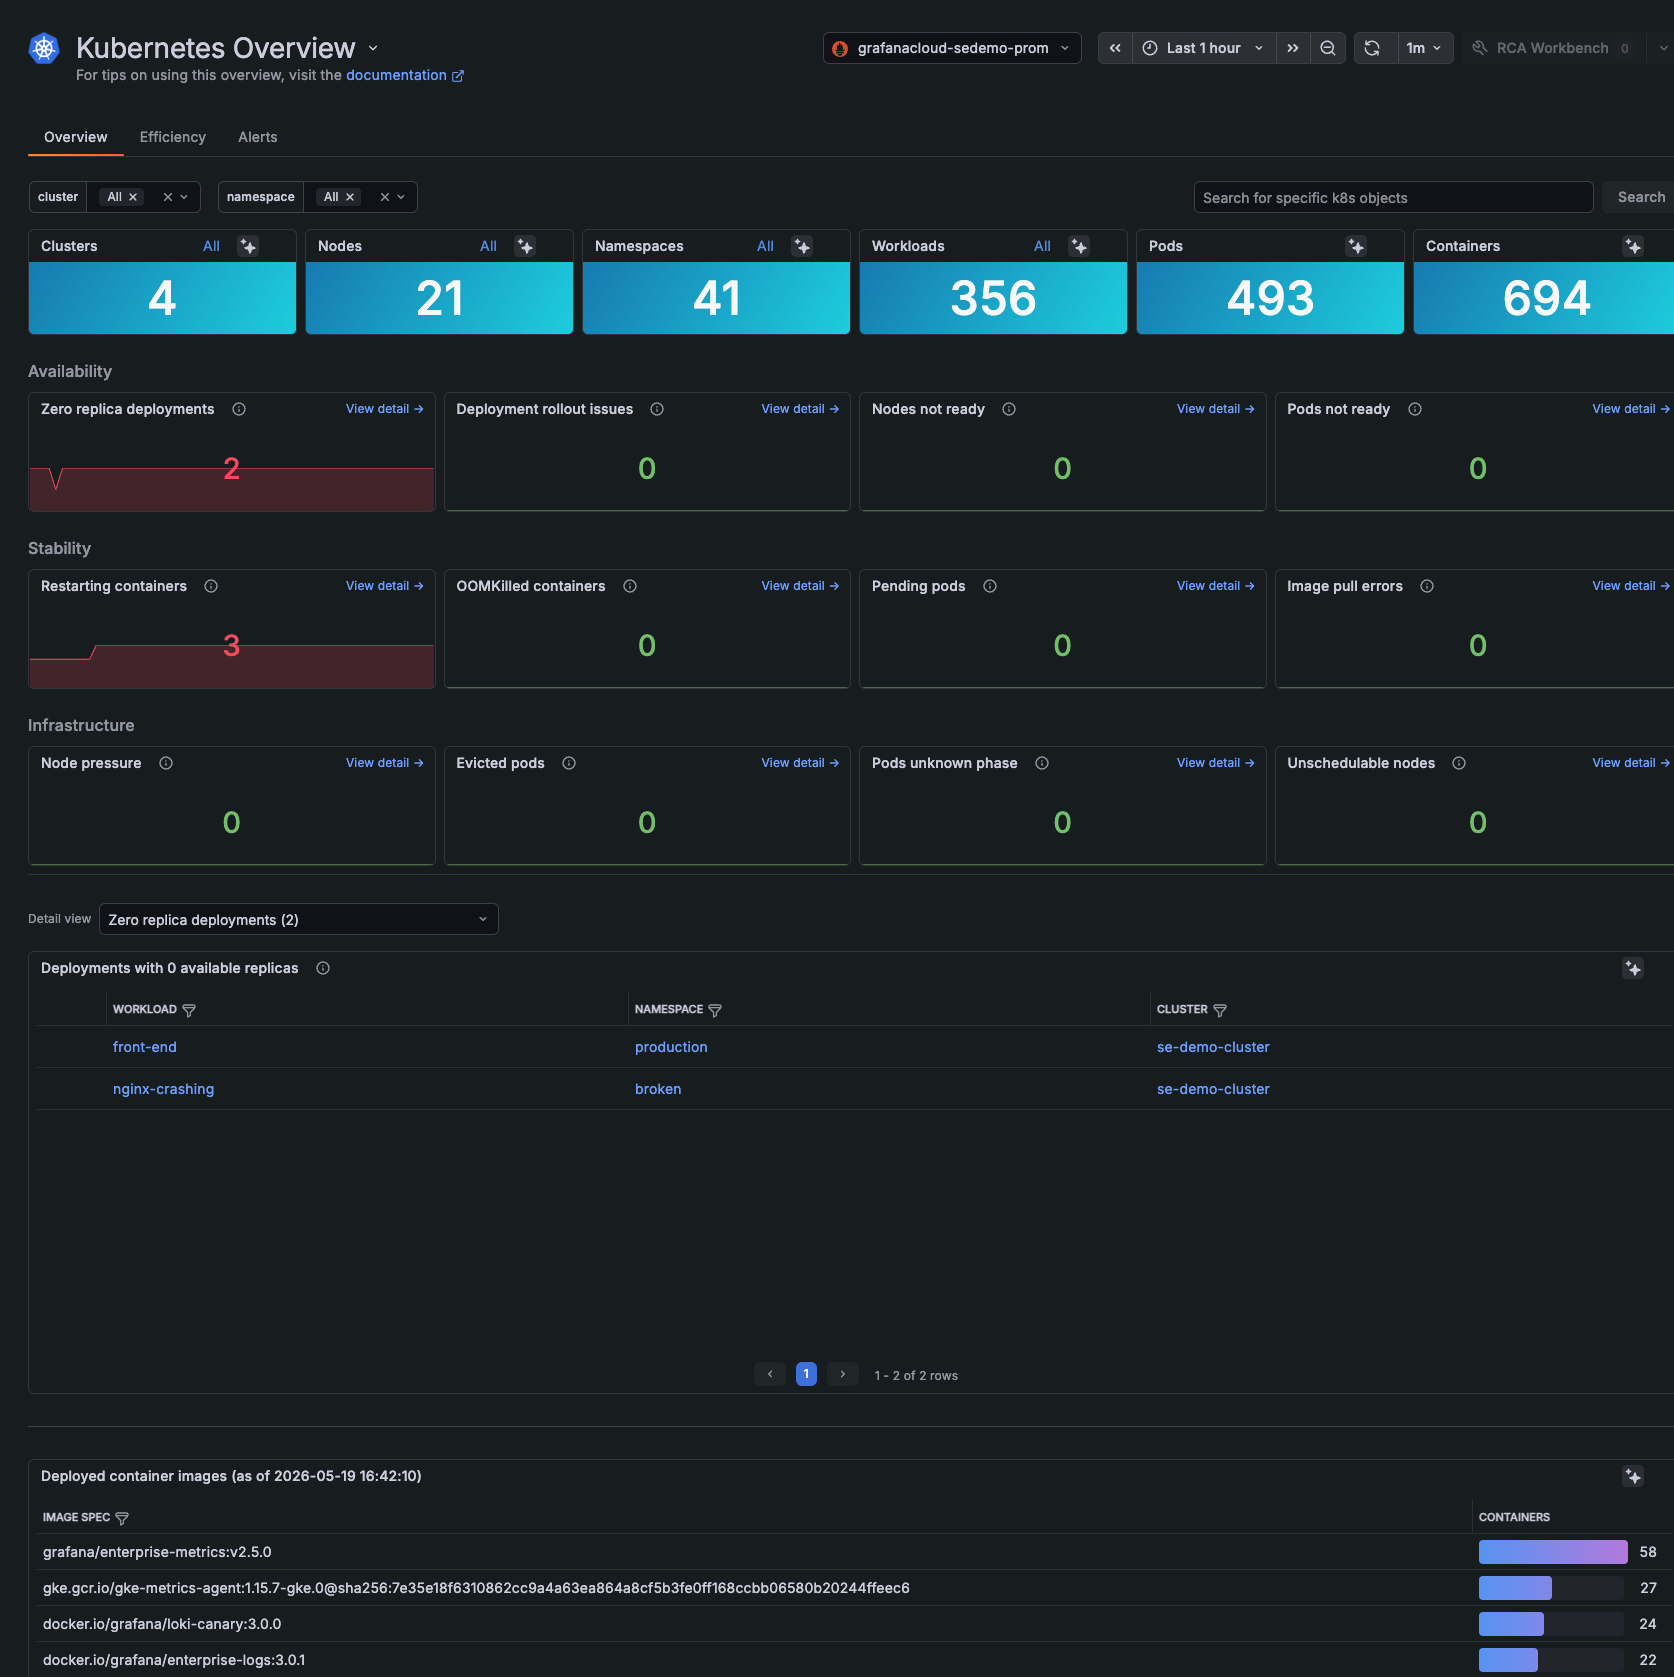
Check fleet counts
The counts at the top of the page answer one question: is everything still there? They don’t tell you what’s wrong, but they show you how many Clusters, Nodes, namespaces, workloads, Pods, and containers are currently being reported, so you can quickly spot when something has dropped off your fleet.
- Clusters confirms your full fleet is reporting. A missing Cluster means an entire region or environment is invisible to monitoring.
- Nodes reflects current Node capacity. Unexpected drops point to Node failures, autoscaler issues, or cloud provider problems. Unexpected jumps may mean runaway scaling and cost.
- namespaces tracks your logical environment boundaries. A missing namespace can mean an environment (such as staging or a tenant) is gone or misconfigured.
- workloads shows the number of deployable applications running across your fleet. An unexpected drop usually means workloads were deleted, scaled away, or stopped reporting. An unexpected jump may signal accidental deployments or runaway automation.
- Pods reflects the running instances powering your workloads. Drops typically mean scale-downs, evictions, or workload failures. Sudden jumps can indicate autoscaling events or unexpected restart loops.
- containers counts the processes inside your Pods, including sidecars and init containers. Drops can mean containers crashed, were OOMKilled, or that a sidecar was removed during a rollout.
Use these counts for incident triage, change validation after upgrades or migrations, capacity planning, and monitoring coverage. If any count drops unexpectedly, that piece of your fleet (a region, a tenant, or an environment) is invisible to monitoring until the count recovers.
You can click any count panel or All to jump to a list of Clusters, Nodes, workspaces, and so on.
Note
The Overview page calculation uses the most recent data point within your selected time range. List pages elsewhere in Kubernetes Monitoring also include objects that are no longer active. That means you may see a discrepancy between the count on the Overview page and the count on a list page.
Check availability
The Availability section answers one question: is your infrastructure currently able to serve user traffic? It flags things that exist on paper but aren’t actually available.
Refer to Manage availability for details on zero replica deployments, deployment rollout issues, nodes not ready, and pods not ready.
Check stability
The Stability section catches workloads that haven’t stopped serving traffic yet but are showing stress that will likely cause outages if you ignore them.
Refer to Manage stability for details on restarting containers, OOMKilled containers, pending Pods, and image pull errors.
Check infrastructure conditions
The Infrastructure section surfaces platform conditions, the layer below your workloads. When this section lights up, workload symptoms in Stability usually follow.
Refer to Review infrastructure conditions for details on node pressure, evicted Pods, Pods in unknown phase, and Nodes that cannot be scheduled.
Use Assistant health checks
Every Kubernetes detail page shows the Assistant health check at the top with a description of issues that Grafana Assistant detected. Use it to catch problems while you navigate to a Cluster, namespace, workload, Pod, container, or Node. Refer to Use Assistant health checks.
Track deployed container images
The Deployed container images panel gives you version control visibility at runtime. Kubernetes hides what’s actually running inside containers, so this panel saves you from inspecting Pods one by one across your fleet to answer “what version are we on?”
Use it for:
- Incident correlation: Quickly answer “did a new image version just roll out?” when something breaks. A bad image tag is one of the most common causes of sudden regressions.
- Drift detection: Confirm all Pods in a workload run the same image version. During rolling updates, some Pods can lag and cause inconsistent behavior.
- Security response: When a CVE is disclosed, identify which Clusters and workloads run a vulnerable image and prioritize patching.
- Rollback validation: After a rollback, confirm the old image is running everywhere, not just in some Pods.
- Audit and compliance: Keep a record of what version ran where and when, useful for change management and post-incident reviews.
Work with usage spikes
The CPU and memory usage panels on any detail page can show usage spikes across your fleet at a glance and let you jump directly to the affected Cluster. To learn more, refer to Find usage spikes for the zoom-and-drill workflow.
Troubleshoot with built-in tools
When triage points to a specific Cluster, workload, or Pod, use the built-in tools to investigate without leaving Kubernetes Monitoring. These include Grafana Assistant, in-context logs and events, continuous profiling, RCA workbench, Application Observability, Explore, traces, and access to Cloud provider Node detail pages.
Refer to Troubleshoot with built-in tools.
Was this page helpful?
Related resources from Grafana Labs



