
 Grafana Cloud
Observe and act
Monitor infrastructure
Kubernetes Monitoring
Optimize resource usage and efficiency
Predict and analyze trends
Grafana Cloud
Observe and act
Monitor infrastructure
Kubernetes Monitoring
Optimize resource usage and efficiency
Predict and analyze trendsPredict and analyze trends
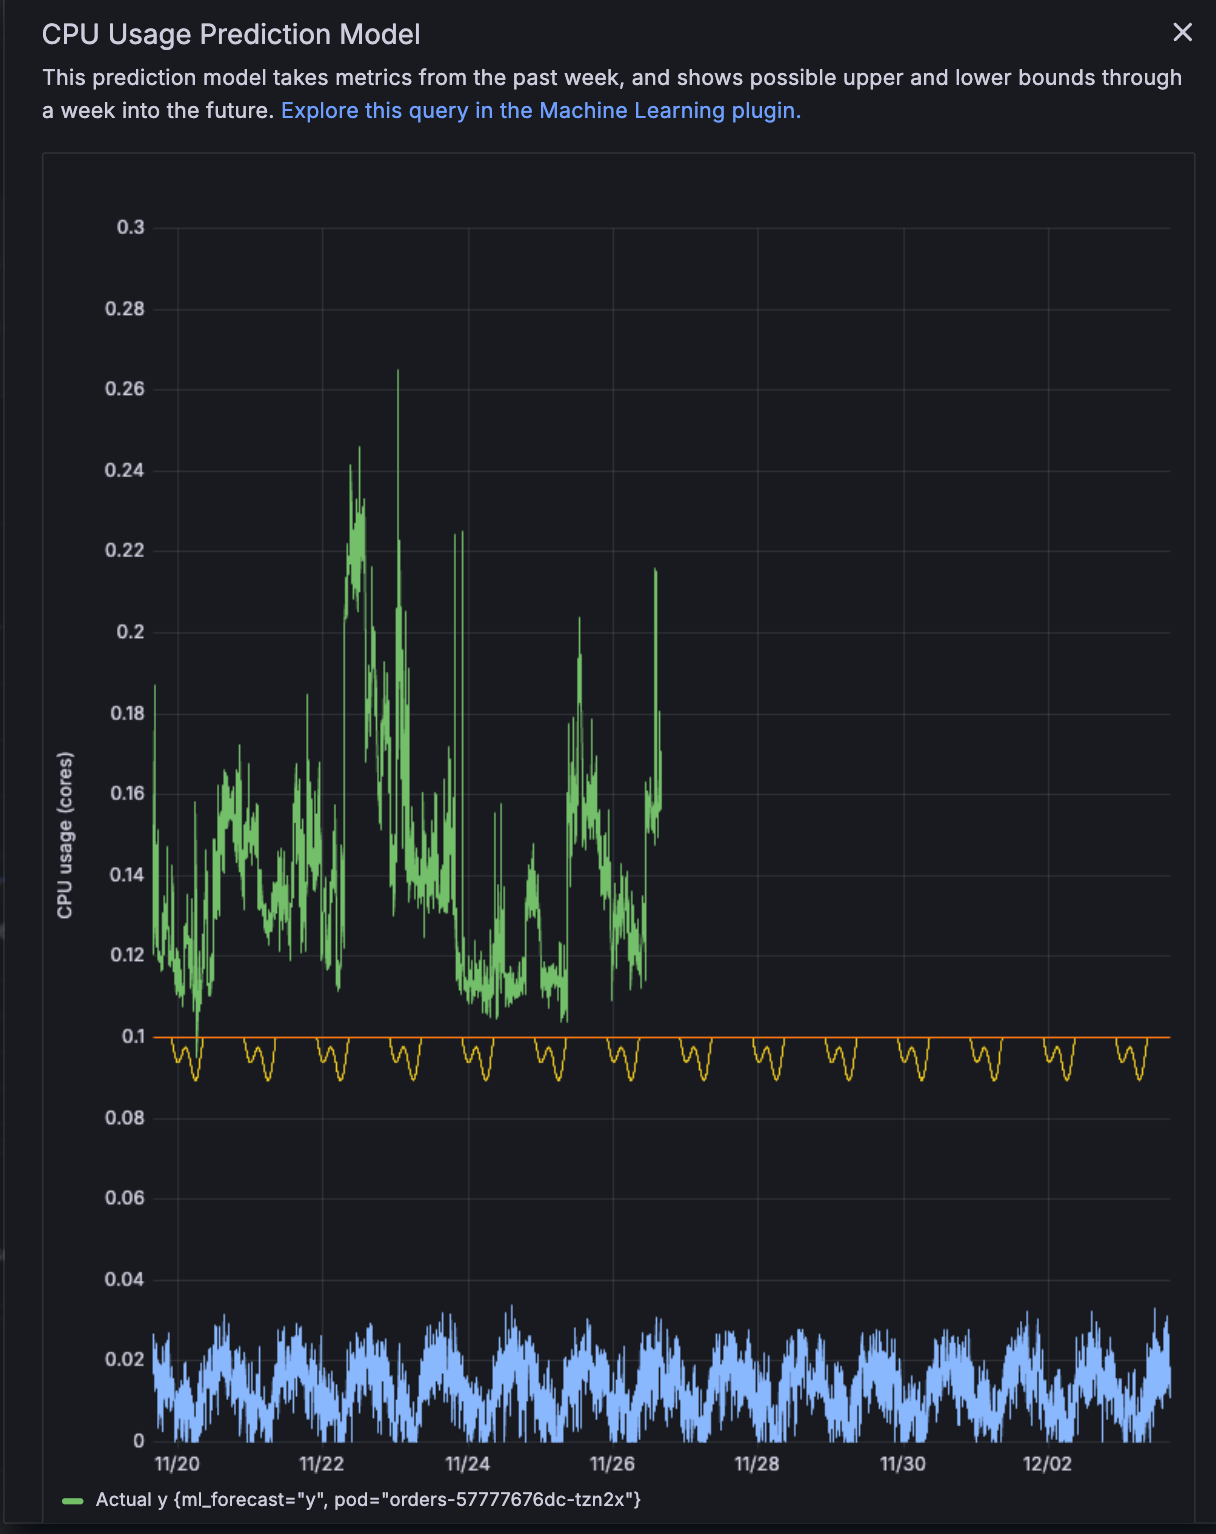
Use the prediction tools to see where CPU and memory usage are likely to be over the next week, based on recent usage. Use the time range selector to look back at past usage and find trends or Kubernetes objects that have been deleted.
Learn what’s predicted
CPU and memory prediction can help you ensure resources are available during spikes in usage, as well as help you decrease the amount of unused resources due to over provisioning. To use prediction tools, first enable the Machine Learning plugin.
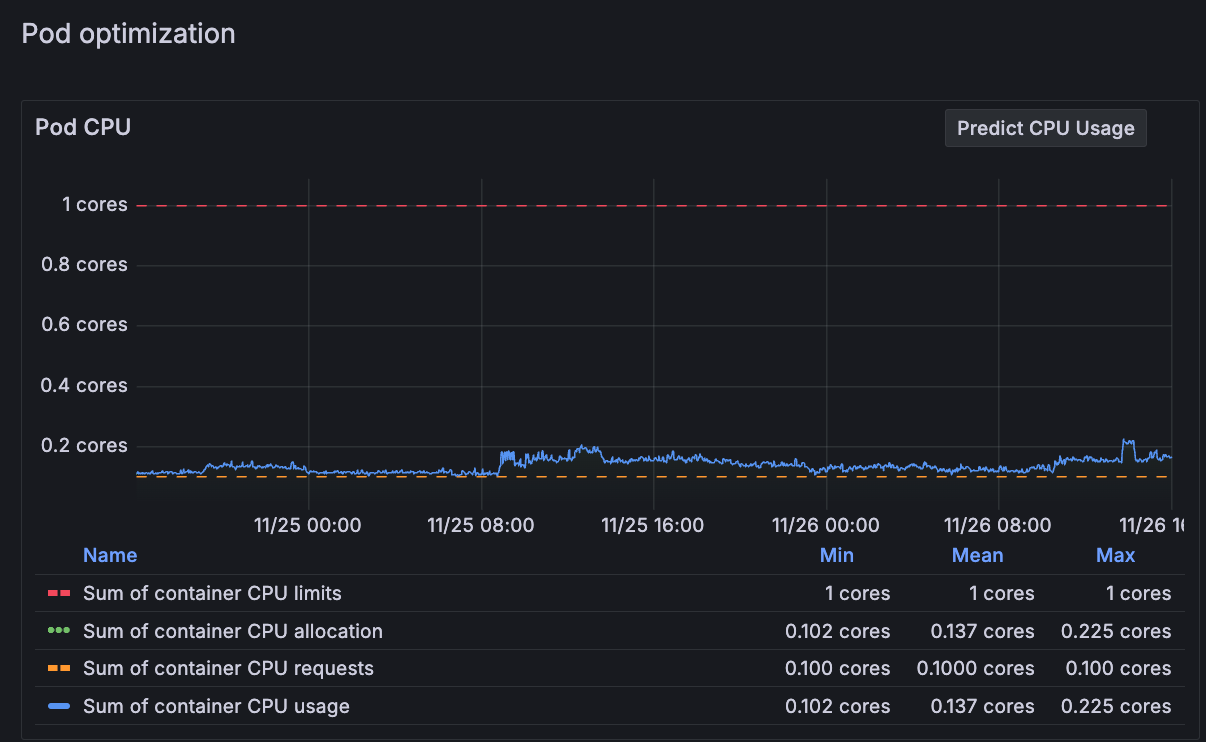
The following buttons are available in various views. Click them to show a prediction for Clusters, namespaces, workloads, Nodes, Pods, and containers. The time range you select must be at least two hours to use these prediction tools:
Predict Mem Usage: Shows a predictive graph for memory usage one week in the future. Calculations are based on metrics from the previous week.
Predict CPU: Shows a predictive graph for CPU usage one week in the future. Calculations are based on metrics from the previous week.
Analyze historical data
Select a time range to see your historical data for any time frame you choose. As you navigate from page to page, the time range remains the same for period you set until you change it again.
As an example, the Pod optimization section of the Pod detail page shows a time range over several hours. You can use this to understand the historical pattern of CPU usage and memory usage.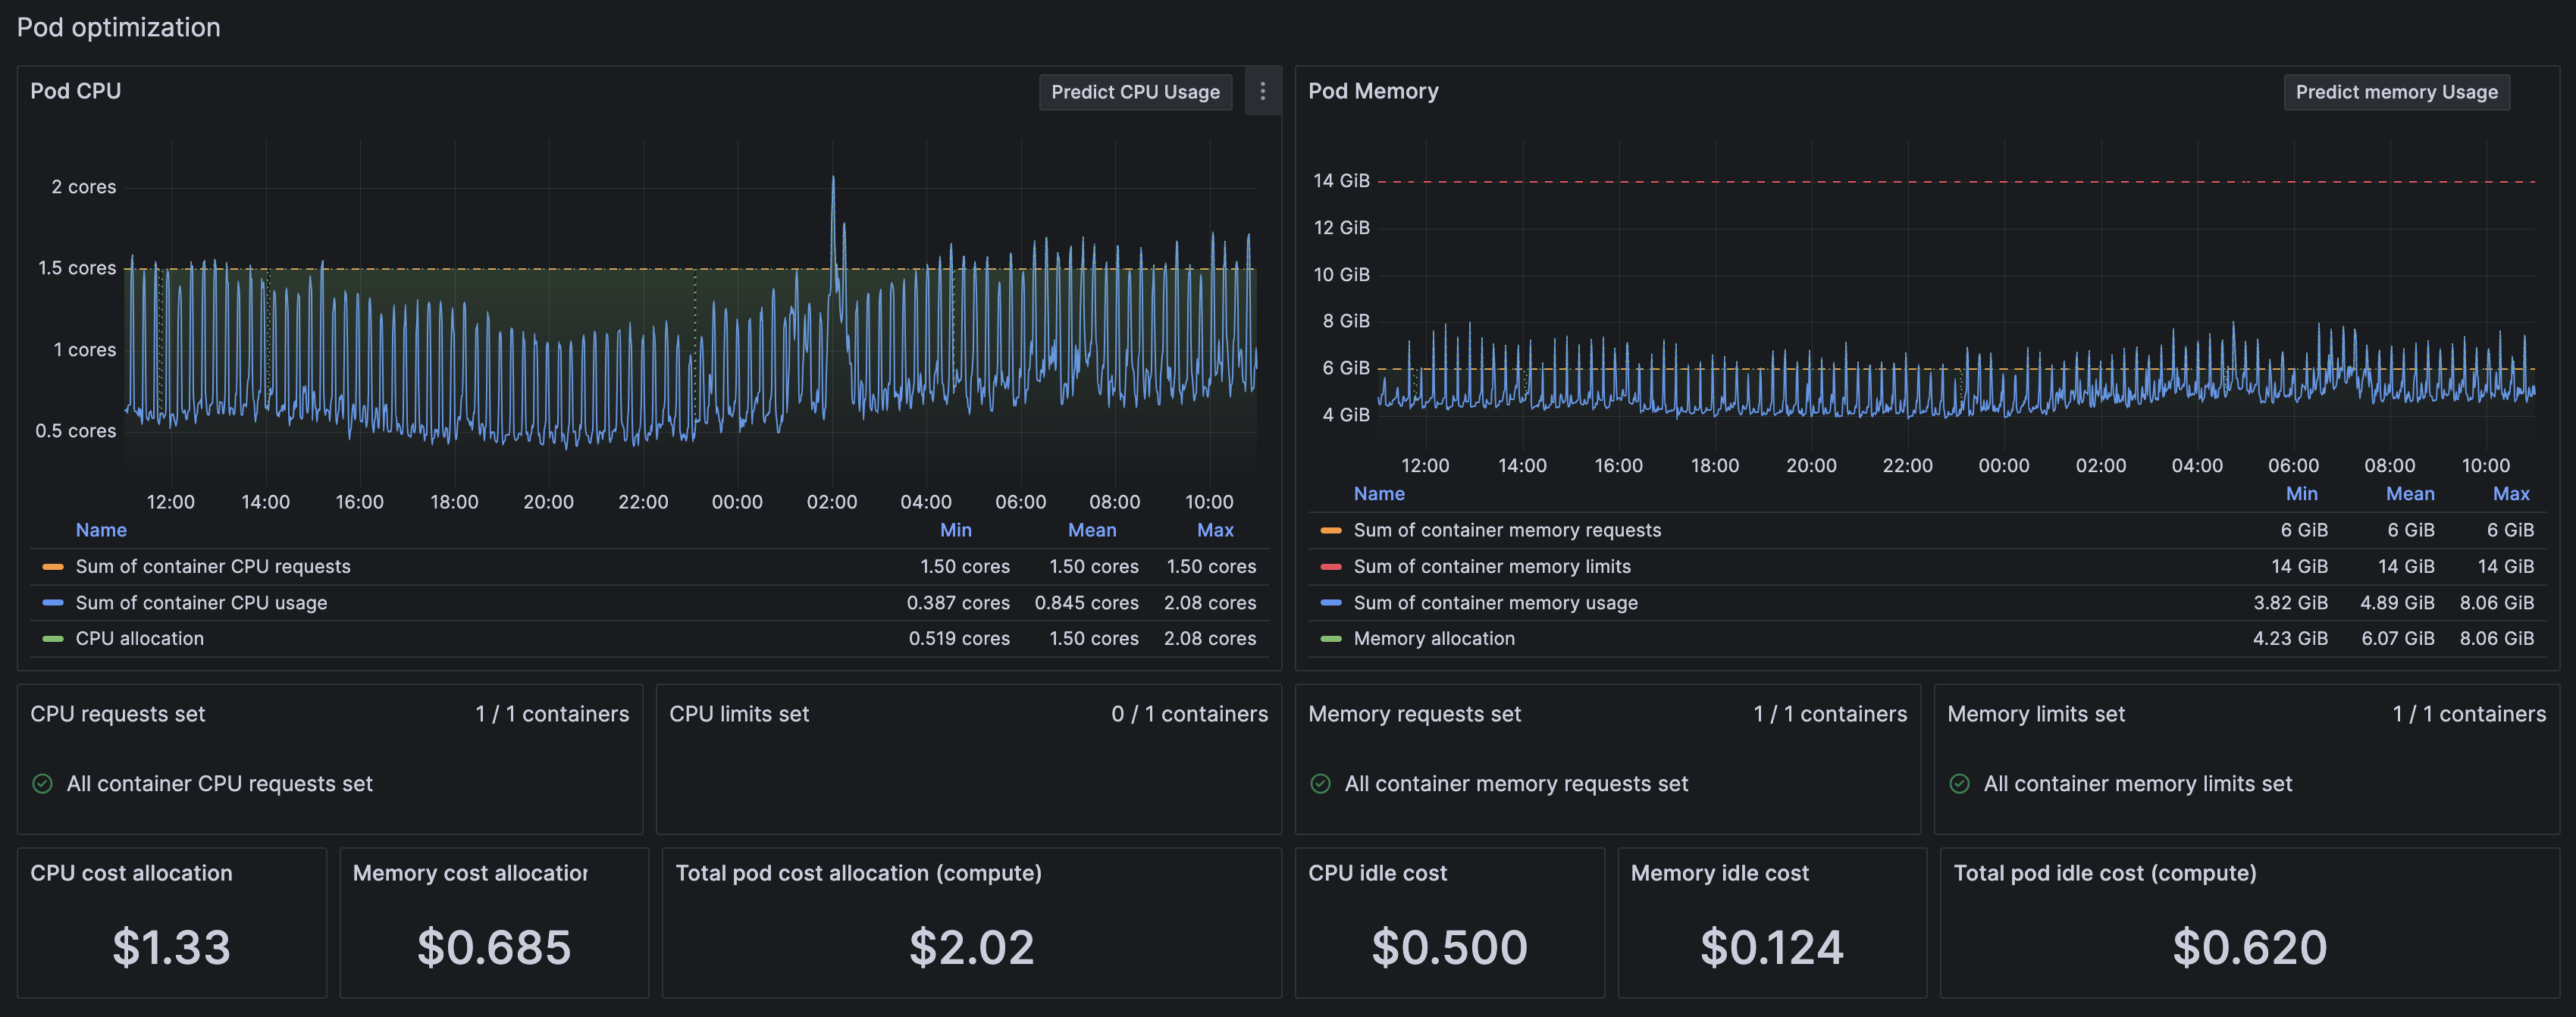
Zoom into an area of any graph on the detail pages to narrow the time range selector even further. The time range remains selected until you click Back to default.
You can also use the time range selector to identify resource usage peaks and avoid performance degradation.
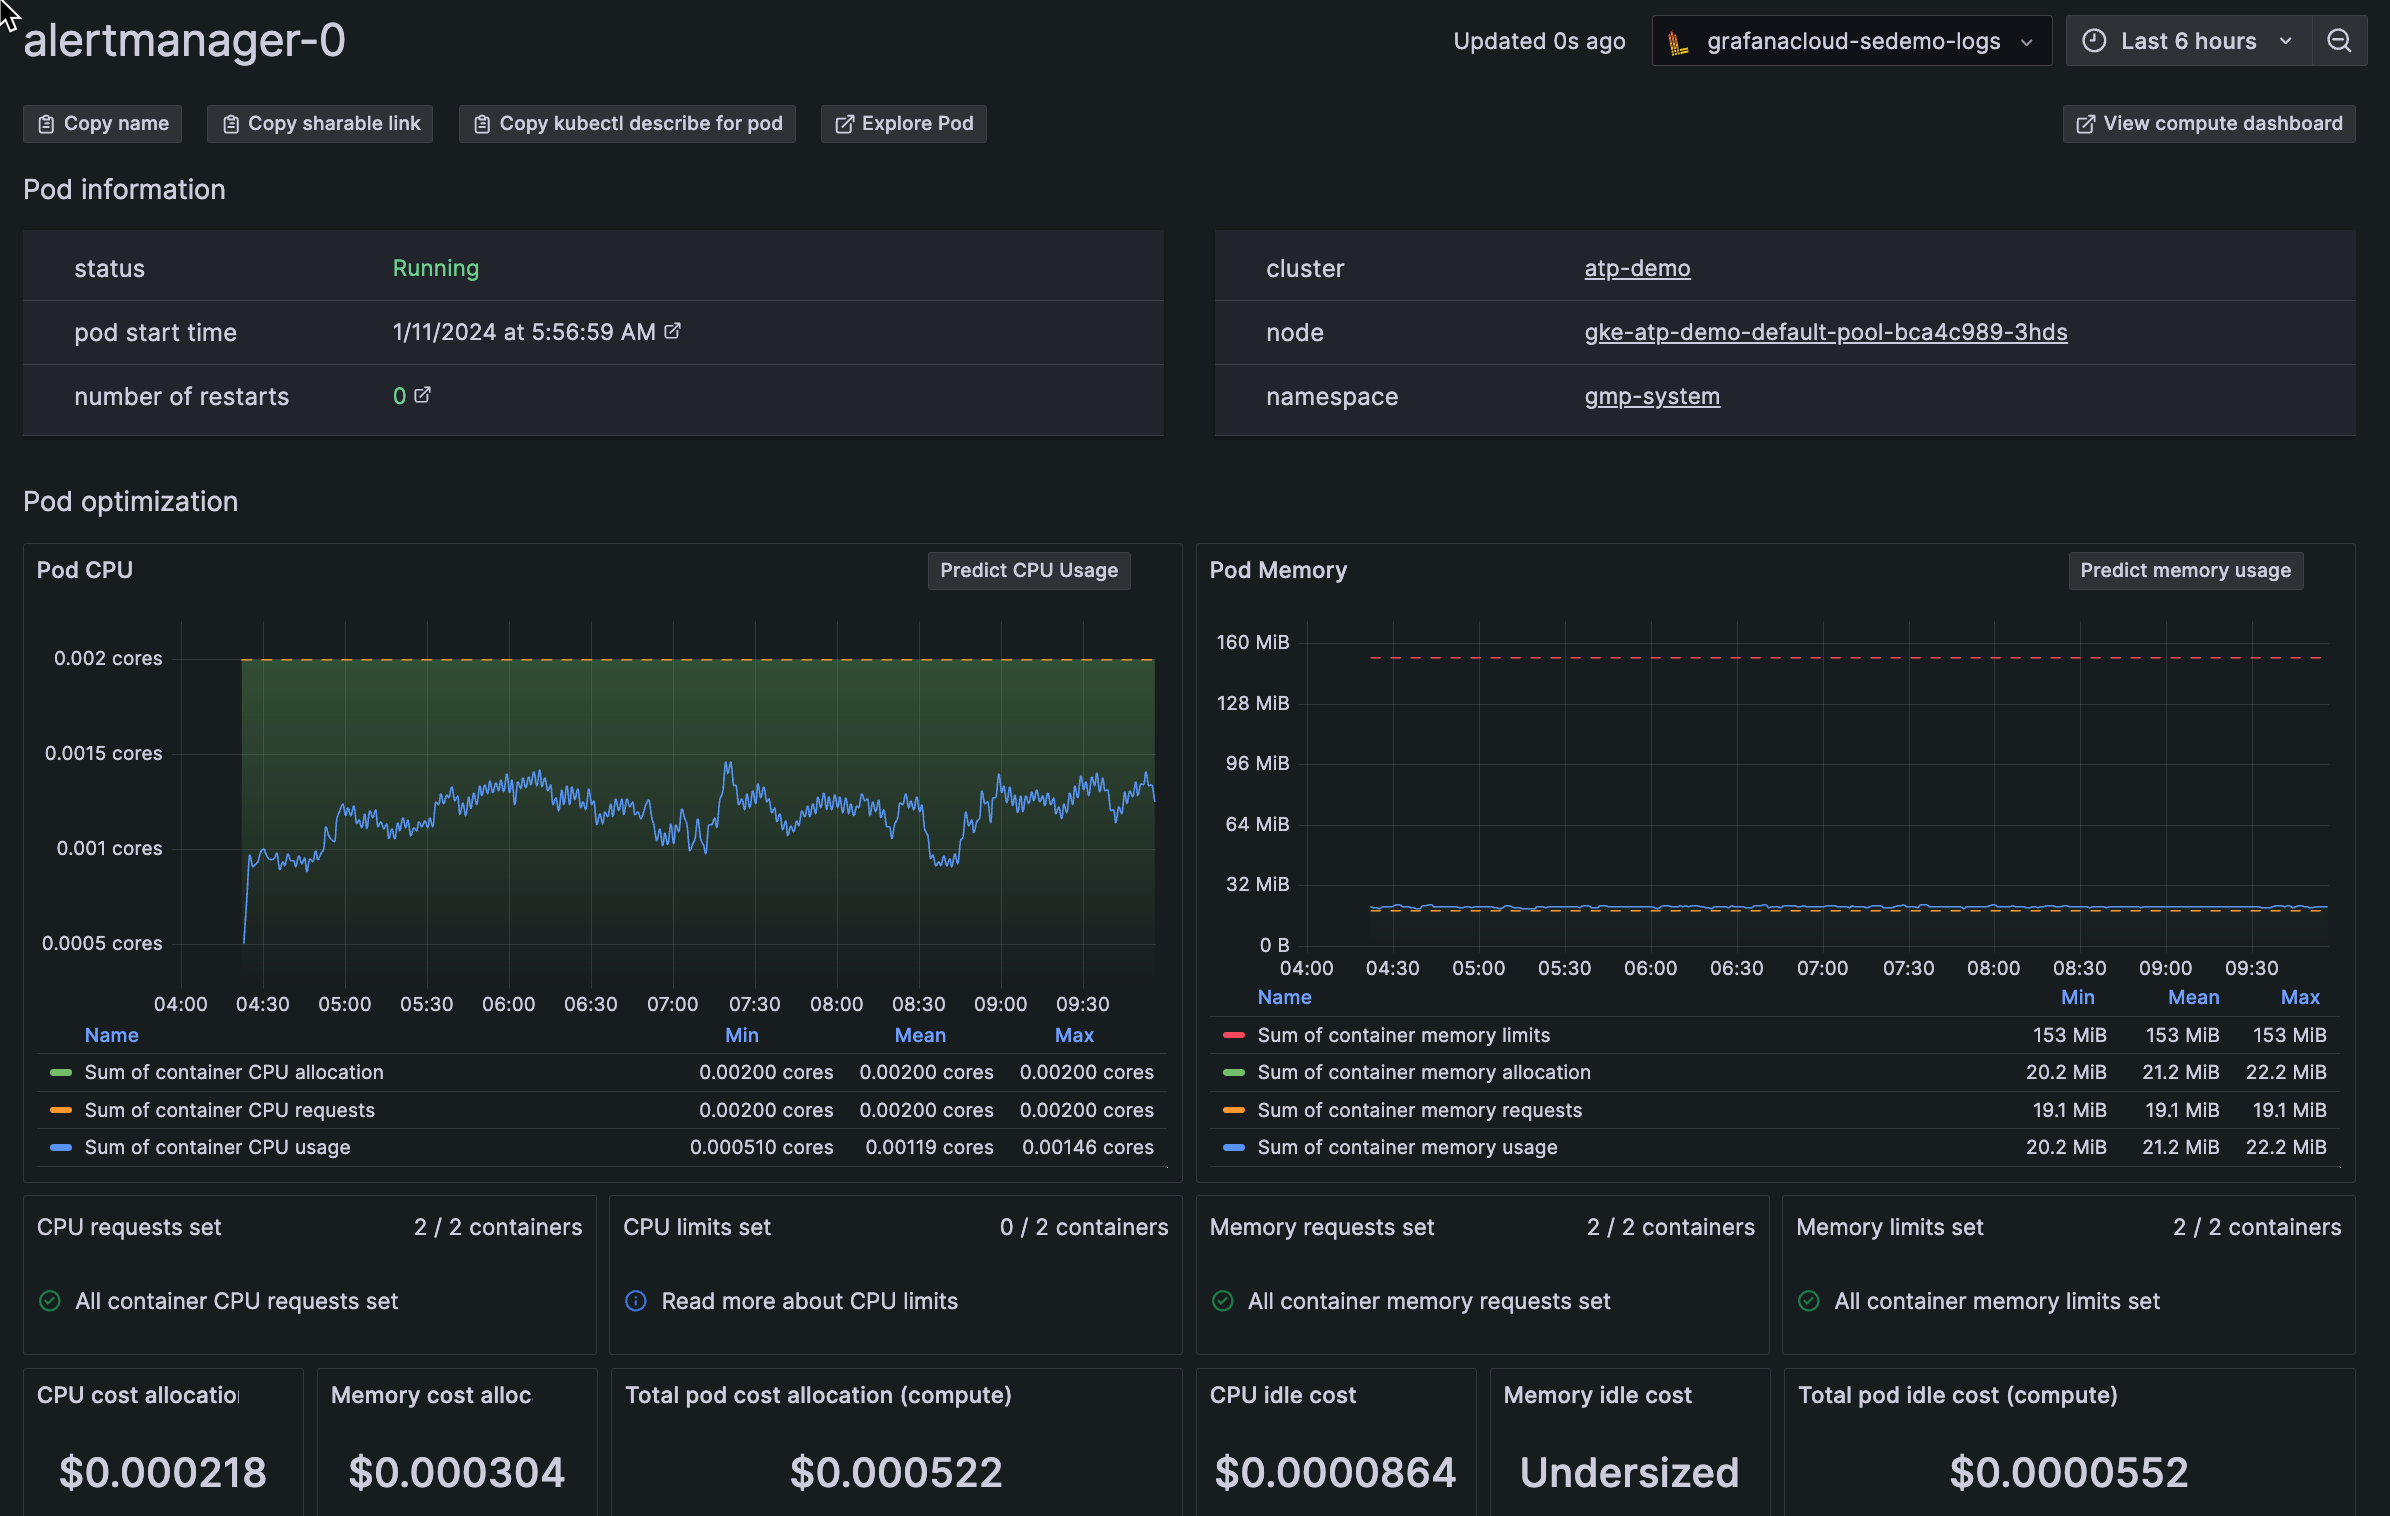

With Grafana Play, you can explore and see how it works, learning from practical examples to accelerate your development. This feature can be seen on this workload details page set for the last 2 days.
Find deleted Kubernetes objects
You can find deleted Clusters, namespaces, workloads, Nodes, Pods, and containers to understand what occurred in the past. To do so, set the time range selector to a past time period.
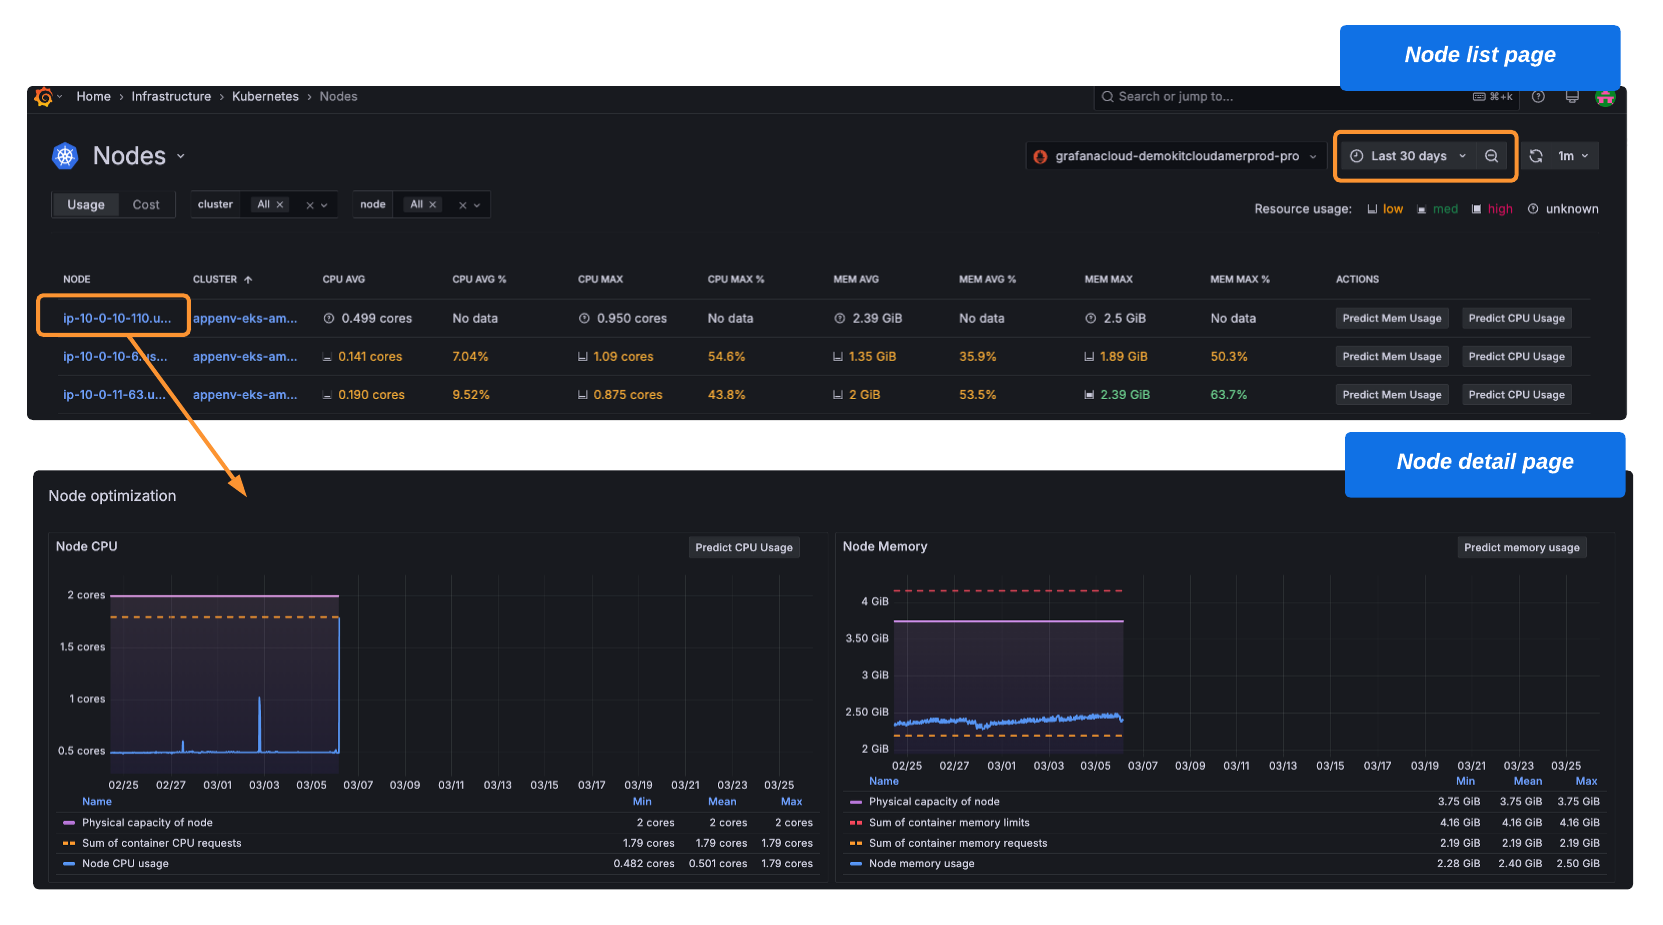
The following example shows a time range of the previous 30 days with some Nodes that show no data (also colored in white text). When you click on a Node with no data, you can learn when the Node expired.
Note
Grafana Cloud has a default 30-day limit for queries. If your Kubernetes object was deleted 30 days beyond the current date, use the time range selector to choose a specific 30-day time frame in the past.
Was this page helpful?
Related resources from Grafana Labs



