
 Grafana Cloud
Observe and act
Monitor infrastructure
Kubernetes Monitoring
Optimize resource usage and efficiency
Monitor resource usage
Grafana Cloud
Observe and act
Monitor infrastructure
Kubernetes Monitoring
Optimize resource usage and efficiency
Monitor resource usageMonitor resource usage
Kubernetes Monitoring reveals CPU, memory, GPU, storage, and network usage across list views and detail pages. You can view resource usage at any level, from a Cluster down to a container, and compare it against the configured requests and capacity.
Find resource usage in list views
In any list view, you can find, filter, and sort maximum values for CPU and memory usage.
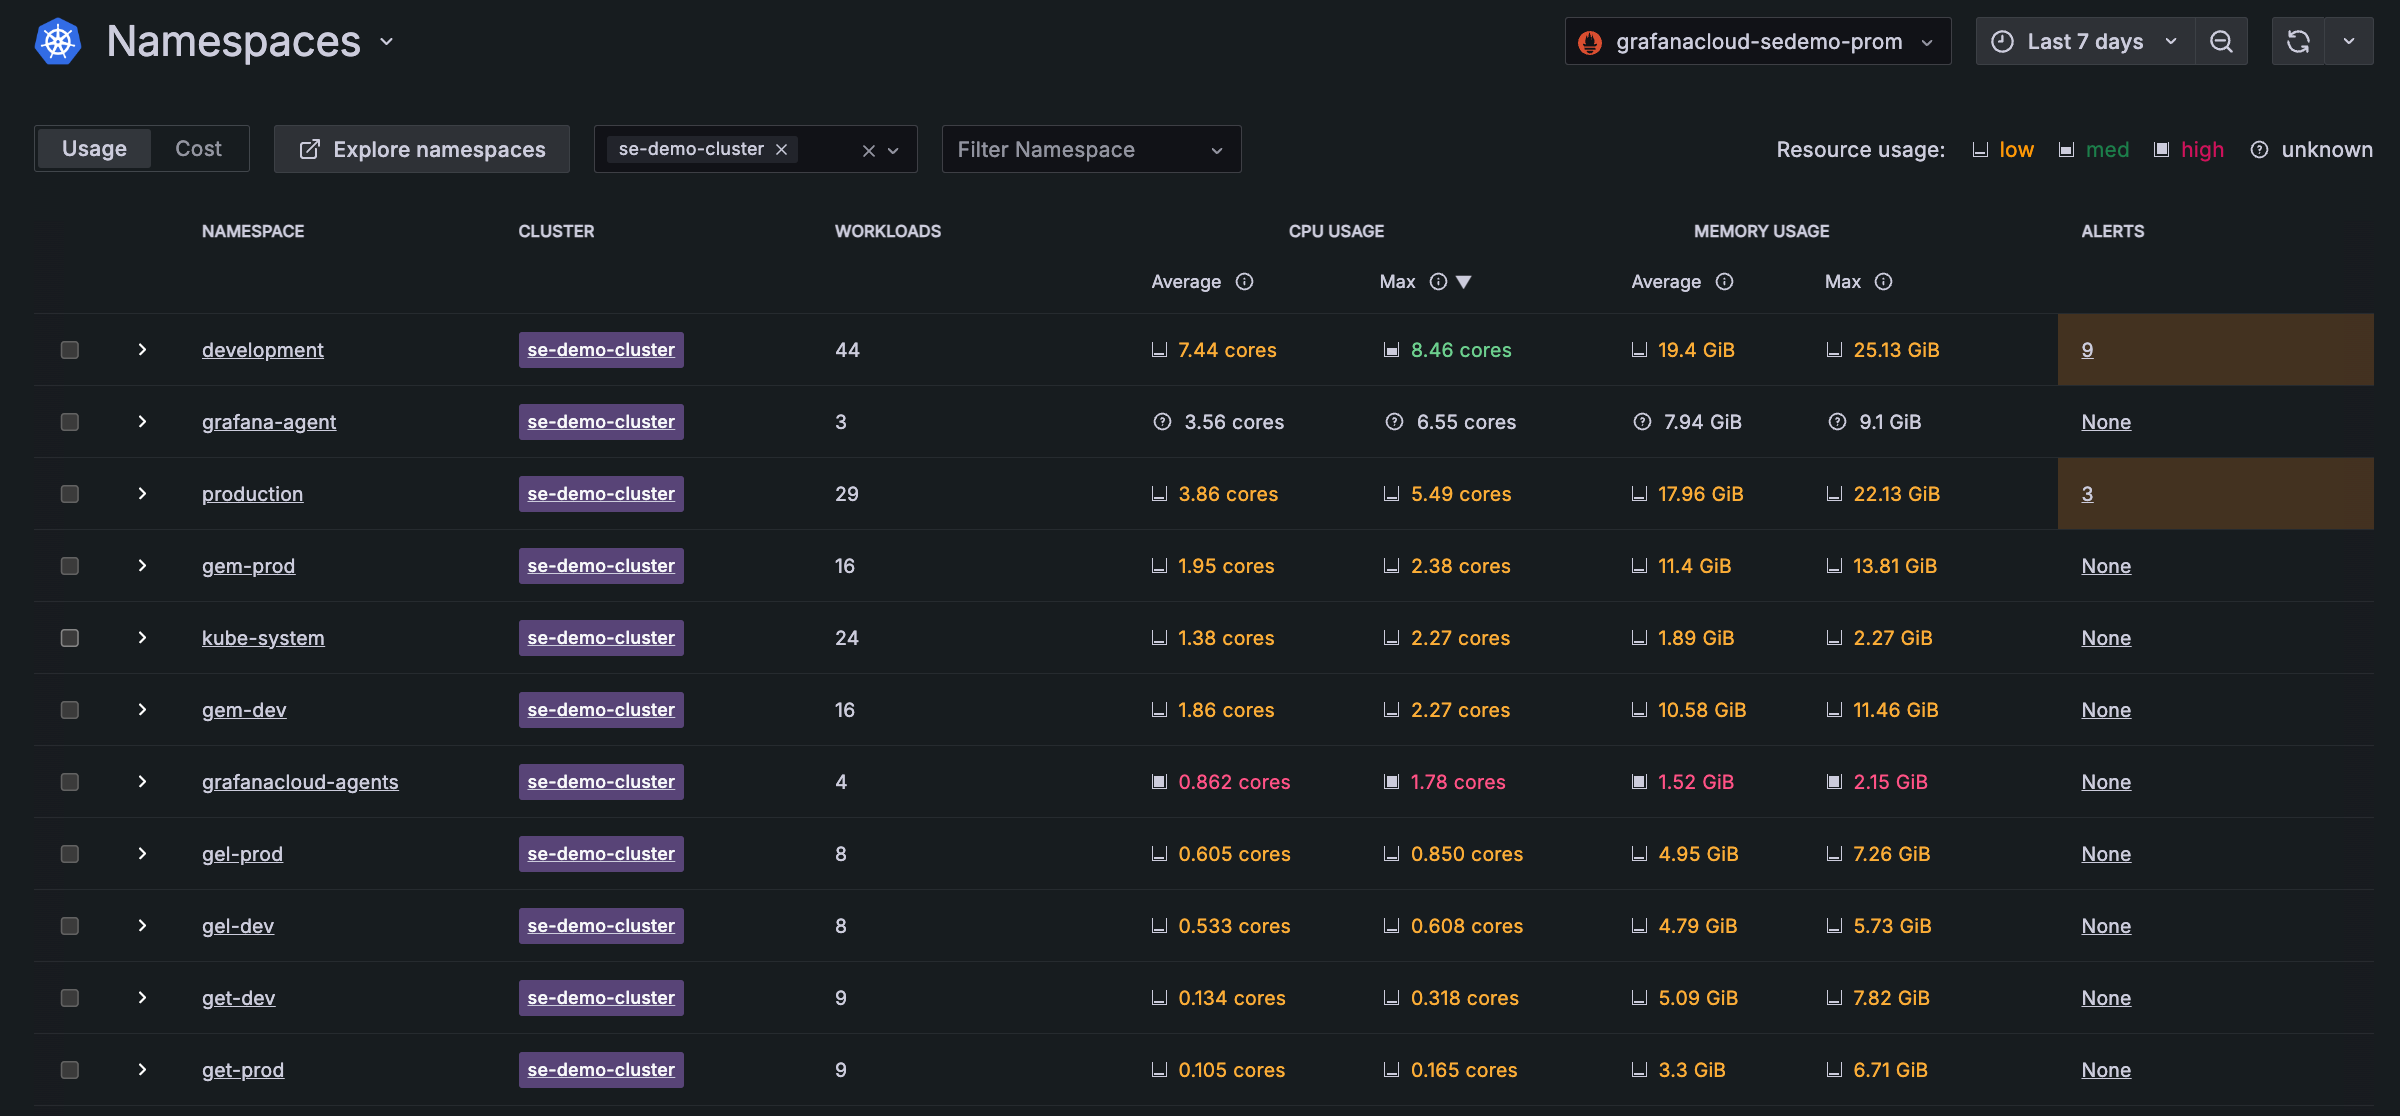

With Grafana Play, you can explore and see how it works, learning from practical examples to accelerate your development. This feature can be seen on this workloads list page.
CPU and memory tabs
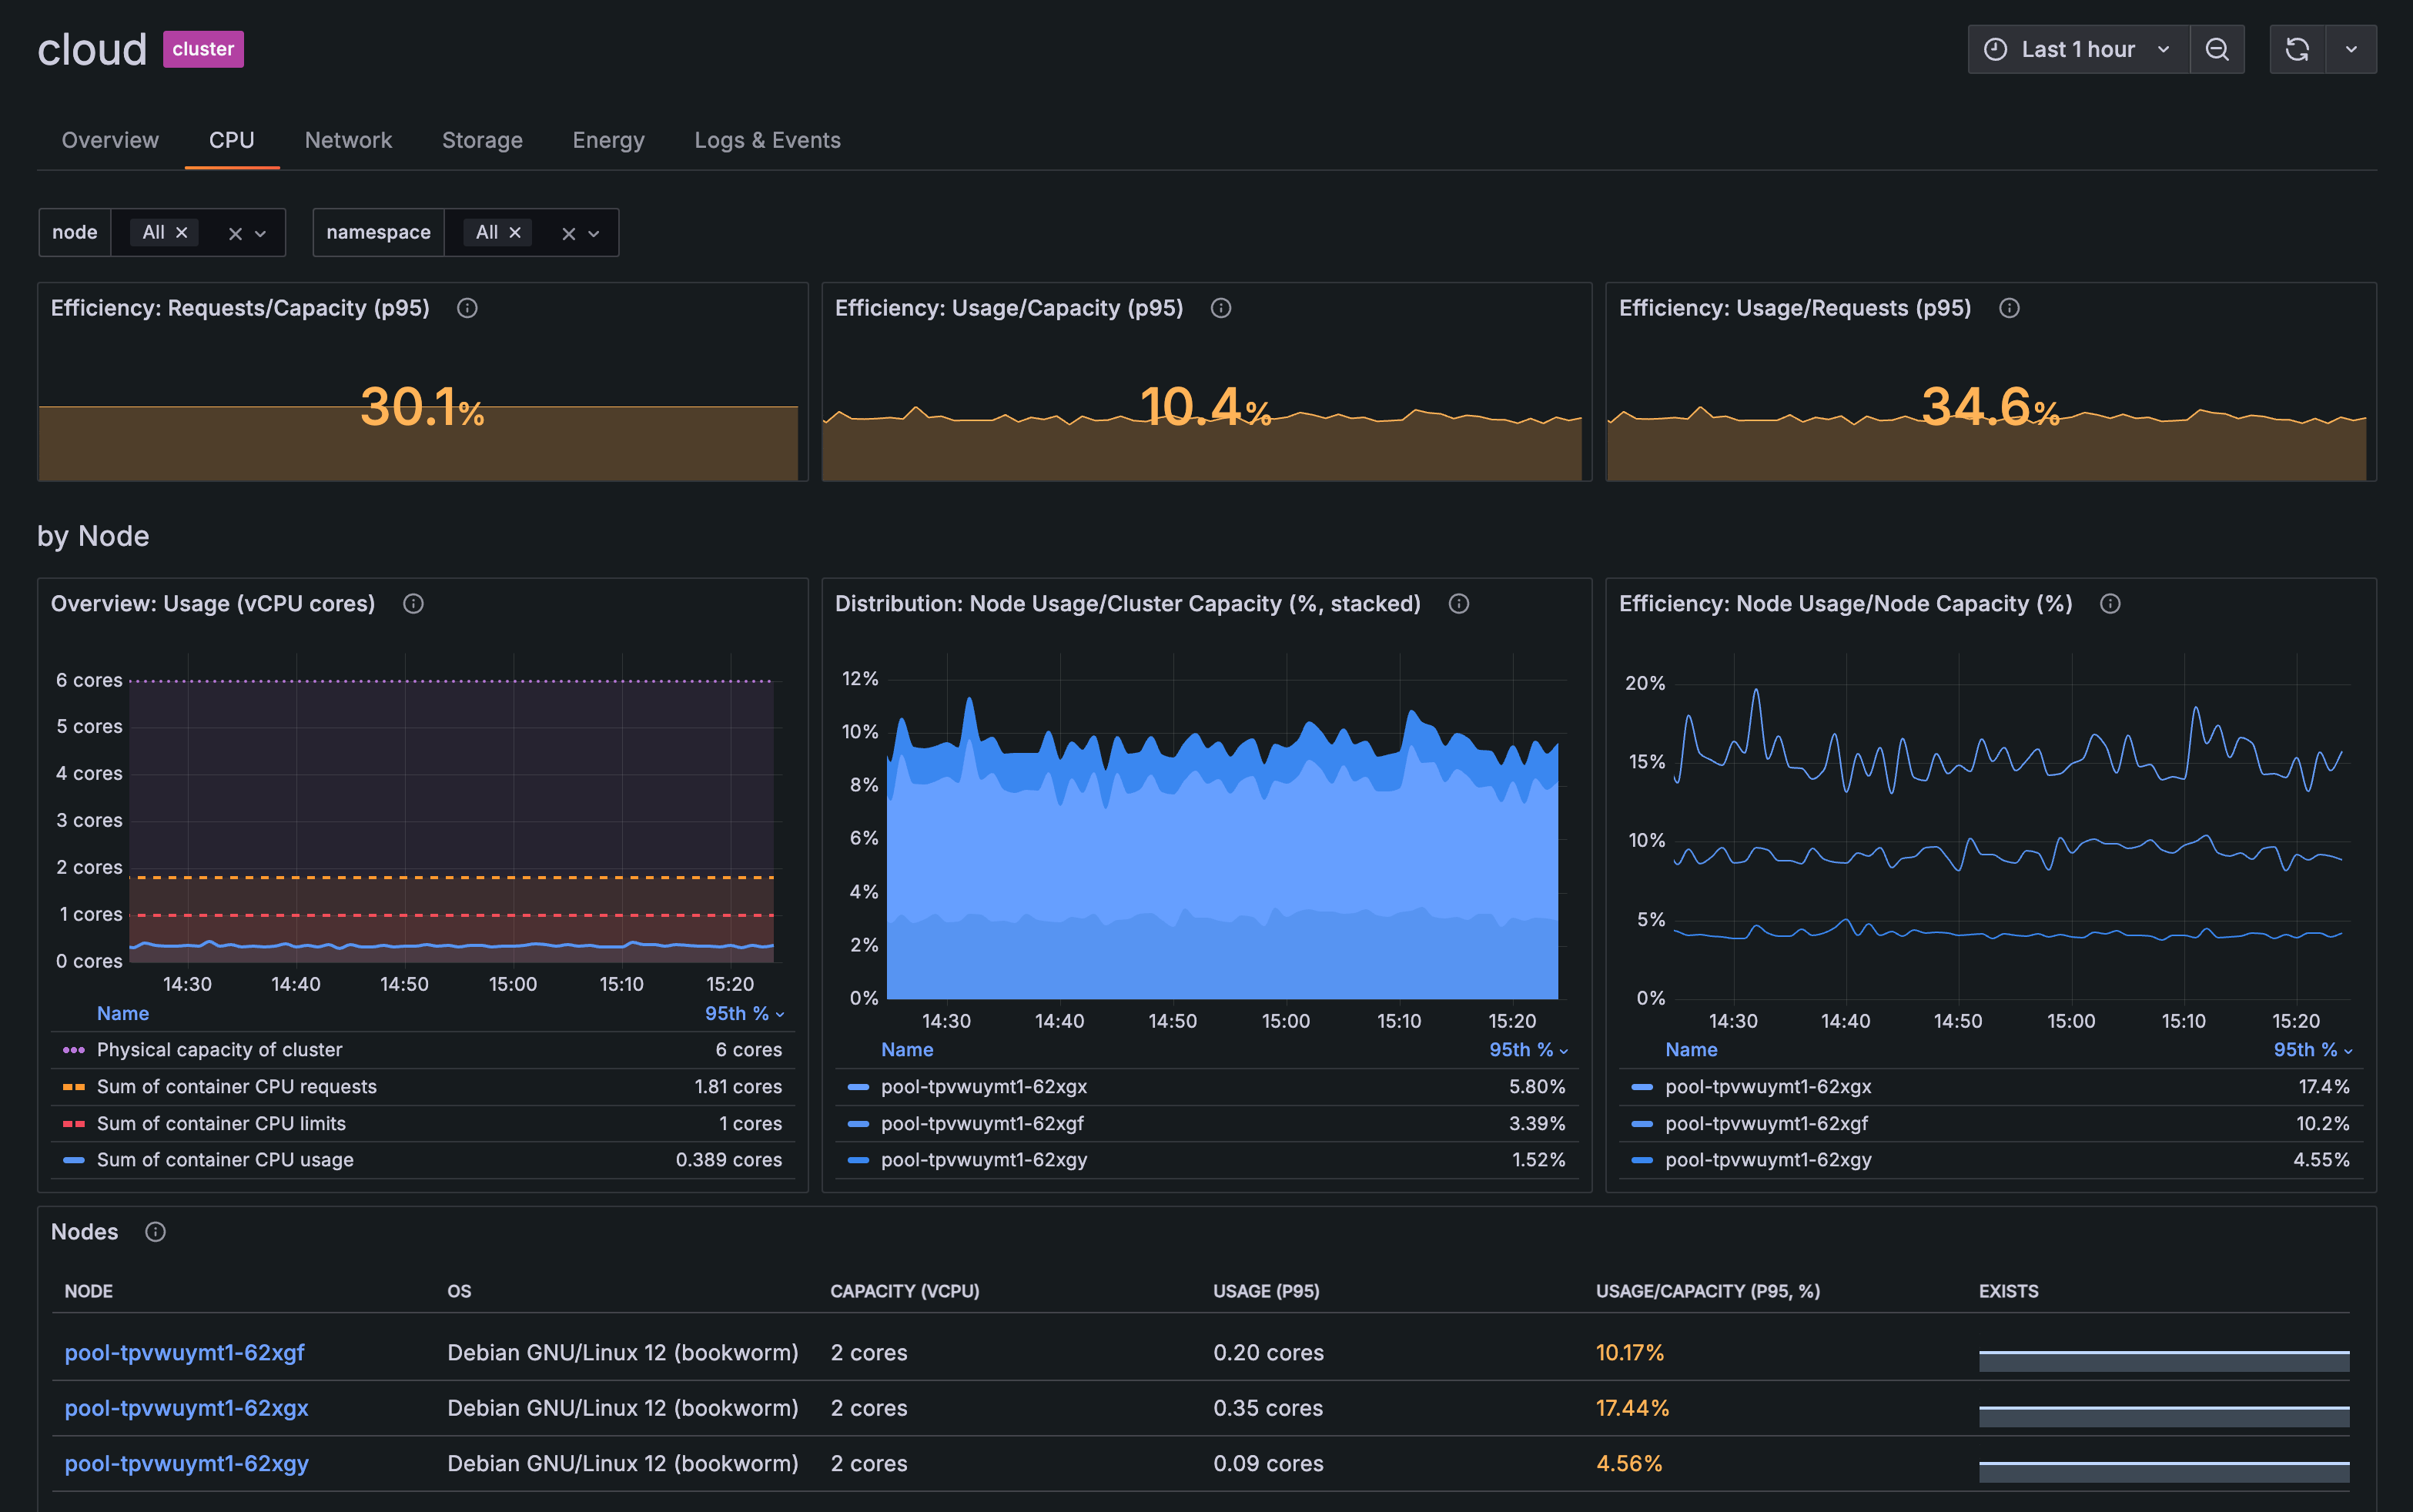
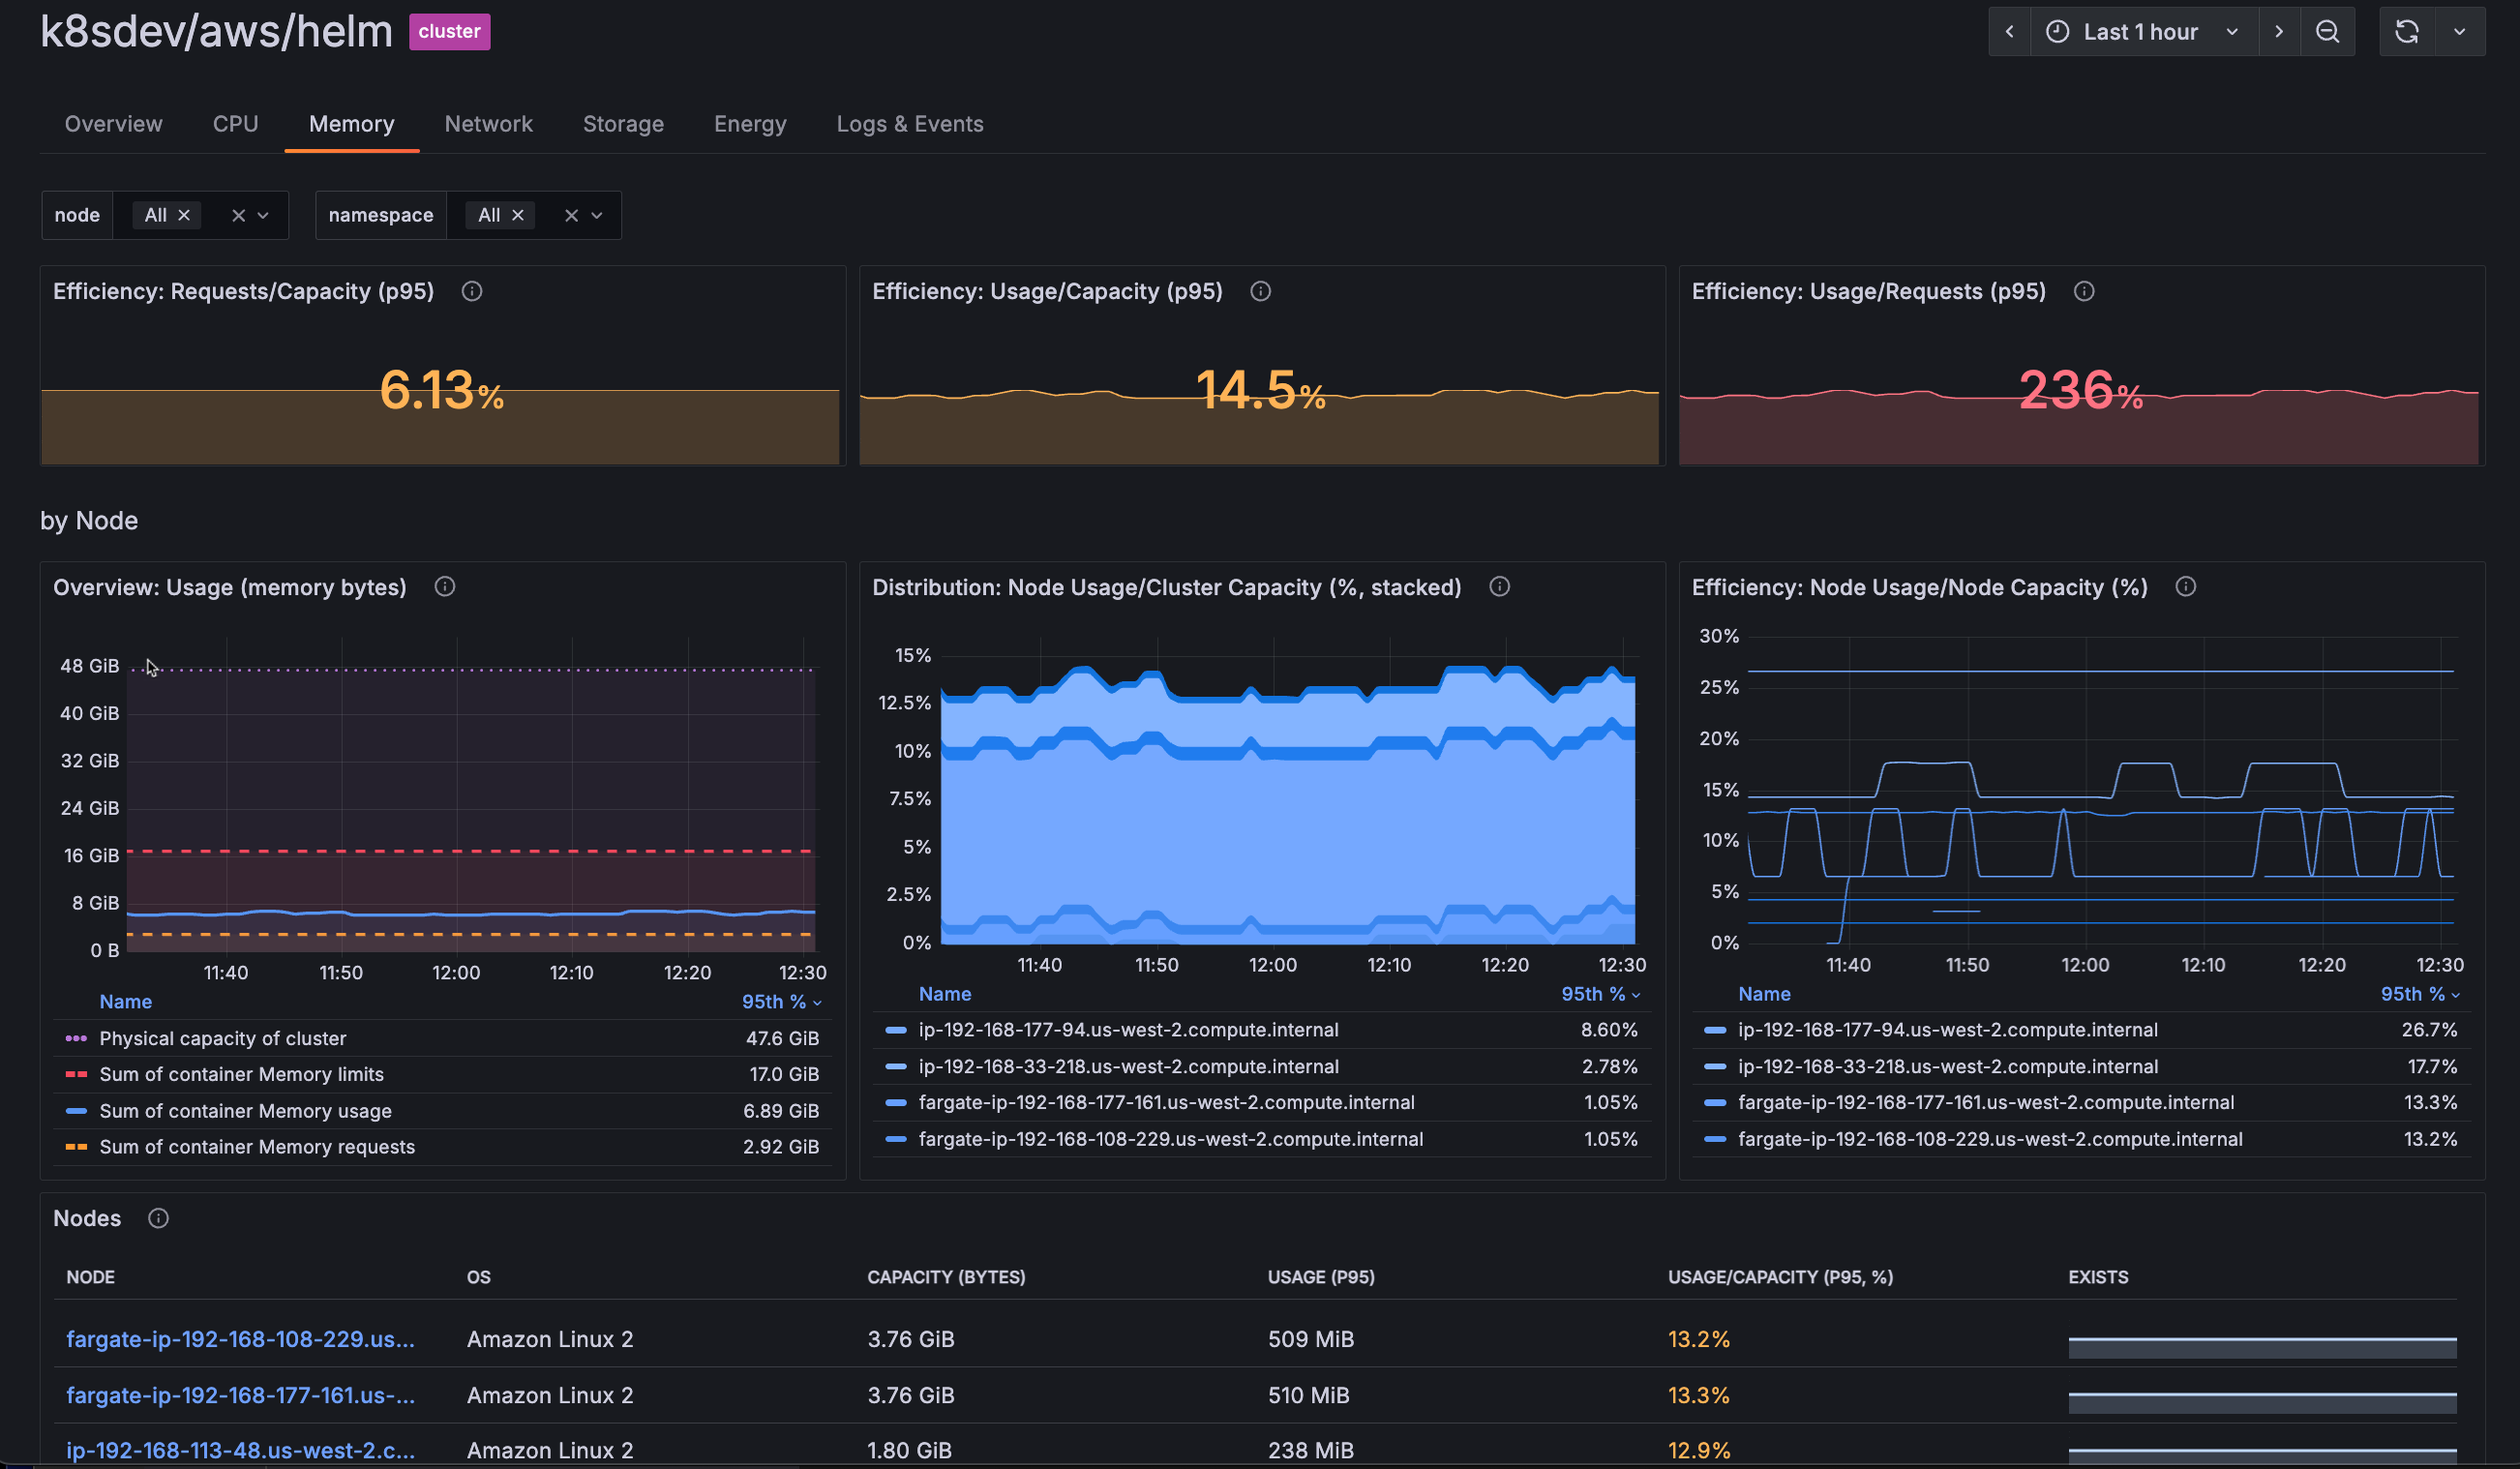
On any detail page you can view an overview of CPU and memory usage. You can also click the CPU tab or the Memory tab to view more correlated usage information. For example, the CPU and Memory tabs on the Cluster detail page show:
Requests compared to capacity
Usage compared to capacity
Usage compared to requests for Nodes and namespaces in the Cluster

CPU tab of Cluster detail page 
Memory tab of Cluster detail page
With Grafana Play, you can explore and see how it works, learning from practical examples to accelerate your development. This feature can be seen on the CPU tab for a namespace.
GPU tabs
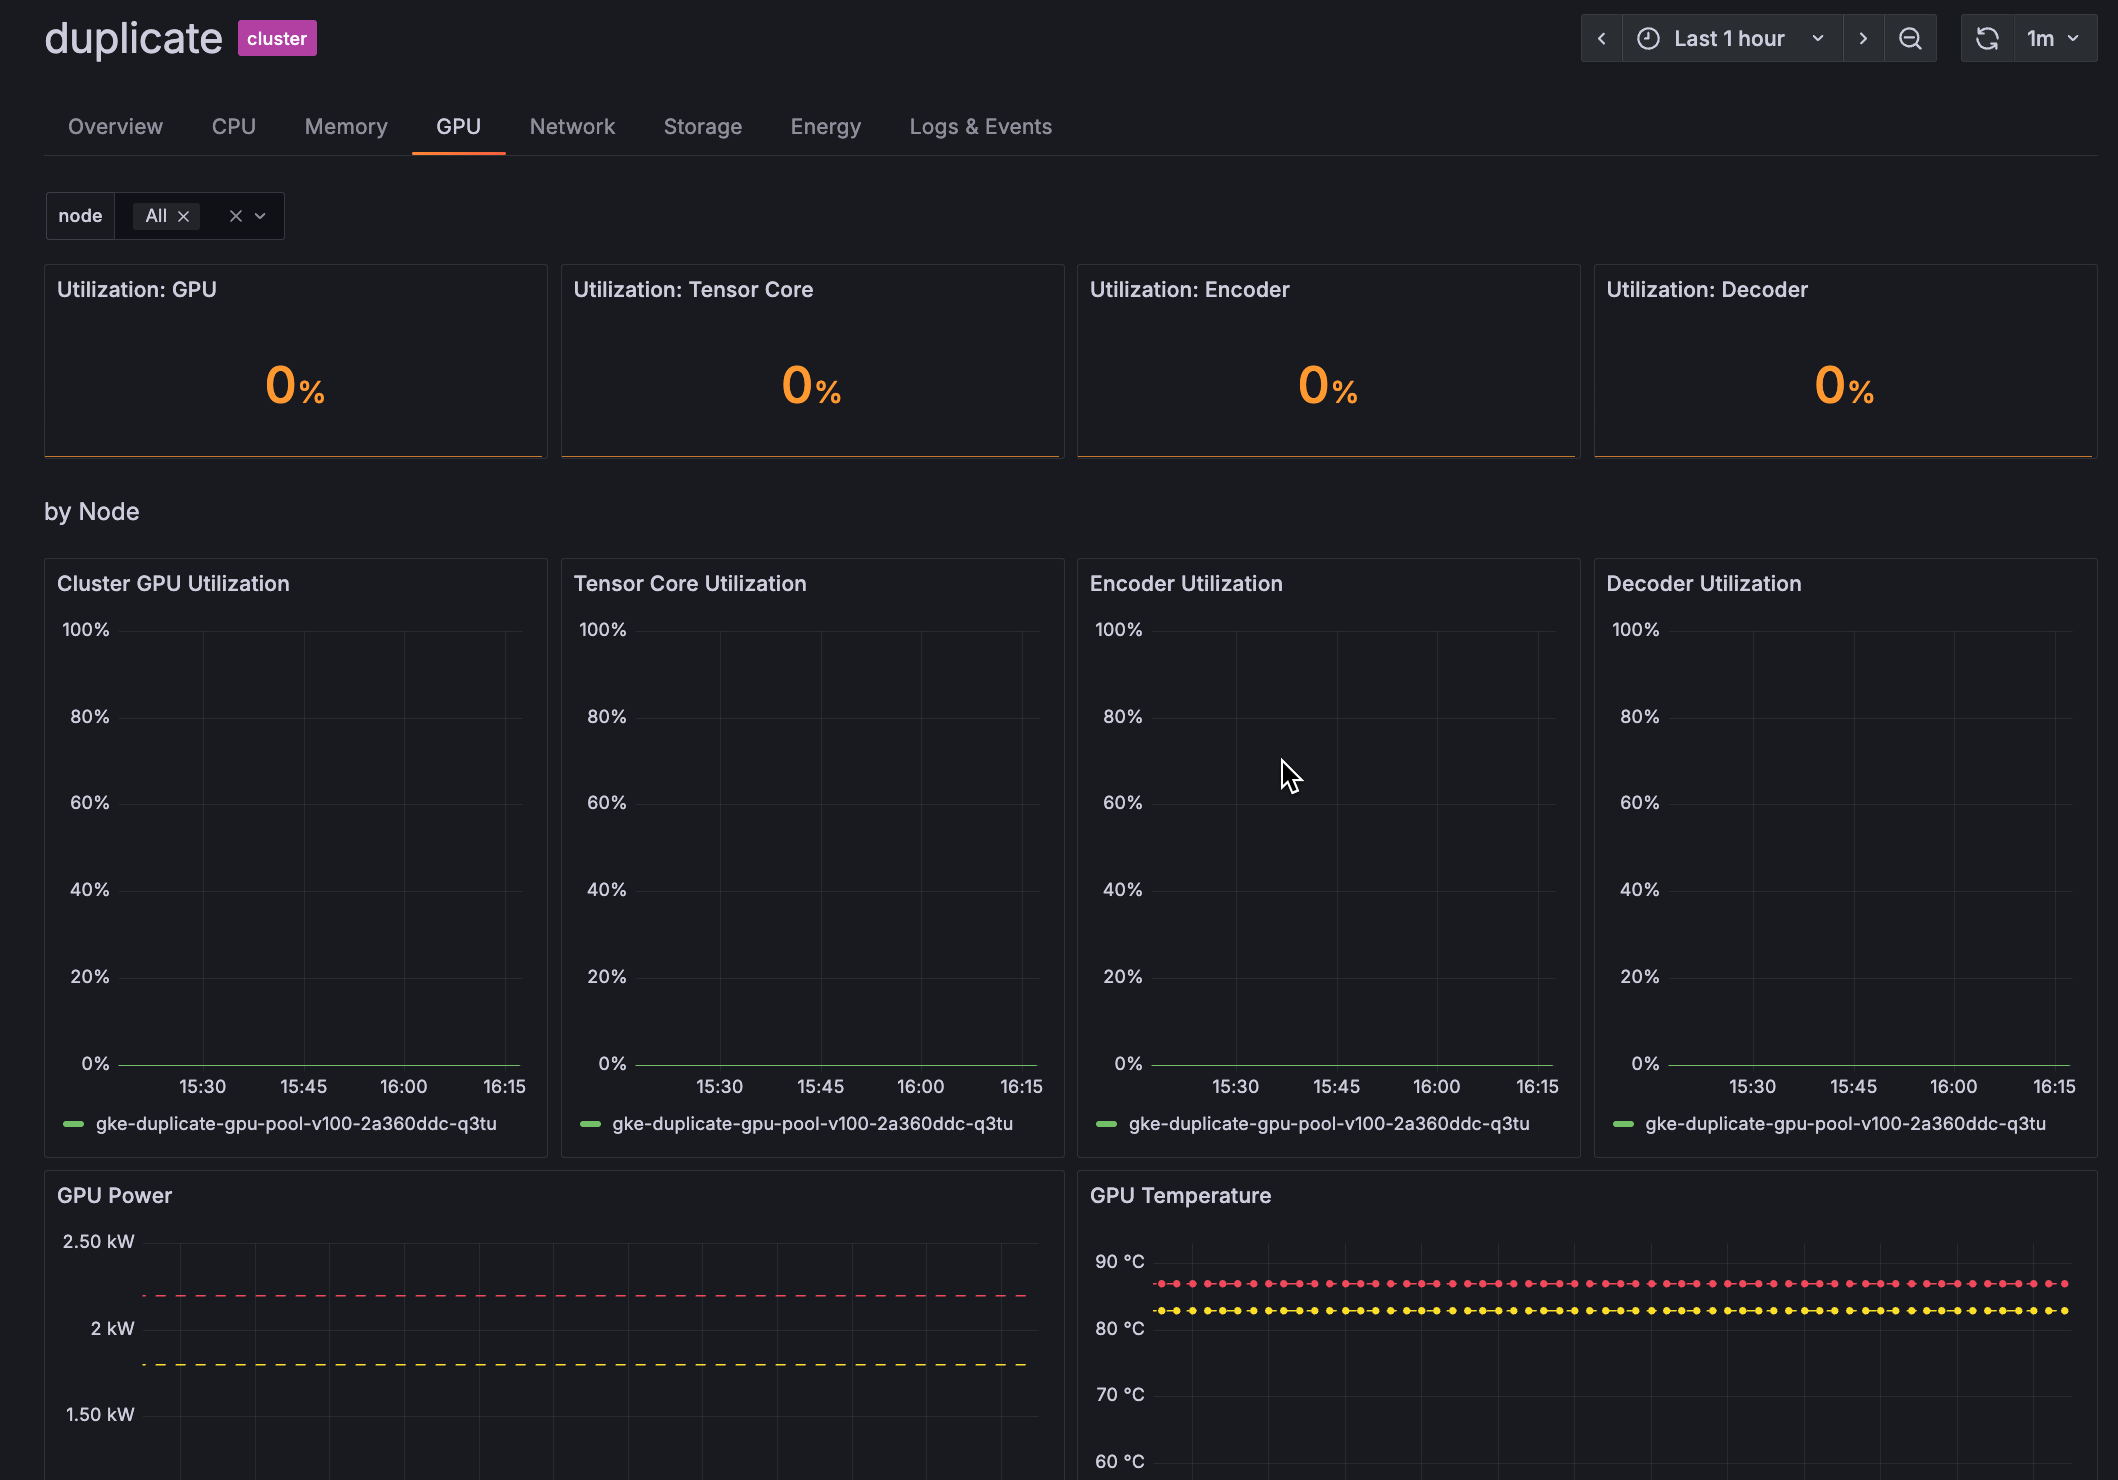
View GPU utilization panels on the GPU tabs of Cluster and Node detail pages to answer questions like:
- Are the Nvidia GPUs inside your Cluster appropriately utilized in relation to tensor cores, encoders, and decoders?
- Are workloads getting and using the GPU resources that have been made available to you?
Track persistent storage metrics
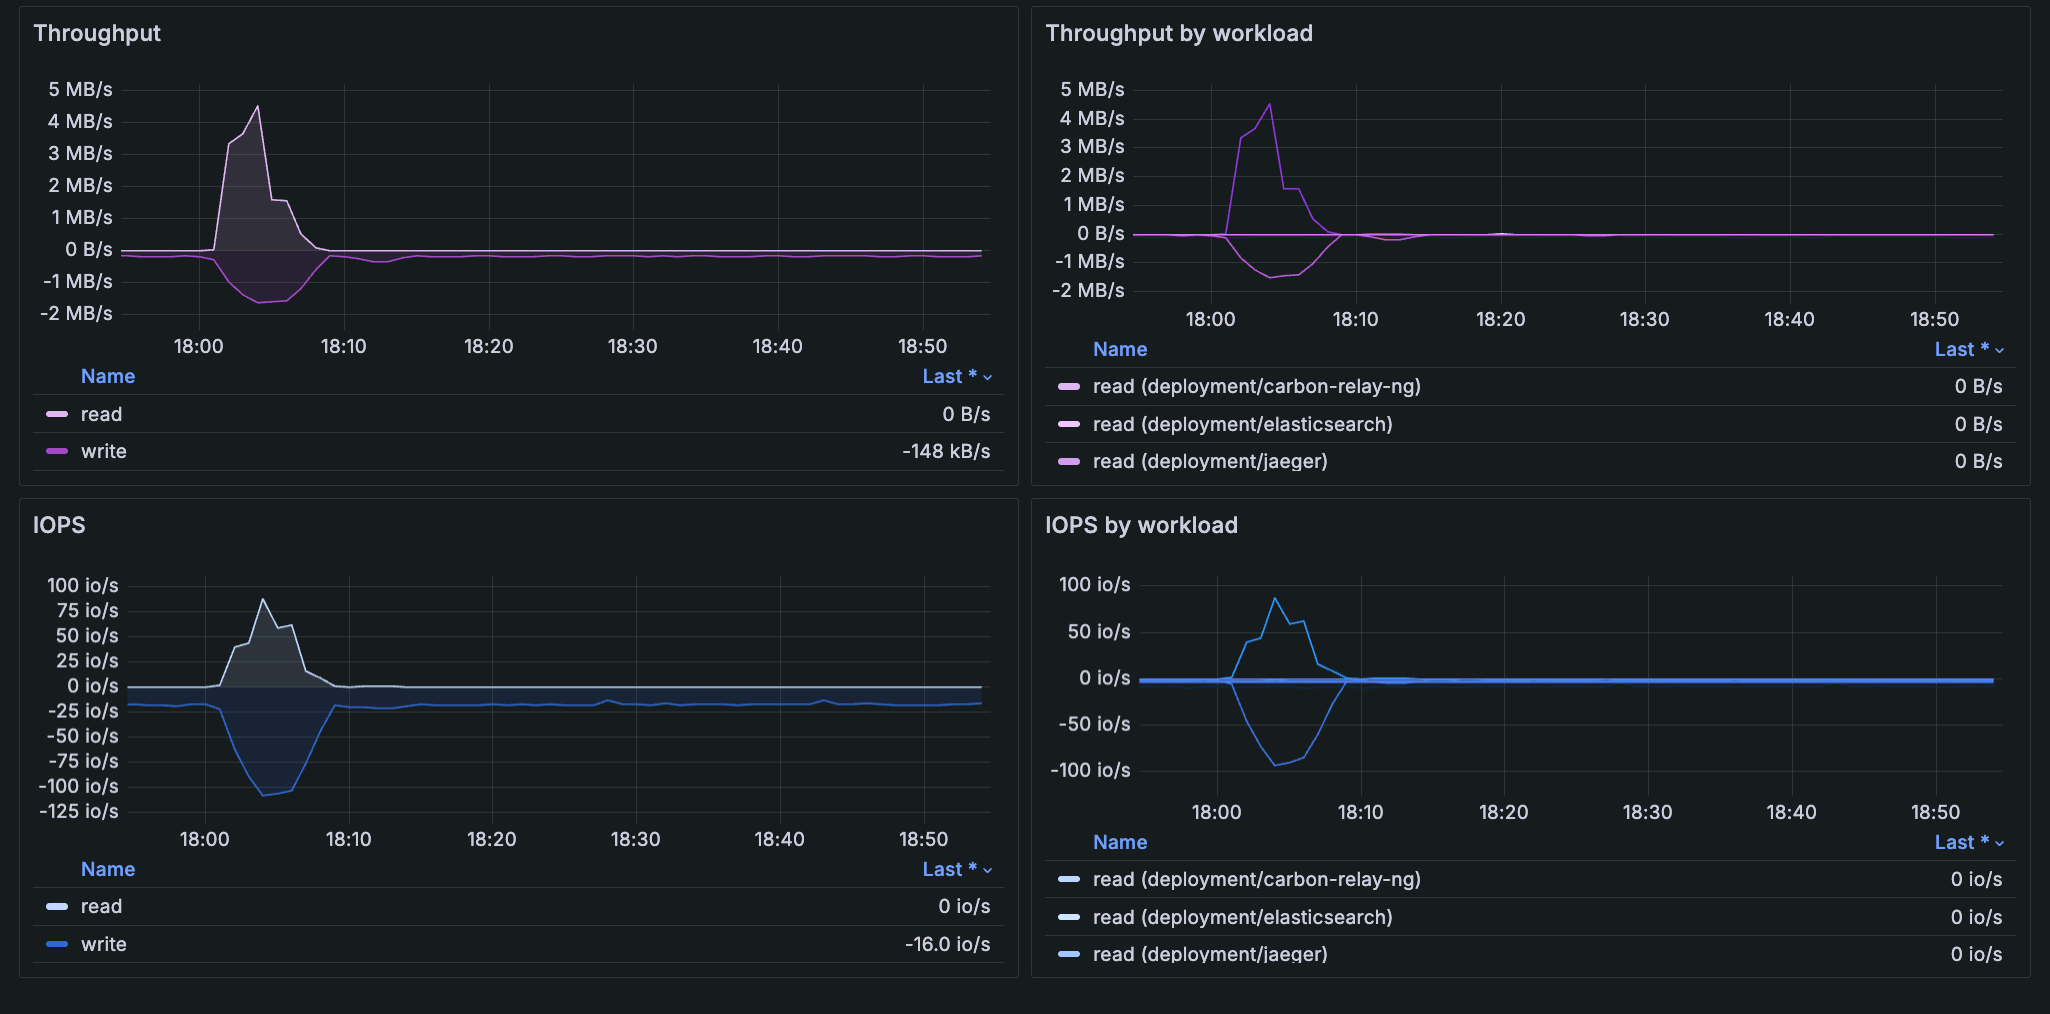
Graphs in the storage tab on the Cluster, Namespace, Workload, Node, and Pod detail pages show how persistent volume (PV) storage changes over a specific time range. You can gain insight into:
- Storage classes of persistent volume claims (PVC)
- Volume bytes of the requested PVC, which compares requests, data capacity, and usage
- Volume inodes, comparing capacity with usage
- The status phase of the PV and PVC, including the binding of the PVC request
- Throughput to understand how much data is being read and written per second
- IOPS (Input/Output Operations per Second) to understand how many read and write operations are being performed per second
With Grafana Play, you can explore and see how it works, learning from practical examples to accelerate your development. This feature can be seen on the Storage tab for a Pod.
The PV status on the Pod details page indicates the relationship between persistent volumes and Pods, and also shows the name of the volume, which can change over time.


Review Pod count
On every Workload detail page, you can use the Pod count panel to examine the Pod count over a time range you select. Pod count shows how many instances of a workload are running at any point in time. This matters because scaling events directly affect availability, performance, and cost.
To learn more, refer to Gain insight with Pod count.
With Grafana Play, you can explore and see how it works, learning from practical examples to accelerate your development. This feature can be seen on the Workload detail page.
Detect outlier Pod CPU usage
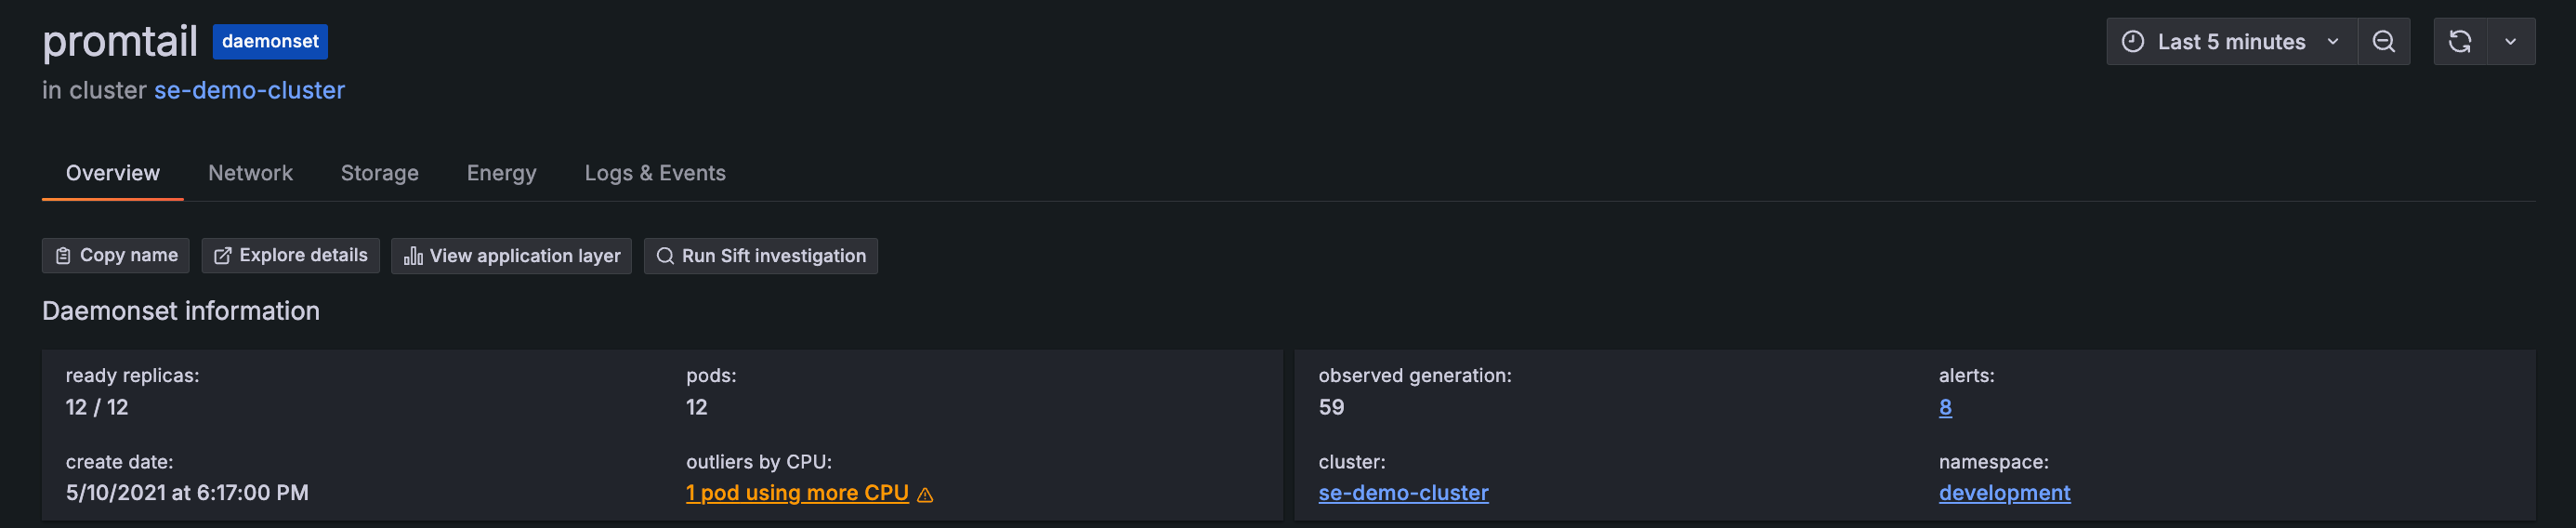
You can identify any Pods that have CPU usage different from other Pods. For any multi-Pod workload, go to the workload detail page, and review the information in the Overview tab. If there is a Pod in the workload that is an outlier for CPU usage, it is indicated in the outliers by CPU field. Click the link to open Explore and discover the outlier Pod.
View network bandwidth and saturation
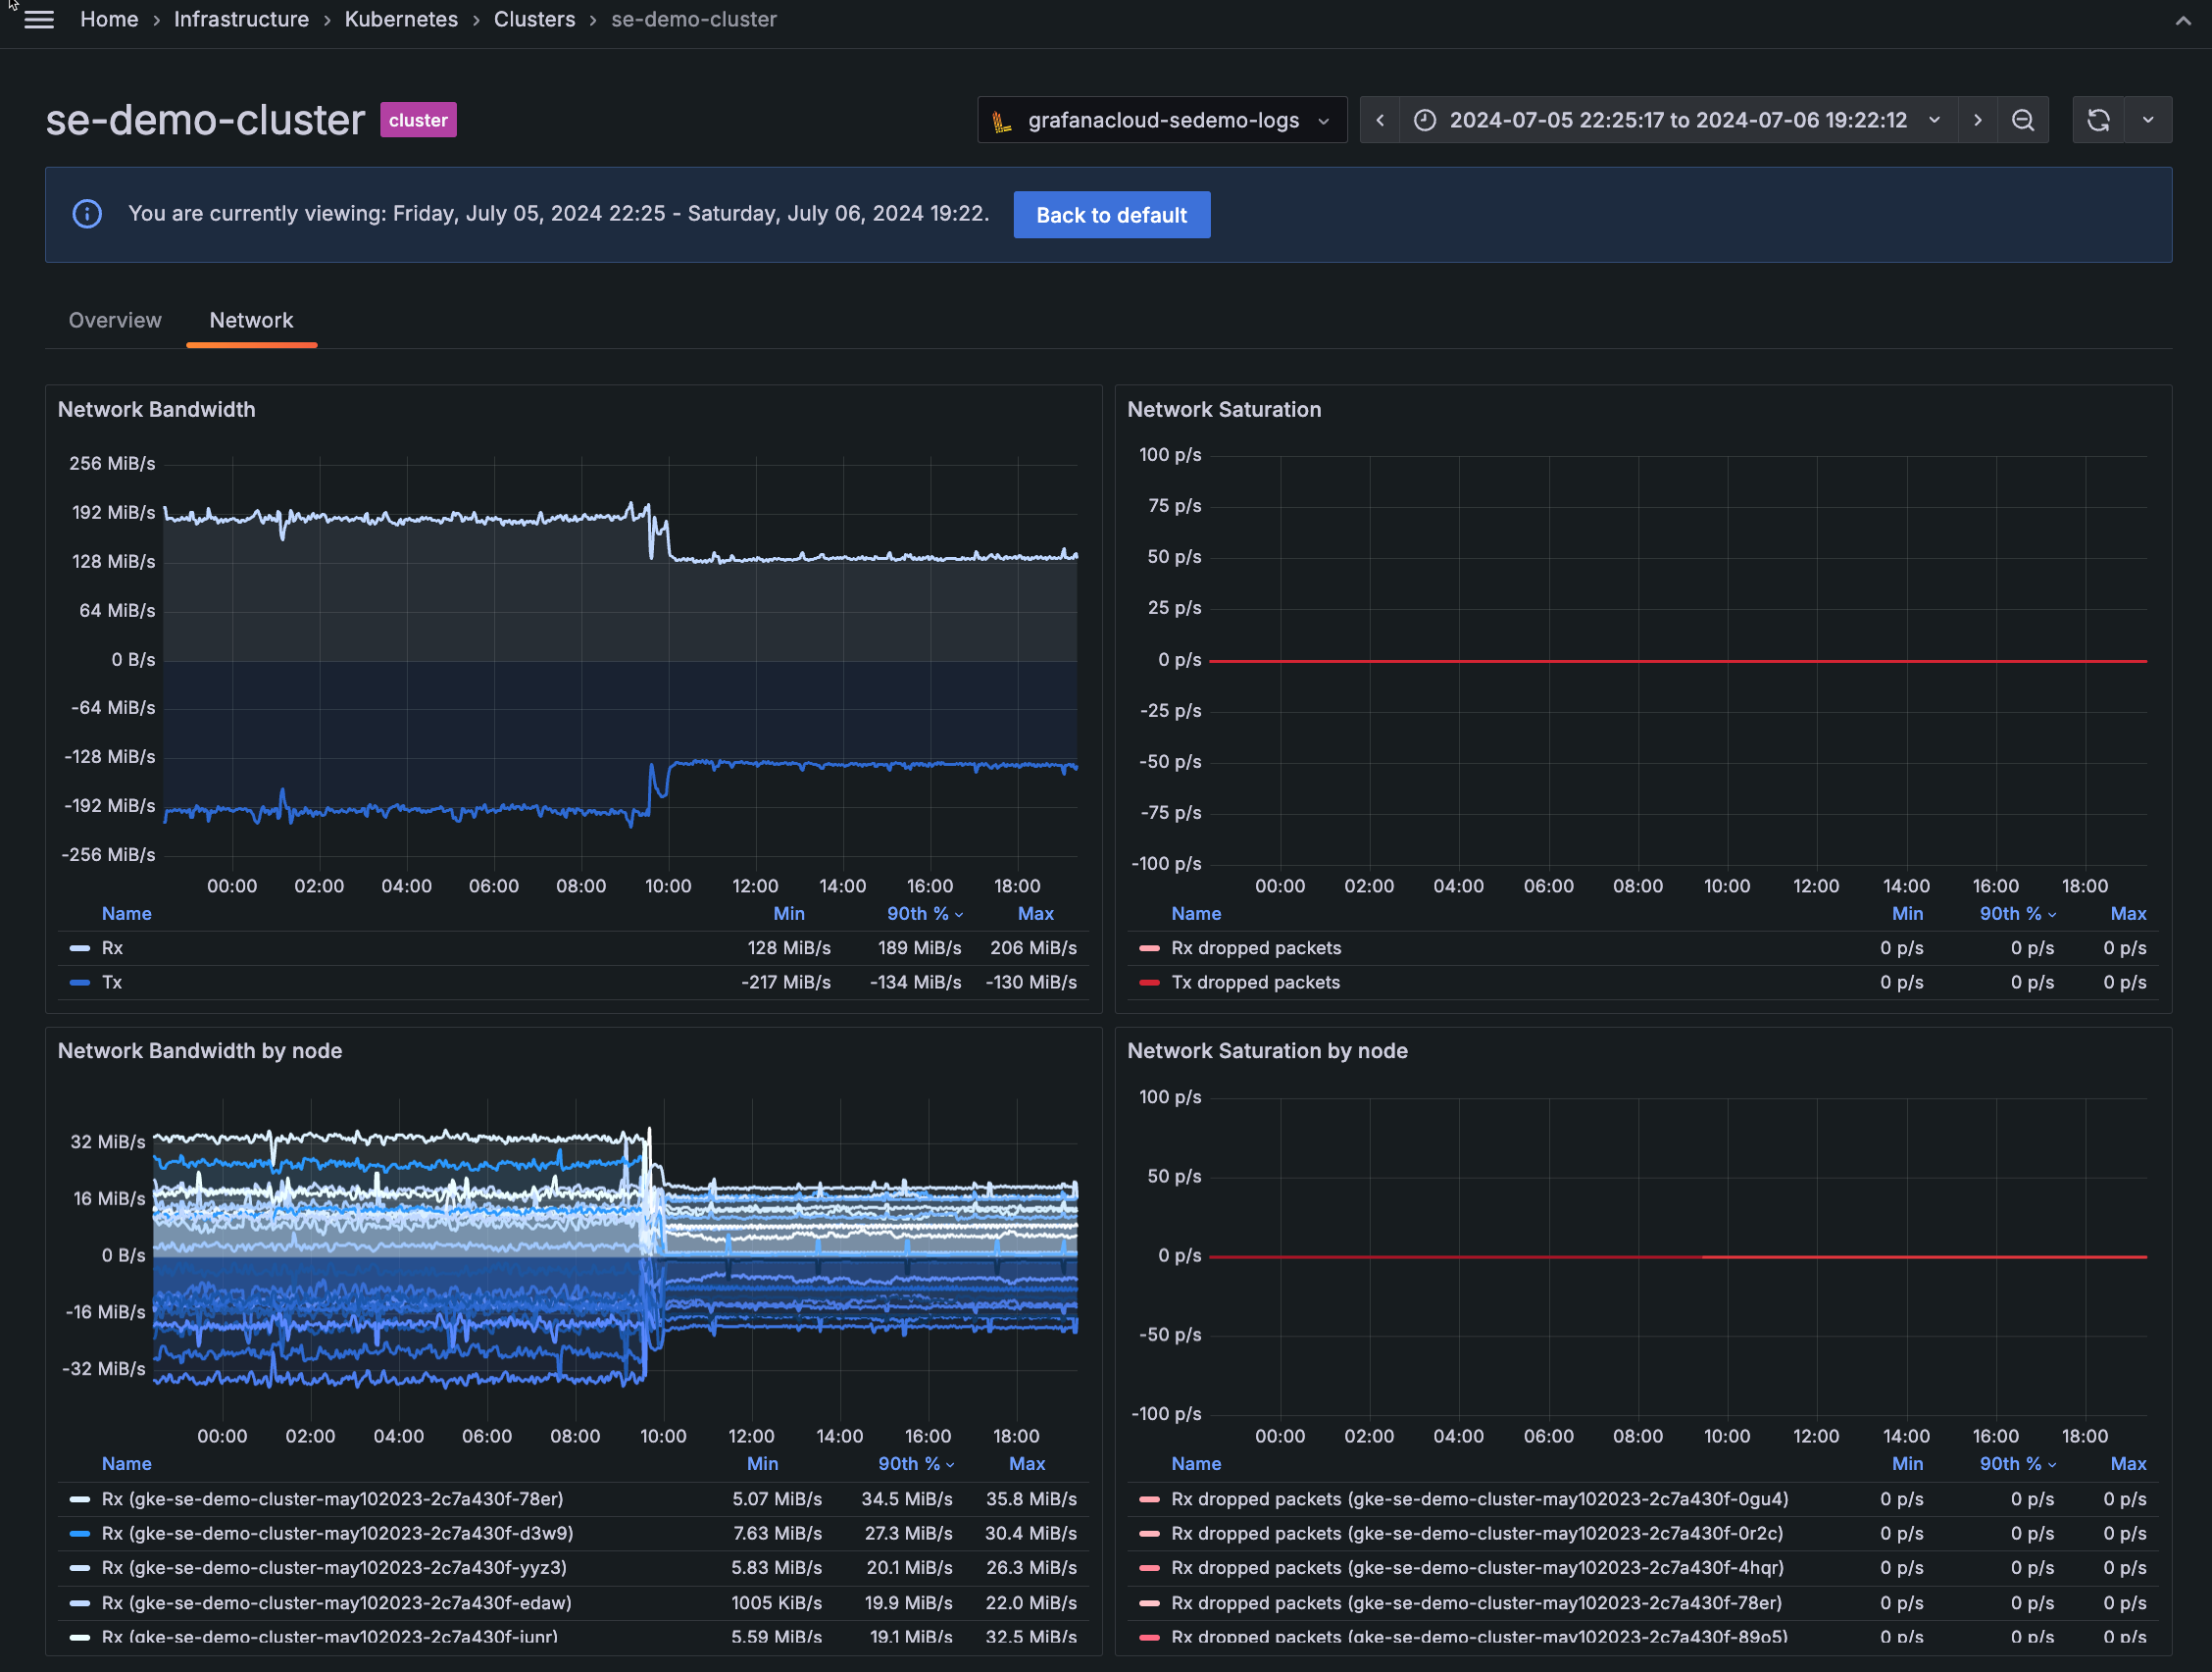
Use the network panels to understand when bandwidth limits are causing network saturation, which can lead to dropped packets. On any detail page for Cluster, namespace, workload, Node, or Pod, click the Network tab to view:
- Network Bandwidth Rx/Tx: Shows the rate of received and transmitted bytes
- Network Saturation Rx/Tx dropped packets: Shows rate of received and transmitted packets dropped
- Network Bandwidth and Network Saturation by Node, workload, or Pod: Shows the bandwidth and saturation by object

Network bandwidth and saturation panels for a Cluster
With Grafana Play, you can explore and see how it works, learning from practical examples to accelerate your development. This feature can be seen on the Network tab of this namespace details page.
Was this page helpful?
Related resources from Grafana Labs



