Overview of Grafana Kubernetes Monitoring Helm chart
When you use the easy deployment process in Kubernetes Monitoring, the Grafana Kubernetes Monitoring Helm chart is adjusted based on your choices for configuration.
As improvements are made to Kubernetes Monitoring, the Helm chart is updated as well.
Benefits of Helm chart
The Helm chart deploys software as well as a tuned configuration to monitor your Cluster. This means the chart:
- Gathers the appropriate metrics to make the Grafana Kubernetes Monitoring experience work
- Is built to move metrics, logs, traces, and profiles to Grafana Cloud, so you’re not hosting them anywhere else
- Captures all signals: Metrics, logs, traces, and profiles, and can easily extend from Kubernetes infrastructure metrics to application observability data.
Default installation with Helm chart
The Helm chart installs the following items by default for infrastructure and application monitoring.
If you select all collection choices during configuration, the following items install as part of installation and configuration:
- Grafana Alloy instances: Collect metrics, Pod logs, traces, and Kubernetes events. If you choose to enable traces, Alloy becomes configured to receive traces and forwards them to Grafana Cloud Traces.
- kube-state-metrics Helm chart: Deploys a kube-state-metrics (KSM) Deployment and Service, along with some other access control objects.
- Node Exporter
- OpenCost for cost metrics
- Kepler for energy metrics
Note
You can choose to switch off the collection of metrics, logs, events, traces, costs, or energy metrics during the configuration process.
Grafana Alloy scrapes the following targets by default:
The default ConfigMap that results from the configuration process creates allowlists. These allowlists are configured to keep a subset of metrics used by the Kubernetes Monitoring frontend, alerts, and recording rules. You can optionally do any of these with an allowlist:
- Modify it.
- Replace it with a blocklist by using the
dropdirective. - Omit it entirely.
Charts and subcharts
The Grafana Kubernetes Monitoring Helm chart deploys a complete monitoring solution for your Cluster. It includes all of the backing systems listed in Tools installed with Helm chart, and all the configuration to make these systems run. The Grafana Alloy Helm chart, which is deployed by the Kubernetes Monitoring Helm chart, simply deploys Alloy.
Tools installed with Helm chart
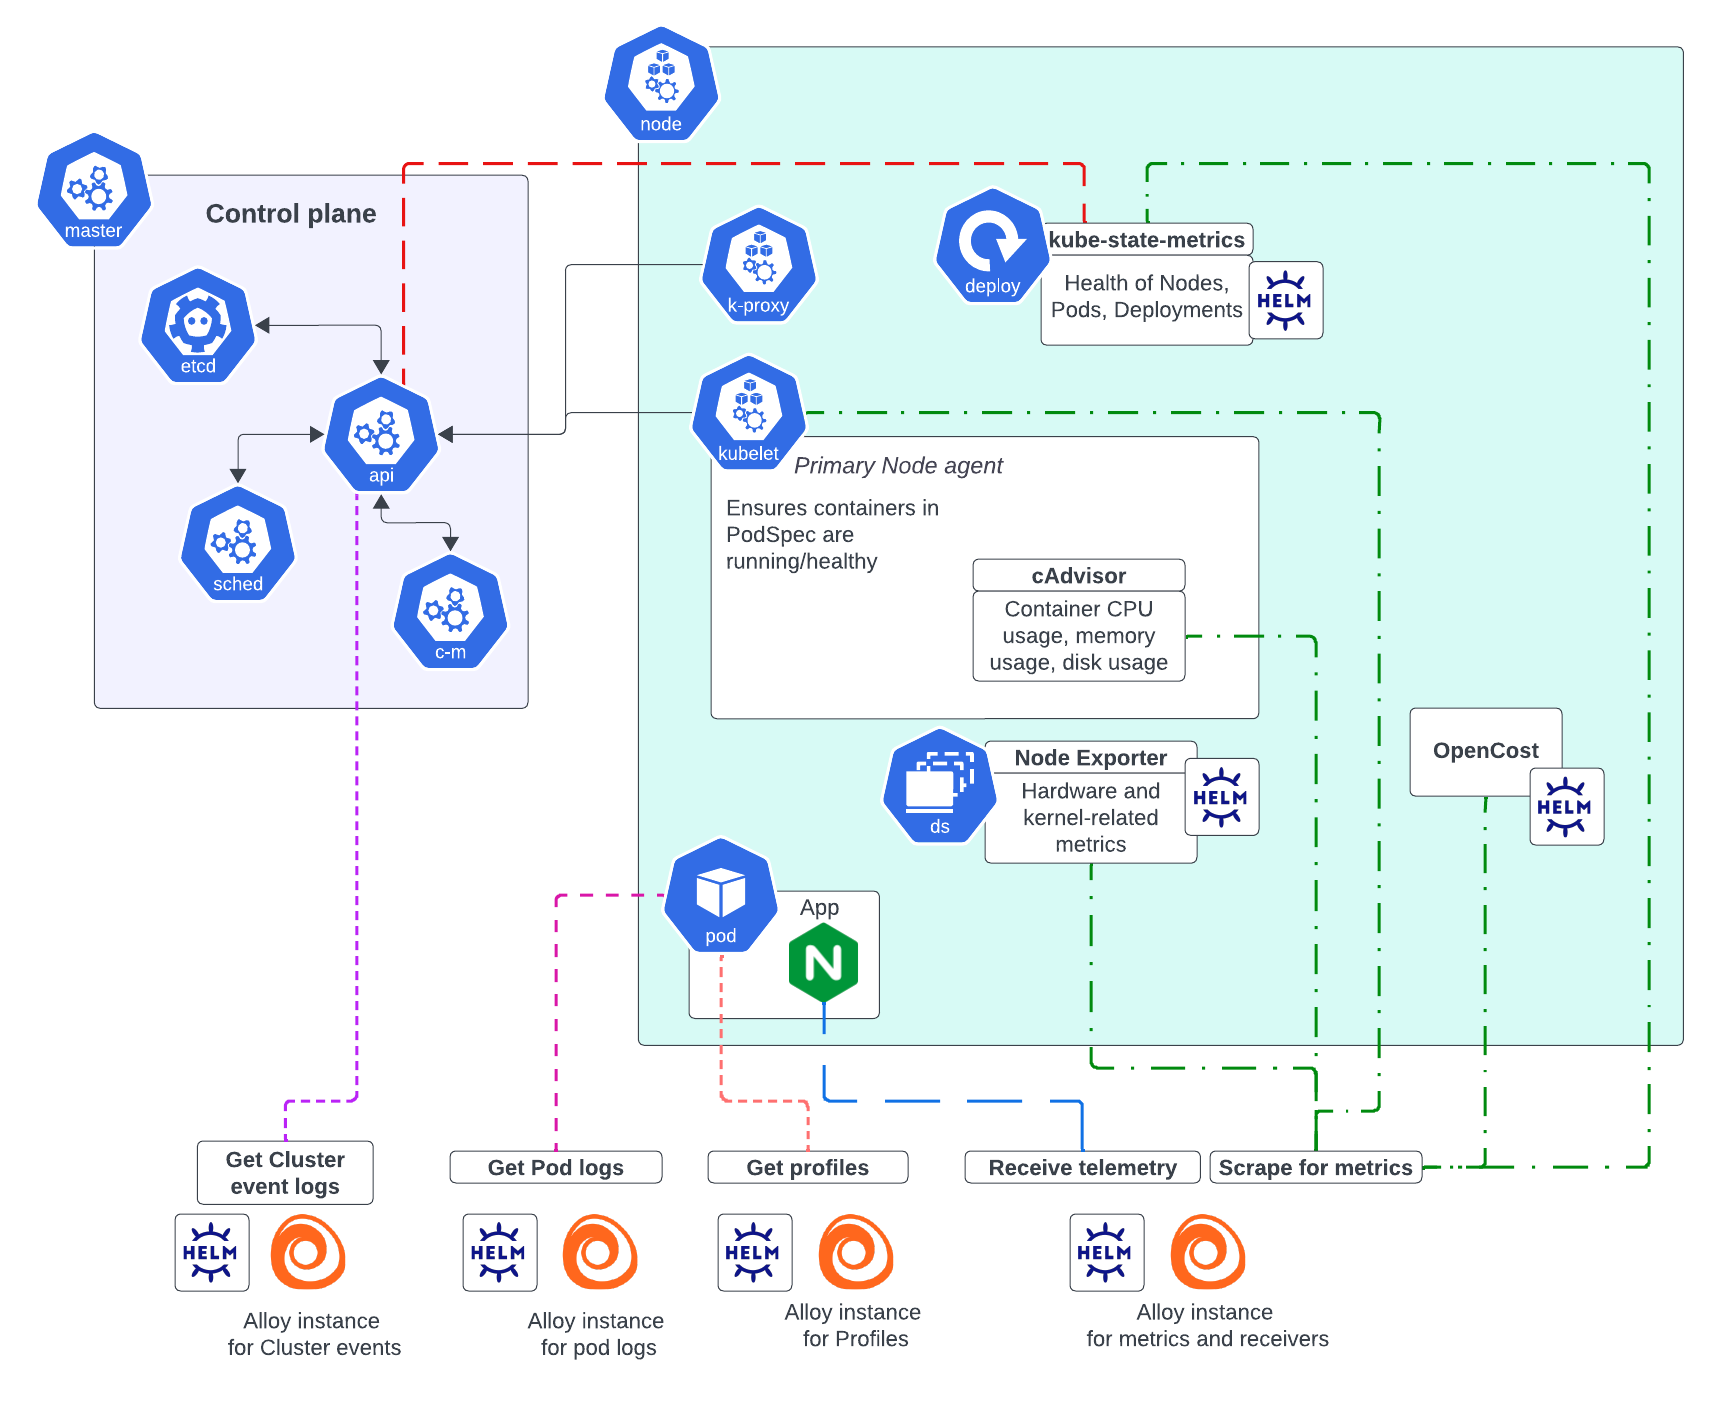
The Helm chart installs the following for monitoring infrastructure if you choose to collect metrics, Pod logs, Cost metrics, and Cluster Events. For applications, the chart installs telemetry receivers. All elements installed by the Helm chart are automatically updated.
kube-state-metrics, to listen to the API server and generate metrics on the health of objects such as deployments, Nodes, and Pods. A service that generates metrics from Kubernetes API objects, and uses
client-goto communicate with Clusters. For Kubernetes client-go version compatibility and any other related details, refer to kube-state-metrics.Node Exporter, to provide hardware device and kernel-related metrics. Exports Prometheus metrics that indicate the health and state of Nodes in a Cluster.
OpenCost, to calculate Kubernetes infrastructure and container costs. Requires Kubernetes 1.8+ clusters.
An Alloy Deployment for Cluster Events, to get logs from the API server
An Alloy DaemonSet to retrieve Pod logs
An Alloy StatefulSet for metrics and application data, to get metrics from:
Kubelet, the primary Node agent which ensures containers are running and healthy- Node Exporter
- OpenCost
- cAdvisor, which provides container CPU, memory, and disk usage
- kube-state-metrics
This StatefulSet also opens up receivers for accepting application metrics, logs, and traces.
An Alloy DaemonSet to gather profiles
The chart creates configuration files for Grafana Alloy.
Deployment
After you have made configuration choices, the values.yaml file is altered to reflect your selections for configuration.
When you deploy the chart with the command available in the configuration wizard, the chart installs the appropriate elements.
Four separate instances of Alloy deploy so that there are no issues with scaling.
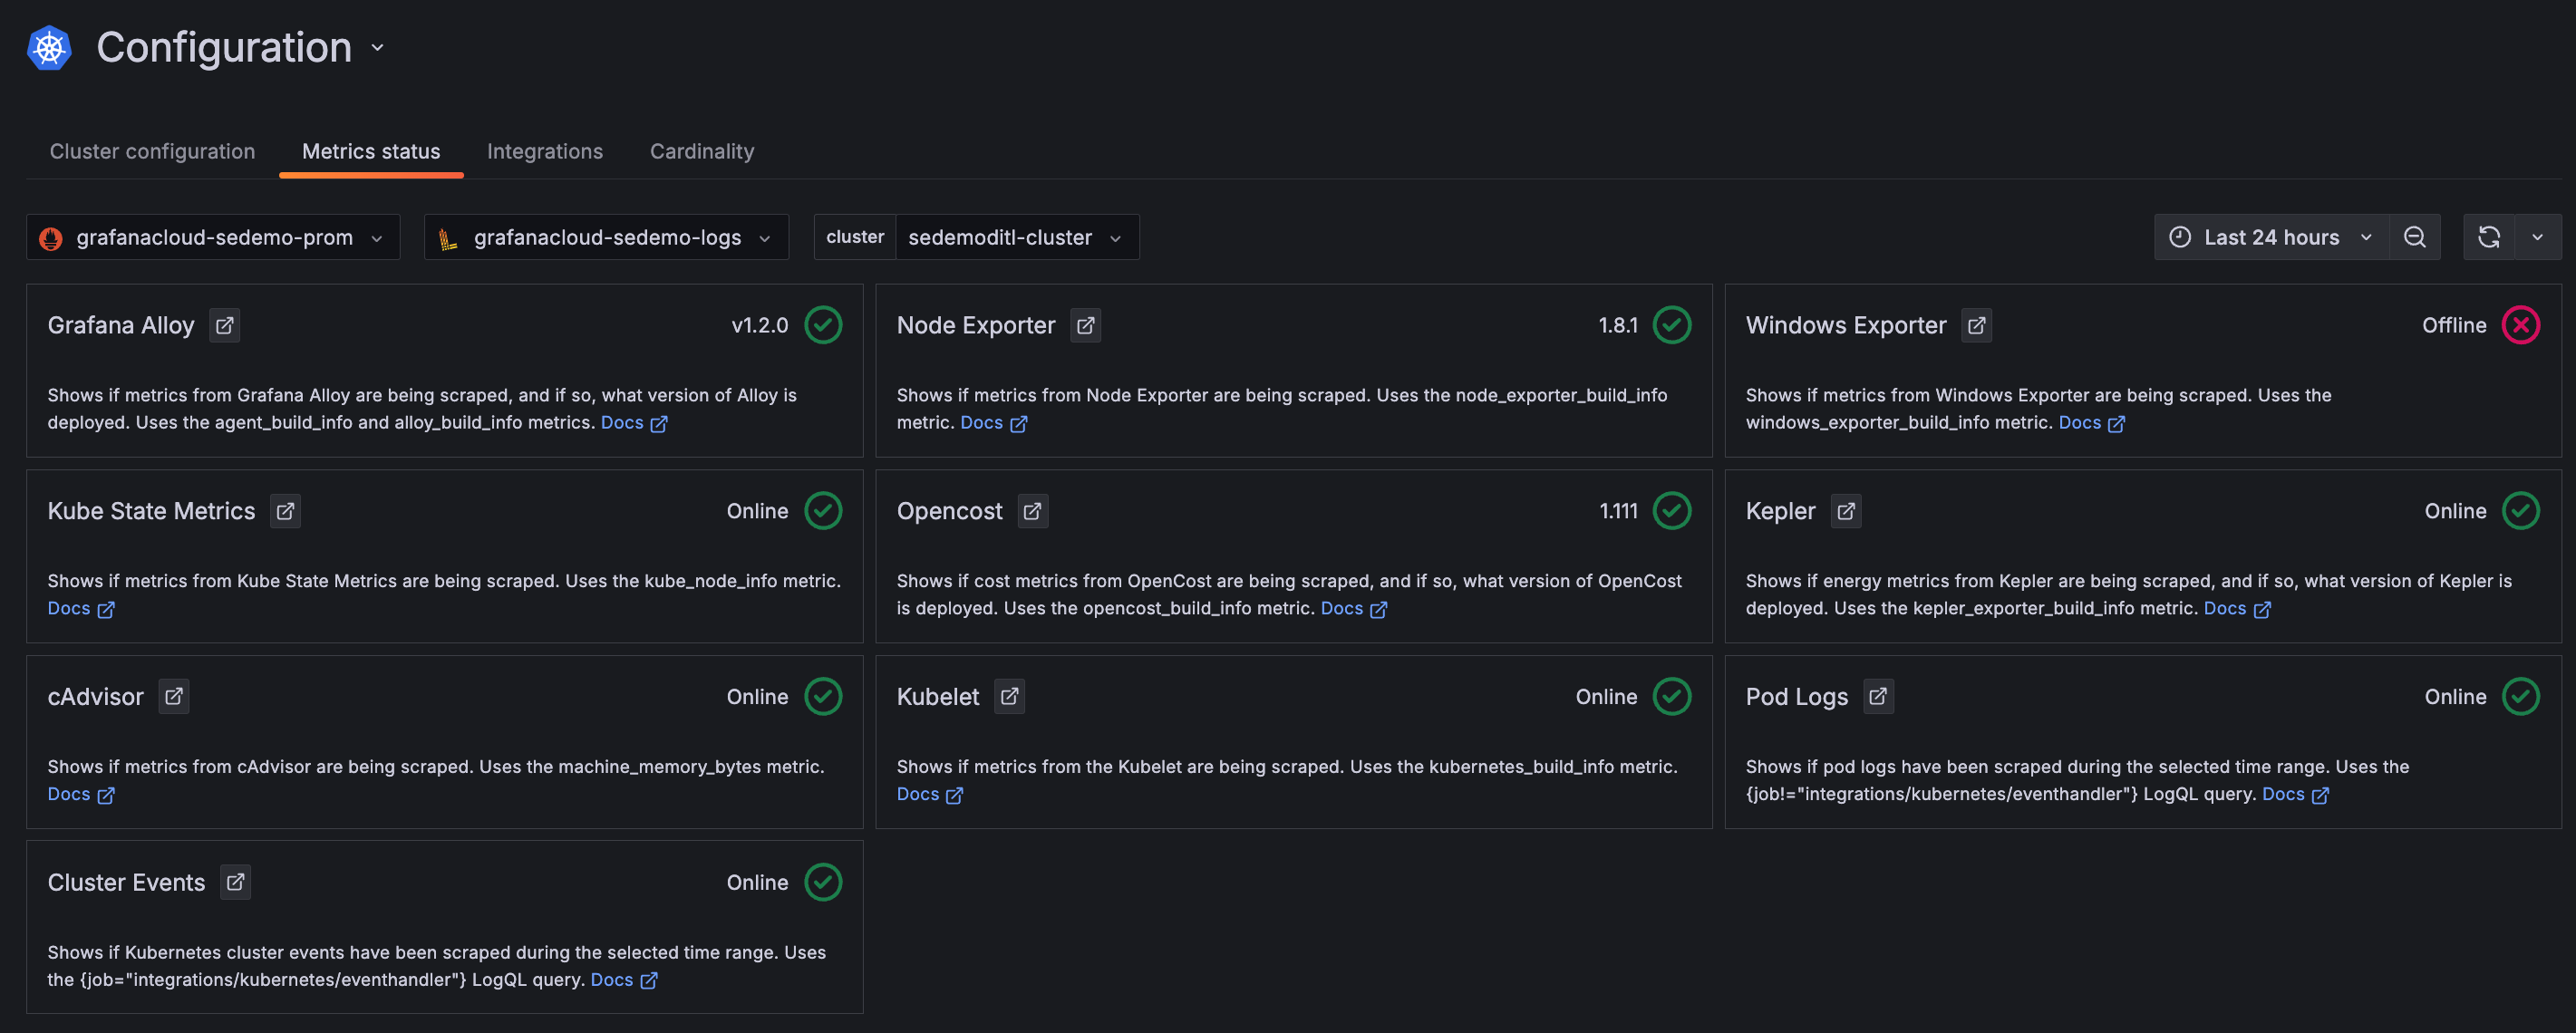
After deployment, you can check the Metrics status tab under Configuration. This page provides a snapshot of the overall health of the metrics being ingested.

Metrics management
To learn more about managing metrics, refer to Metrics management and control.
Customization
You can also customize the chart for your specific needs and tailor it to specific cluster environments. For example:
- Your configuration might already have an existing kube-state-metrics in your Cluster, so you don’t want the Helm chart to install another one.
- Enterprise clusters with many workloads running can have specific requirements.
Refer to the Examples directory of the Helm chart to view the values.yaml file when you have a specific modification you want to make.
You can also look at the output.yaml and other files included in the examples.
Each of these examples is tested to ensure they work properly.
Troubleshoot
Refer to Troubleshooting for any issues that occur after configuration.


