Overview of Grafana Kubernetes Monitoring Helm chart
The Grafana Kubernetes Monitoring Helm chart offers a complete solution for configuring infrastructure, zero-code instrumentation, and gathering telemetry. The benefits of using this chart include:
- Flexible architecture
- Compatibility with existing systems such as OpenTelemetry and Prometheus Operators
- Dynamic creation of Alloy objects based on your configuration choices
- Scalability for all Cluster sizes
- Built-in testing and schemas to help you avoid errors
Release notes
Refer to Helm chart release notes for all updates.
Helm chart structure
The Helm chart includes the following folders:
- charts: Contains the chart for each feature
- collectors: The values files for each collector
- destinations: The values file for each destination
- docs: The settings for Alloy, example files for each feature and each destination
- schema mods: Schema modules to prevent input errors
- scripts
- templates: Templates used by the Helm chart
- tests: A set of tests to validate chart functionality to ensure it works as expected
Features
In addition to the required contents for any Helm chart, this chart has guidance for each feature. A feature is a common monitoring task that contains:
- The Alloy configuration used to discover, gather, process, and deliver the appropriate telemetry data
- Additional Kubernetes workloads to supplement Alloy’s functionality
Each feature contains multiple configuration options. You can enable or disable a feature with the enabled flag.
The following features are available:
- Annotation autodiscovery: Collects metrics from any Pod or Service that uses a specific annotation
- Application Observability: Opens receivers to collect telemetry data from instrumented applications, including tail sampling
- Beyla: Options for enabling zero-code instrumentation with Grafana Beyla
- Cluster events: Collects Kubernetes Cluster events from the Kubernetes API server
- Cluster metrics: Collects metrics about the Kubernetes Cluster, including the control plane
- Node logs: Collects logs from Kubernetes Cluster Nodes
- Pod logs: Collects logs from Kubernetes Pods
- Profiling: Gathers profiles from the Kubernetes Cluster and delivers them to Pyroscope
- Prometheus Operator objects: Collects metrics from Prometheus Operator objects, such as PodMonitors and ServiceMonitors
- Service integrations: Collect profiles using Pyroscope
Packages installed with Helm chart
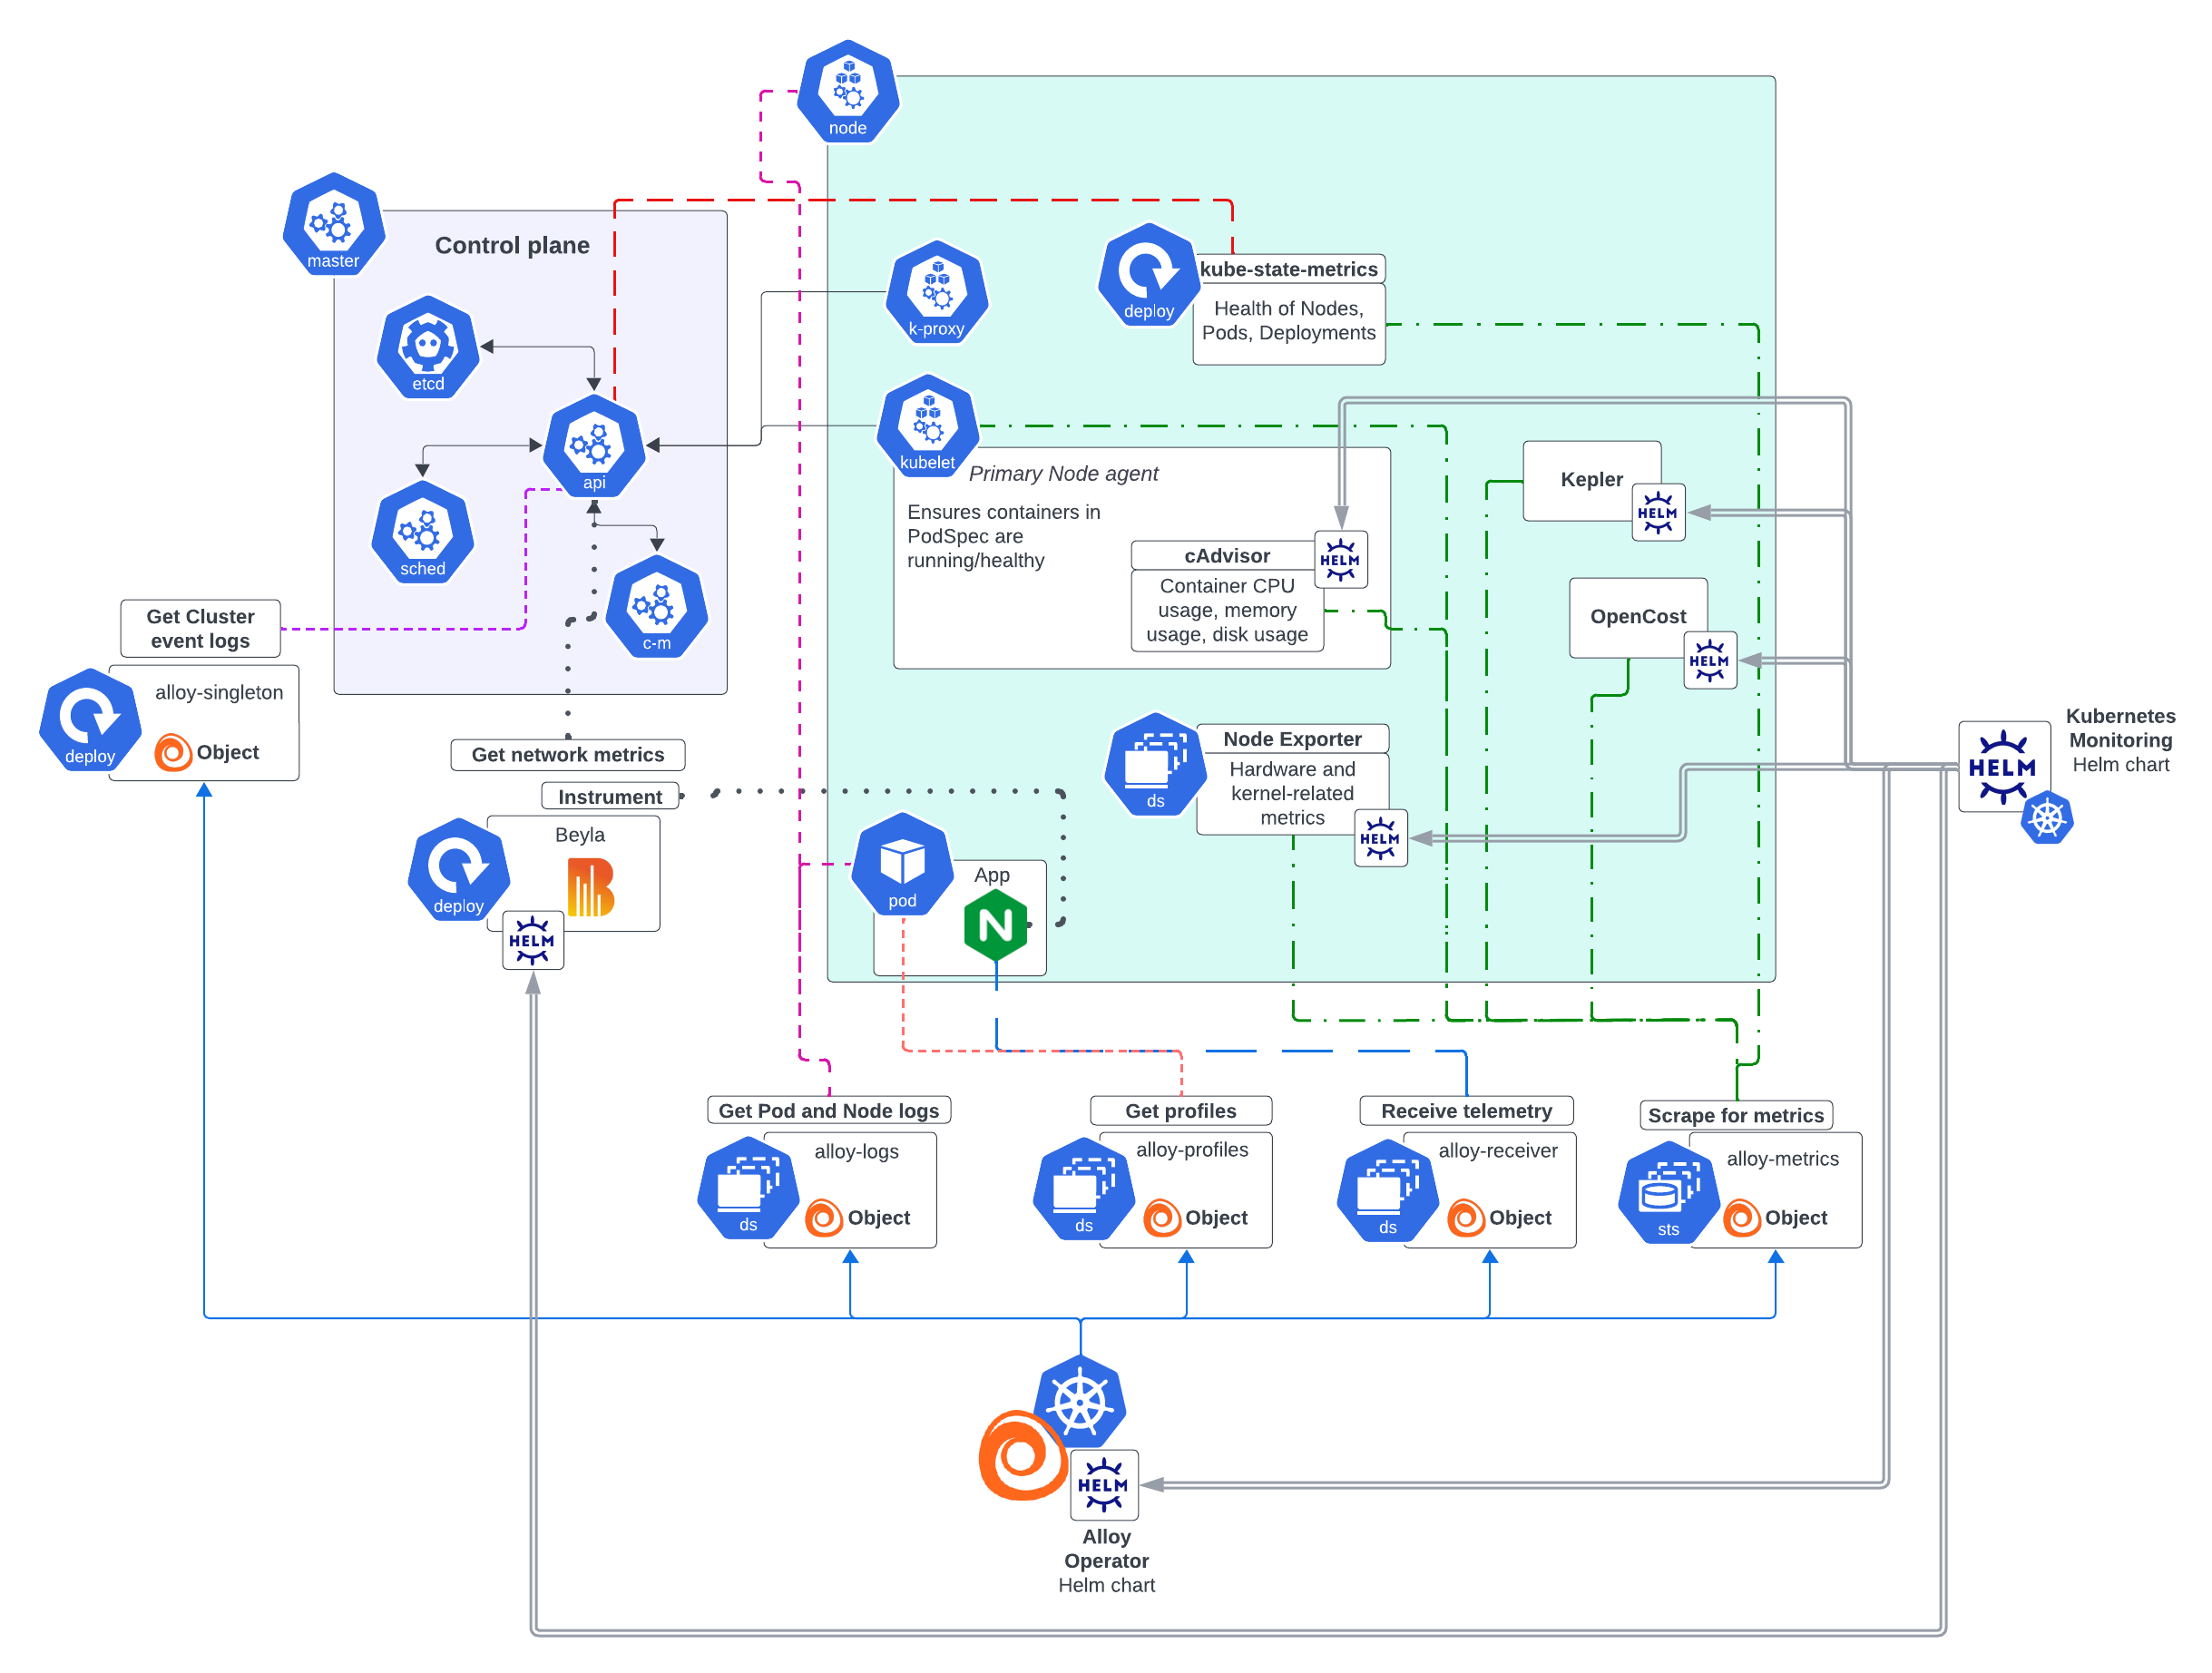
The Grafana Kubernetes Monitoring Helm chart deploys a complete monitoring solution for your Cluster and applications running within it. The chart installs systems, such as Node Exporter and Grafana Alloy Operator, along with their configuration to make these systems run. These elements are kept up to date in the Kubernetes Monitoring Helm chart with a dependency updating system to ensure that the latest versions are used.
The Helm chart installs Alloy Operator, which renders a kind: Alloy object dynamically that depends on the options you choose for configuration. When an Alloy object is deployed to the Cluster based on the values.yaml file, Alloy Operator:
- Determines the workload type and creates the components needed by the Alloy object (such as file system access, permissions, or the capability to read secrets)
- Performs a Helm install of the Alloy object and its components

The Helm chart creates configuration files for the Grafana Alloy instances, and stores them in ConfigMaps.
Note
Multiple instances of Grafana Alloy support the scalability of your infrastructure. To learn more, refer to Deployment of multiple Alloy instances.
All configuration related to telemetry data destinations are automatically loaded onto the Grafana Alloy instances that require them.
Infrastructure metrics
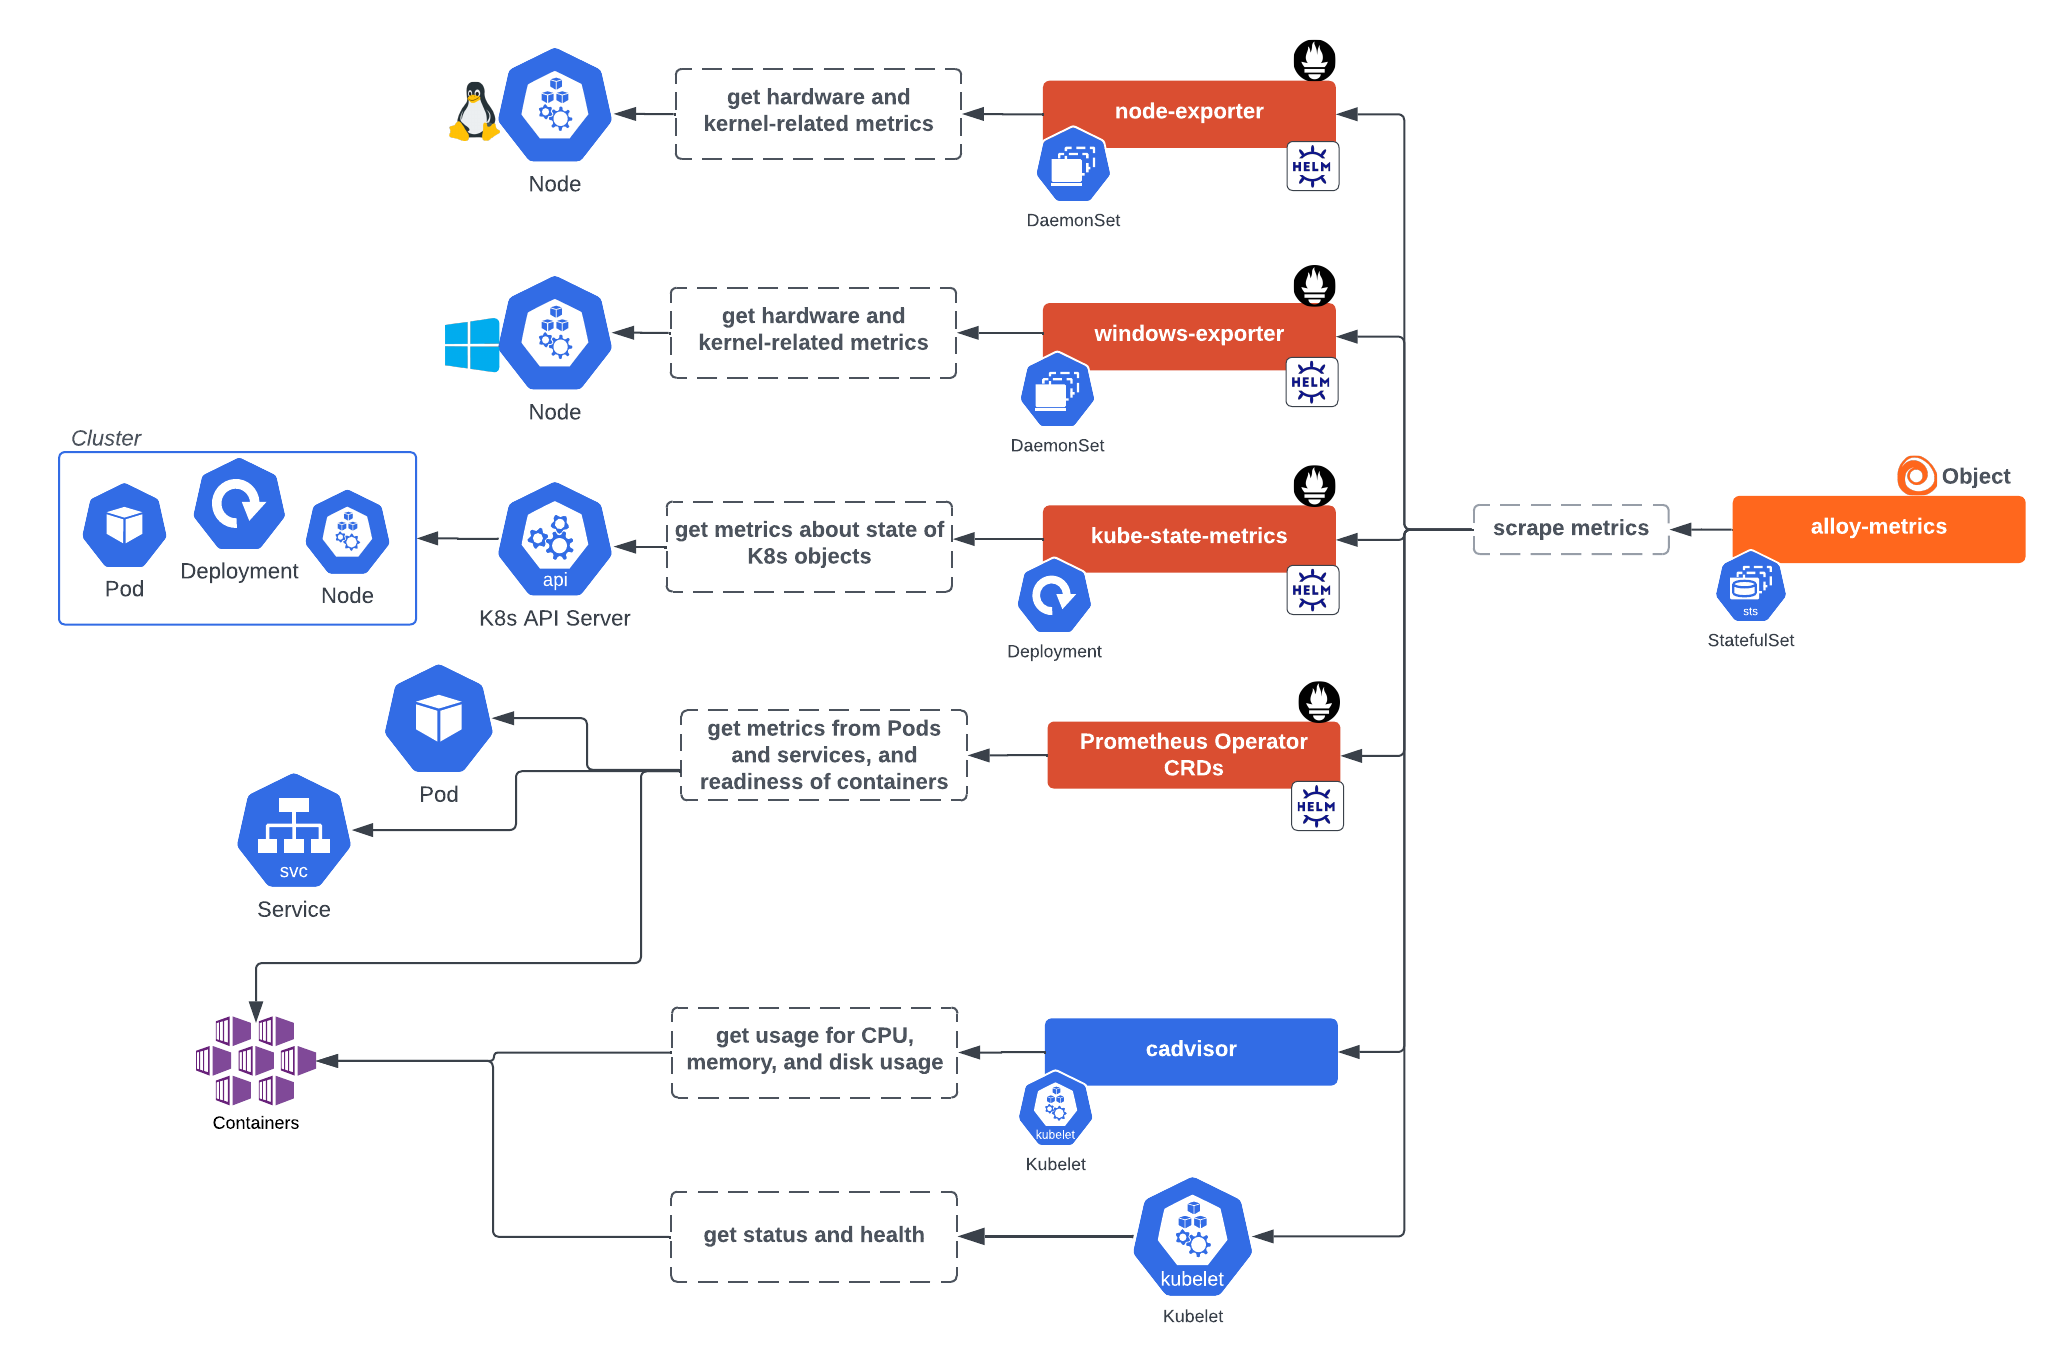
Alloy Operator installs an alloy-metrics StatefulSet instance which gathers metrics related to the Cluster itself and accepts metrics, logs, and traces via receivers. This instance can retrieve metrics from:
kubelet, the primary Node agent which ensures containers are running and healthy- cAdvisor, which provides container CPU, memory, and disk usage
- Node Exporter within a Daemonset, which gathers hardware device and kernel-related metrics from Linux Nodes of the Cluster. The exported Prometheus metrics indicate the health and state of Nodes in the Cluster.
- Windows Exporter within a Daemonset, which provides hardware device and kernel-related metrics from Windows Nodes. The exported Prometheus metrics indicate the health and state of Nodes in the Cluster.
- kube-state-metrics within a Deployment, which listens to the API server and generates metrics on the health of objects inside the Cluster such as Deployments, Nodes, and Pods.
This service generates metrics from Kubernetes API objects, and uses
client-goto communicate with Clusters. For Kubernetes client-go version compatibility and any other related details, refer to kube-state-metrics. - Prometheus Operator CRDs, provide the custom resources for the Prometheus Operator. Use when you want to deploy PodMonitors, ServiceMonitors, or Probes.

This Alloy instance can also gather metrics from:
- OpenCost, to calculate Kubernetes infrastructure and container costs. OpenCost requires Kubernetes 1.8+ Clusters.
- Kepler for energy metrics
Infrastructure logs
The following collectors retrieve logs:
- An alloy-singleton Deployment instance for Cluster events, to get Kubernetes lifecycle events from the API server and transform them into logs
The alloy-singleton instance is responsible for anything that must be done on a single instance, such as gathering Cluster events from the API server. This instance does not support clustering, so only one instance should be used.
![Alloy singleton instance installed by Helm chart to gather events Alloy singleton instance installed by Helm chart to gather events]()
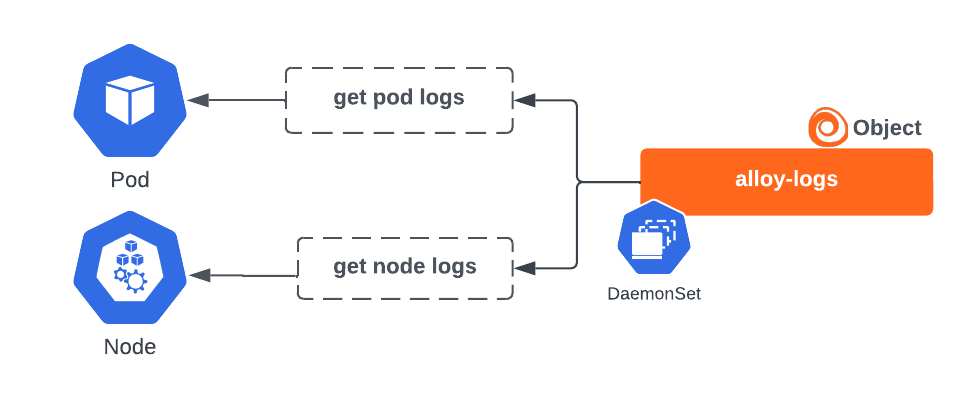
Alloy singleton instance installed by Helm chart to gather events - An alloy-logs DaemonSet instance to retrieve Pod logs and Node logs
By default, it uses HostPath volume mounts to read Pod log files directly from the Nodes. It can alternatively get logs via the API server, and be deployed as a Deployment.
![Alloy logs instance for gathering logs Alloy logs instance for gathering logs]()
Alloy logs instance for gathering logs
Application telemetry
The Alloy Operator can also create the following to gather metrics, logs, traces, and profiles from applications running in the Cluster:
- An alloy-receiver DaemonSet instance, which opens receiver ports to process data delivered directly to itself from applications instrumented with OpenTelemetry SDKs
![Alloy receiver instance installed by Helm chart to receive telemetry Alloy receiver instance installed by Helm chart to receive telemetry]()
Alloy receiver instance installed by Helm chart to receive telemetry - An alloy-events DaemonSet instance to gather profiles
![Alloy profiles instance installed by Helm chart and the profiles gathered Alloy profiles instance installed by Helm chart and the profiles gathered]()
Alloy profiles instance installed by Helm chart and the profiles gathered
Automatic instrumentation
With the Helm chart, you can install a Grafana Beyla DaemonSet to perform zero code instrumentation of applications and gather network metrics.

Deployment of multiple Alloy instances
Multiple instances of Grafana Alloy are deployed instead of one instance that includes all functions. This design is necessary for security and balancing functionality and scalabilty.
Security
The use of distinct instances minimizes the security footprint required. For example, the alloy-logs instance may require a HostPath volume mount, but the other instances do not. Instead they can be deployed with a more restrictive and appropriate security context. Each object, whether Alloy, Node Exporter, cAdvisor, or Beyla is restricted to the permissions required for it to perform its function, leaving Grafana Alloy to act solely as a collector.
Functionality/scalability balance
Each instance has unique functionality and scalability requirements. For example, the default functionality of the alloy-log instance is to gather logs via HostPath volume mounts, which requires the instance to be deployed as a DaemonSet. The alloy-metrics instance is deployed as a StatefulSet, which allows it to be scaled (optionally with a HorizontalPodAutoscaler) based on load. Otherwise, it would lose its ability to scale. The alloy-singleton instance cannot be scaled beyond one replica, because that would result in duplicate data being sent.
Images
The following is the list of images potentially used in the 3.1.0 version of the Kubernets Monitoring Helm chart.
Alloy
- Image: docker.io/grafana/alloy:v1.9.2
- Description: Always used. The telemetry data collector.
- Enabled with:
alloy-____.enabled=true - Deployed by: Alloy Operator
Alloy Operator
- Image: ghcr.io/grafana/alloy-operator:1.1.2
- Description: Always used. Deploys and manages Grafana Alloy collector instances.
Beyla
- Image: docker.io/grafana/beyla:2.2.3
- Description: Performs zero-code instrumentation of applications on the Cluster, generating metrics and traces.
- Enabled with:
autoInstrumentation.beyla.enabled=true
Config Reloader
- Image: quay.io/prometheus-operator/prometheus-config-reloader:v0.81.0
- Description: Alloy sidecar that reloads the Alloy configuration upon changes.
- Enabled with:
alloy-____.configReloader.enabled=true - Deployed by: Alloy Operator
Kepler
- Image: quay.io/sustainable_computing_io/kepler:release-0.8.0
- Description: Gathers energy metrics for Kubernetes objects.
- Enabled with:
clusterMetrics.kepler.enabled=true
kube-state-metrics
- Image: registry.k8s.io/kube-state-metrics/kube-state-metrics:v2.16.0
- Description: Gathers Kubernetes Cluster object metrics.
- Enabled with:
clusterMetrics.kube-state-metrics.deploy=true
Node Exporter
- Image: quay.io/prometheus/node-exporter:v1.9.1
- Description: Gathers Kubernetes Cluster Node metrics.
- Enabled with:
clusterMetrics.node-exporter.deploy=true
OpenCost
- Image: ghcr.io/opencost/opencost:1.1130@sha256:b313d6d320058bbd3841a948fb636182f49b46df2368d91e2ae046ed03c0f83c
- Description: Gathers cost metrics for Kubernetes objects.
- Enabled with:
clusterMetrics.opencost.enabled=true
Windows Exporter
- Image: ghcr.io/prometheus-community/windows-exporter:0.30.8
- Description: Gathers Kubernetes Cluster Node metrics for Windows nodes.
- Enabled with:
clusterMetrics.windows-exporter.deploy=true
Container image security
The container images deployed by the Kubernetes Monitoring Helm chart are built and managed by the following subcharts. The Helm chart itself uses a dependency updating system to ensure that the latest version of the dependent charts are used. Subchart authors are responsible for maintaining the security of the container images they build and release.
Deployment
After you have made configuration choices, the values.yaml file is altered to reflect your selections for configuration.
Note
In the configuration GUI, you can choose to switch on or off the collection of metrics, logs, events, traces, costs, or energy metrics during the configuration process.
When you deploy the chart, the Alloy Operator dynamically creates the Alloy objects based on your choices and the Helm chart installs the appropriate components required for collecting telemetry data. Separate instances of Alloy deploy so that there are no issues with scaling.
After deployment, you can check the Metrics status tab under Configuration. This page provides a snapshot of the overall health of the metrics being ingested.

Customization
You can also customize the chart for your specific needs and tailor it to specific Cluster environments. For example:
- Your configuration might already have an existing kube-state-metrics in your Cluster, so you don’t want the Helm chart to install another one.
- Enterprise Clusters with many workloads running can have specific requirements.
For links to examples for customization, refer to the Customize the Kubernetes Monitoring Helm chart.
Troubleshoot
For Kubernetes Monitoring configuration issues, refer to Troubleshooting. For issues more specifically related to the Helm chart, refer to Troubleshoot the Kubernetes Monitoring Helm chart configuration.
Metrics management
To learn more about managing metrics, refer to Metrics management and control.
Uninstall
To uninstall the Helm chart:
Delete the Alloy instances:
kubectl delete alloy --all --namespace <namespace>Uninstall the Helm chart:
helm uninstall --namespace <namespace> grafana-k8s-monitoring


